
Abstract
Subspace clustering, which detects all clusters in affine subspaces of a given high dimensional vector space, is used in various applications, including e-business. The performance and result of a subspace clustering algorithm highly depend on the parameter values the algorithm is tuned to execute. It may not be clear if the resultant clusters are indeed meaningful ones in a given dataset or if the result is just an artifact of the given parameter values. Although choosing the proper parameter values is crucial for both clustering quality and performance of the algorithm, there has been little research or discussion on this topic. In this paper, we propose a methodology for determining proper values of parameters in subspace clustering. Along with it, we validate our approach through experimental analysis, using various real-world datasets. The study can serve as a reference model for any subspace clustering experiment in which parameter setting is required to output clusters of quality.
1. Introduction
Recently, a group of algorithms called “subspace clustering” [1–4] are attracting academic interest for clustering high dimensional data. Clustering is a crucial task that is used in various applications, with the aim of detecting the dense regions of a given dataset, or as a prerequisite step for further processes, such as classification.
Subspace clustering can be widely used in many smart business application areas, which may include, but are not limited to the following [5, 6].
Product recommendations: the collaborative filtering technique is well known, and popularly used in the domain of product recommendation [7]. If the information conveying which customers have purchased what products is represented in a vector data model, to find out which customers have shown a similar purchase history becomes a subspace clustering problem [8]. Smart sensor logs: as electronic devices and storage media become cheaper and small devices such as smart phones become popular, the log information that is collected by using smart sensors is attracting more interest from industry. The log may represent the users' patterns and can be used in product searching or recommendation [9]. The number of sensors and their collecting data can be high and numerous. The log information can also be represented in a vector model. Social network services: many social media sites such as Twitter provide users with a “follow” feature, which enables users to consume their own personalized contents. The user subscription information can be modelled in a high dimensional vector model [9]. Clustering users means to find out a group of users who have similar interests.
However, technological improvements in sensor, transmission, or storage domain have led to a flooding of high dimensional data, of which the dimensionality is typically equal to or greater than 10. With traditional clustering algorithms, which regard all dimensions equally, satisfactory results are hardly obtained, as the distance difference between pairs of data objects collapses. Unlike traditional approaches, subspace clustering has been proposed as an alternative to detect all clusters residing in affine subspaces of a given high dimensional vector space.
Adopting a density-based clustering paradigm [10], a subspace cluster is defined as a connected component of objects where two data objects are considered as “connected,” if and only if the distance between the projections of two objects onto a given affine subspace is not greater than a given bandwidth. One advantage of a density-based clustering paradigm is that it can detect clusters with arbitrary shapes, so too for subspace clustering. For this reason, considerable researches have been published on this topic.
However, most of these algorithms share a critical problem in common, that of parameters. To conduct clustering, a number of parameters should be employed, some of which are as follows: bandwidth (ε), density threshold (τ), minimum cluster size (
For the last two parameters, 1% of the whole dataset size and 0.1 have been widely used in multiple works [2, 5]. However, there has been little literature or work on selecting the first two parameters, which heavily affect final clustering results. For example, if the value of ε is too large, the result may include too much noise. In contrast, if the value of ε is too small, we may get lossy results. The opposite situation can occur with regard to the value of τ. Moreover, not only does the selection of parameters impact the quality of clustering results, but also it heavily impacts the efficiency of the algorithm. The running time of the algorithm falls off as the value of ε decreases, and the value of τ increases, as the number of objects and connections that should be considered decreases accordingly. For these reasons, making a choice of adequate parameter values of (
However, selecting proper parameter values is not a simple task, for preliminary information is not available in common. One possible method may be a trial-and-error approach, which repeatedly conducts clustering tasks with different combinations of parameter values and then finally selects the most satisfactory result. Nevertheless, this approach also has its own limit: as clustering is inherently a computation-intensive task, its running time is typically long, so trying lots of combinations of parameters may not be practical.
In this paper, we propose a parameter-search method based on random sampling. We perform the experiments to present the impact of parameters in subspace clustering and to find out their proper values in the domain. Experimental analysis shows that our approach is reasonable in various real-world datasets.
2. Strategy
To overcome the problems stated above, we propose a simple yet efficient approach. Our search strategy exploits a random sampling approach. It includes the following steps.
Determine the value of the ( Select candidate value pairs. For arbitrary Generate a random sample from the full dataset, without replacement. Run a given subspace clustering algorithm on the sample set, for all Compare the results, using quality measurement. Choose the optimal parameter pair
For the reason indicated above, the running time with
3. Experimental Setup
To validate our approach, we perform an experiment to check the efficiency of the strategy or whether this method may actually detect adequate parameter values. For the experiment, we use three real-world datasets with different dimensionality and characteristics from the UCI machine learning repository [11]: the Pendigit dataset with 16 dimensionalities and the Cell, Biodeg dataset with 30, 41 dimensionalities, respectively.
From each of these datasets, we generate 3 input sets with different size: the input set with full population is generated by repeatedly selecting 10,000 objects from the original dataset. To normalize different dimensions, all element values are converted into the z-score of the associated dimension. Then, two smaller input sets with 1,000 and 5,000 objects are generated, through random sampling without replacement.
To sum up, we prepare 9 input sets from 3 different original datasets and with 3 different sizes (Table 1).
Input datasets.

For algorithm implementation, we use a distributed version of the subspace clustering algorithm introduced in [6] which yields equivalent results to the algorithm introduced in [2], and runs on Hadoop cluster. Our Hadoop cluster consists of 16 commodity machines. For our algorithm to exploit not only MapReduce but also BSP, it uses Apache Giraph [12] for its implementation.
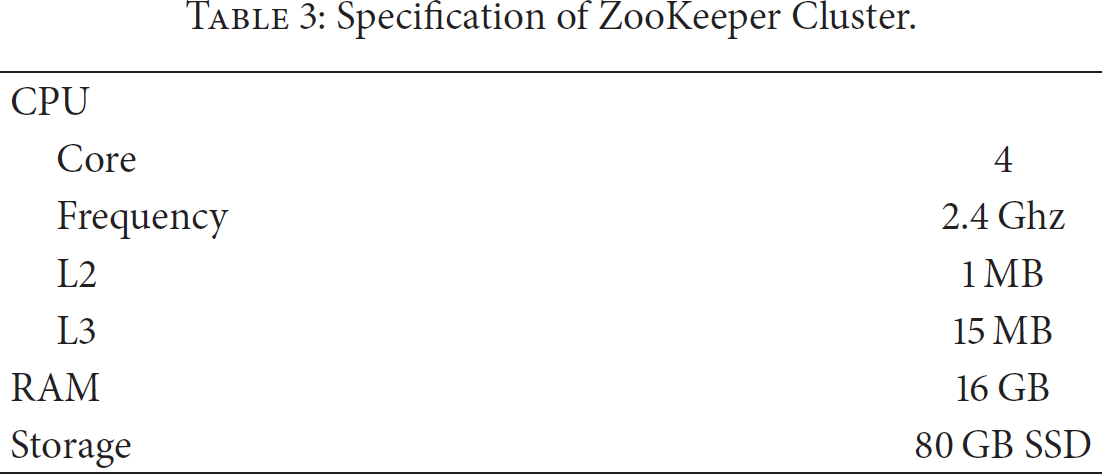
In addition, we operate an additional ZooKeeper cluster, which serves as a distributed memory. The cluster consists of 3 commodity machines. Tables 2 and 3 summarize the hardware specification of each cluster. All nodes within each cluster run on a virtual hardware system provided by DigitalOcean (https://www.digitalocean.com/), with Ubuntu 13.10 × 64 and Oracle Java Runtime Environment version 7, update 40.
Specification of Hadoop cluster.

Specification of ZooKeeper Cluster.
Using the settings in Tables 2 and 3, we compare the clustering results yielded from each input set with different (
Table 4 shows our parameter settings. As each dataset has its classification label, the quality of clustering can be measured. For accuracy measurement [13–15], we use
Parameter setup.

4. Results Analysis
Tables 5, 6, 7, 8, 9, 10, 11, 12, and 13 show the


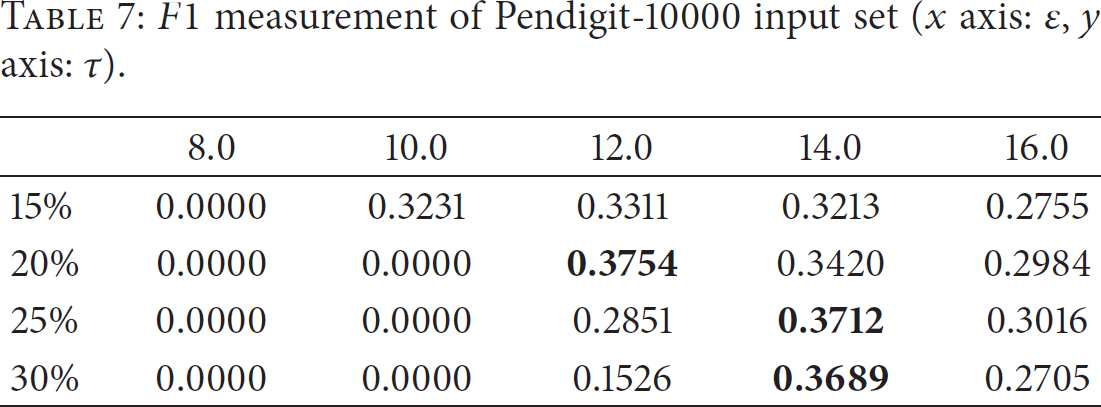


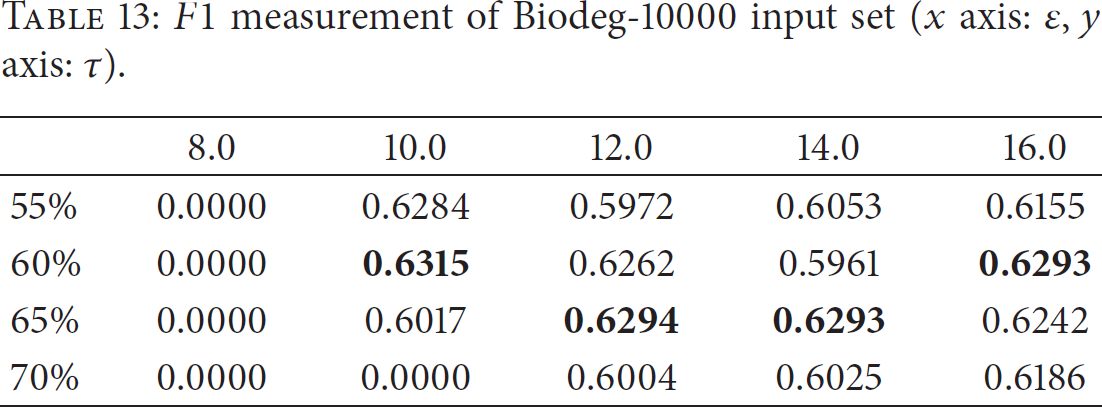
For example, Table 5 shows the
In the case of Pendigit dataset, the Pearson correlation coefficient of
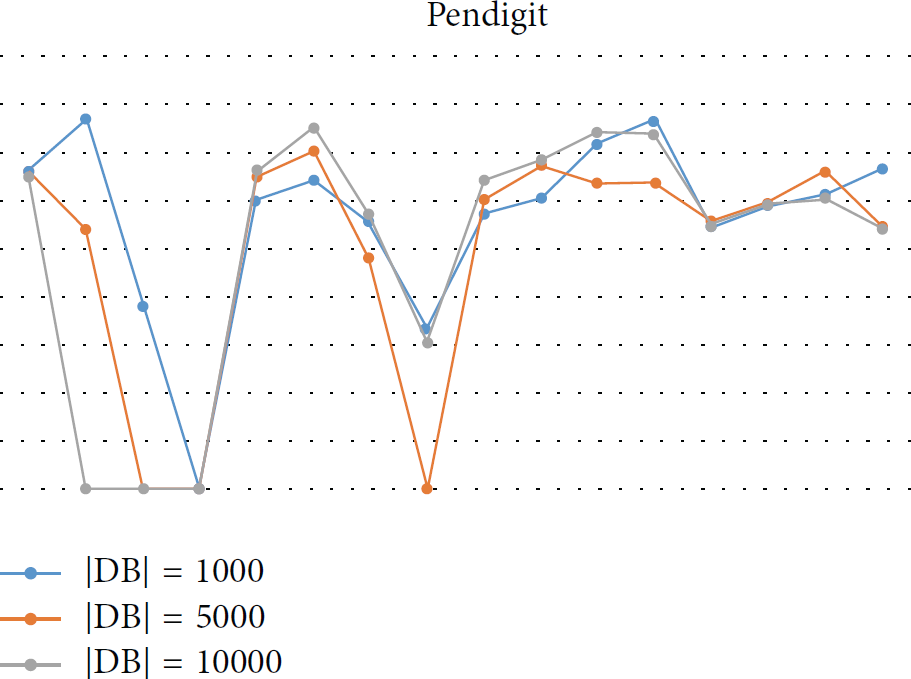


The results suggest that the value of the most adequate parameter setting is not affected by the size of the input set. That is, it is a reasonable strategy to estimate optimal parameter values with a small sample of the full dataset to achieve both time efficiency and accuracy at once, evading the time limit. However, keeping the sample rate too low is not a good choice: as shown in Figure 3, the correlation coefficient between the 10% sample and the full population was only 70.1%~76.7% of the coefficient between the 50% sample and the full population. This trend suggests that trying with too small sample set may distort the result of estimation. Moreover, trying with too small
5. Conclusions
Based on the experimental evaluation and result analysis, we propose the following methodology for estimating the optimal parameter values for subspace clustering. First, determine the value of
The advantage of this strategy may be twofold: it not only allows searching and comparison on various combinations of candidates, but also helps predictability of estimating the execution time. Experimental results with real-world datasets suggest that parameter values obtained from this approach can show the best accuracy on the full population of the input set.
Footnotes
Conflict of Interests
The authors declare that there is no conflict of interests regarding the publication of this paper.
Acknowledgment
This research was supported by the Sookmyung Women's University Research Grants (1-1403-0114).