
Abstract
Monitoring systems for the safety of building structure (SBS) can provide people with important data related to main supporting points in a building and then help people to make a reasonable maintenance schedule. However, more and more data bring a challenge for data management and data mining. In order to meet this challenge, under the framework of Wisdom Web of Things (W2T), we design a monitoring system for the SBS by using the semantic and the multisource data fusion technologies. This system establishes a dynamical data cycle among the physical world (buildings), the social world (humans), and the cyber world (computers) and provides various services in the monitoring process to alleviate engineers’ workload. Furthermore, all data in the cyber world are organized as the raw data, the semantic information, and the multisource knowledge. Based on this organization, we can concentrate on the data fusion from the viewpoints of time, space, and multisensor. At last, a prototype system powered by the semantic platform LarKC is tested from the aspects of sample performance and time consumption. In particular, noisy data (i.e., inconsistent, abnormal, or error data) are detected through the fusion of multisource knowledge, and some rule-based reasoning is conducted to provide personalized service.
1. Introduction
Today many landmark buildings with new building technologies or new building materials have gradually emerged, which always have novel appearance and unique structure. Relative to these new buildings, lots of old buildings in the city have also stepped into the stage of maintenance. Meanwhile, the large-scale urban construction will influence the safety of existing buildings. In the architectural engineering field, the safety of buildings structure (SBS), related to the safety of everyone who works and lives there, is the concern of the structural engineers and it is also an important aspect of building structural health. Building structure is a complex mechanical structure system, which is a space force system and is designed to withstand various loads. Each building has its own characteristics and responds to some kinds of stimulation inside or outside. The traditional way of ensuring the SBS is to arrange the regular manual test. According to the testing results, the maintenance and repairment of the building can be arranged. However, the test done by the engineers will cause some problems: (1) because of the different personnel experience among the engineers, the differences exist in these testing results; (2) the testing data cannot be obtained continuously, so the real-time warning cannot be realized; (3) the cost of manpower will grow higher as time goes by.
The emergence of the Internet of Things (IoT) makes it possible to monitor the real-time changes of building structure. All kinds of the data acquisition instruments (DAIs) can be connected with each other through the Internet in different ways (e.g., Wi-Fi, GPRS, or 3G), so a huge network is formed for collecting any data about things and people, and the big data about building structure is emerging step by step. As Gross [1] says, Internet will become an electronic “skin” on the earth, which connects millions of embedded electronic measuring sensors together. These will probe and monitor the cities, the endangered species, the atmosphere, the ships, the highways, the fleets of trucks, our bodies, and even our dreams. The monitoring system for the SBS is a kind of the “skin” which is installed in a building. Each sensor in this system can sense the slight change of force supporting point. The Internet of Things connects these scattered sensors together effectively to form a network, and the building health status can be monitored as a whole.
At present, some landmark skyscrapers or some bridges in the important traffic roads have been or are ready to be installed in the monitoring systems. But the different buildings often use the different monitoring systems. Moreover, the mechanical features of a building cannot be reflected by only one type of sensors. The types of sensors and the monitoring plans are also multifarious. Generally, the monitoring process for a building will last for several years, even the whole life time of the building. These objective factors lead to a result that the monitoring system for the SBS has the characteristics of long service time, complex monitoring objects, and diversified data types. When these sensed data come out continuously and momently, the engineers have to do a lot of heavy work, such as sorting and classifying data, numerical analysis, and exception handling. The buildings, the computers, and the users are three separated parts, and the intelligent level of the whole system is still relatively low. As for the informatization of city, more and more monitoring systems will be used, which will aggravate the engineer's burden. So the traditional technology has some problems in sensor management, data management, operational efficiency, and system intelligence. How to integrate these data, manage these sensors, fuse this information, and ease the engineers’ burden? All these questions appear in front of us. Therefore, it needs a systematic method that can make the monitoring system more reliable, efficient, and intelligent.
Zhong et al. proposed the notion of Wisdom Web of Things (W2T) that represents a holistic intelligence methodology for realizing the harmonious symbiosis of humans, computers, and things using the big data in a wisdom city [2]. In a wisdom city the data of every professional field is connected together with the Internet, and every field such as the energy management of a building [3], the monitoring water resource [4], and the control of traffic [5] will form an intelligent node. All these applications and their knowledge should not be limited within the specific areas, and the sharing and interconnectivity of the data among the different fields within the city scope should be taken into account. The W2T is an extension of the Wisdom Web in the IoT age. The “Wisdom” means that each of the things in the IoT can be aware of both itself and others to provide the right service for the right object at a right time and context based on multisource heterogeneous knowledge.
This paper presents a monitoring system for the SBS under the W2T framework, which can effectively perceive the structural status of various buildings in a city and integrate the real-time sensed data with the various existing knowledge. This system contains a W2T data cycle, which is not a simple combination of the social world (engineers or building owner), the physical world (buildings or sensors), and the cyber world (computers). Data, service, and action connect these three worlds. Data is the epitome of the physical world and represents the changes of it. Service derived from the fusion of sensed data and knowledge serves the humans in the social world. The social world here does not mean that the monitoring process needs manual intervention. It has three contributions in this data cycle: (1) the source of knowledge; (2) the object of service; (3) the influencer of the physical world. Finally, people can perform some operations that influence the buildings, and then the results will be reflected automatically again. The data cycle is formed, and the physical world (buildings) and the social world (humans) are connected together by the cyber world (computers).
The rest of this paper is organized as follows. Section 2 introduces the related work on the monitoring system for the SBS. Section 3 presents the monitoring system for the SBS under the framework of W2T and analyzes its whole composition and the relationship among humans, things, and computers. Section 4 gives the hierarchical organization of the raw data, the semantic information, and the multisource knowledge. All kinds of real-time data and multisource knowledge can be fused to provide personalized intelligent services. Section 5 tests the prototype system from sampling performance and query response time and provides some rules to detect the abnormal data and meet user requirements. Section 6 gives some security considerations as a knowledge sharing node. Section 7 gives the conclusions and the future work.
2. Related Work
With the economic development, the importance of SBS is becoming more and more apparent and the standard about SBS should be increased reasonably and economically [6]. The argument on reasonable settlement of SBS has lasted for a long time [7]. Experimental data is one of the bases that are used to formulate and revise the standards and is also a part of the health indicator of a building [8]. Many monitoring systems have been deployed in different buildings for the SBS. Moriconi and Naik introduced a computerized monitoring system which has been used for a few years [9]. The applications described in this paper are for concrete structures, including one steel structure that is exposed to the sea breeze on the Adriatic Coast of the City of Ancona, Marche, Italy. The system monitors and documents by means of the embedded electrodes and sends the records to a computer via a communication line both for the structure and for the weather. The collected data on the computer are saved on backup files, analyzed, and finally sent via modem to a monitoring station for further processing and dissemination to the architect, engineer, and owner. In this way, the early evaluation of the structure is possible and, consequently, the maintenance costs could be reduced, increasing both the durability and service life of the structure. Kubo et al. introduced a monitoring case in Japan [10]. They apply a combination of earthquake early warning system and real-time strong motion monitoring system to emergency response for two high-rise buildings in Shinjuku Ward, Tokyo. The buildings have the sensors of 42 channels, which consist of the servo-type accelerometer where the sampling rate is 100 Hz, the frequency range is between 0.1 and 30 Hz, and the data measurement is between 0.05 and 1000 gal. They improve these systems and emergency response manual and educate people in these buildings on how to use these systems effectively. Su et al. introduced a monitoring system used in Shanghai tower that consists of more than 400 sensors and is designed for both in-construction and in-service real-time monitoring of the skyscraper [11]. Preliminary monitoring data, including vertical settlement, levelness, horizontal displacement, and strain/stress, are presented and discussed. The 1-year monitoring exercise during the construction stage shows the satisfactory performance of the strain sensors and the data acquisition system.
Meanwhile, new sensing technologies such as wireless sensor technology and new sensing technology have come into service to improve the practicability of system. Jang et al. showed a wireless sensor network based on ZigBee technology is used for data acquisition, and then at the computer the software is written in Java to check for the messages transmitted over a radio node's UART port which is designed to receive the wireless sensor data [12]. They use MySQL to save these monitoring data. A web-based system is developed that allows user to mine the database using parameters such as the type of data, the location of sensor, and the time of data acquisition. Niu et al. designed a wireless sensor network based structural health monitoring (SHM) system [13]. Acceleration data, synchronously sampled in each sensor node, are transported to a data processing computer through a base station. In order to achieve a high network throughput, a time division multiple access (TDMA) approach is proposed to reduce the packet collision and energy consumption. The test results present that the approach can reduce the signal collision and increase data throughput. A sensing system which can conduct continuous monitoring of a building structure and generate a monitoring report was developed by Lu et al. [14]. This system employing wireless sensing system has been developed for the purpose of continuous monitoring and experimentally verified on the new 8-floor isolation reinforced concrete building. The emphasis in this paper is on the procedures for error check and pass in this continuous system. The locations of smart sensors can be modified due to the irregularity of the building structure. Zhang and Li designed modular structural health monitoring system for large span spacial structures [15]. Wireless stress and strain measurement facility for steel structure, cable tensile force measurement technology, membrane stress measurement equipment, structural displacement instrument, and wind environment monitoring equipment as well as the final local and remote monitoring software were introduced. All the modules mentioned above are mutually independent of each other and can be chosen and combined in accordance with project demands. Goldoni and Gamba presented W-TREMORS, a new wireless sensing system for high-frequency distributed data acquisition [16]. Their sensor network is based on the low-power and low-data rate standard IEEE 802.15.4. They developed a complete software architecture to integrate the wireless sensor network (WSN) with an existing measurement system. Their prototype WSN was tested through shaking tests in a controlled environment to validate the approach and to identify problems. Preliminary results show that their solution can effectively monitor seismic events providing high reliability and good performance.
Almost all of the above systems pay attention to these aspects, such as aiming at specific application, more accurate data collection, faster data transmission, and more effective network design. With the rapid growth of SBS data, how to standardize, manage, and mine these data become a big problem. The utilization of semantic technology does well in solving the problem of interoperability between IoT devices [17]. Some semantic annotation methods are introduced as the description methods of these devices within the IoT [18]. Based on the semantic correlation of data, the semantic-aware information can be provided for the users as their demands [19]. This paper paves the way for a new approach to make full use of these data and the semantic technology that fuses multisource knowledge to provide customized services.
3. The Monitoring System Architecture under the W2T Framework
The monitoring system architecture for the SBS under the W2T framework is shown in Figure 1. The physical world is the world that surrounds us and should be sensed. The social world is the world where humans act and think. The cyber world is the world in computers, and it is a bridge between the other two worlds. More specifically, in the cyber world the services can be derived from the data collected by the sensors in the physical world and the knowledge created by the humans in the social world. The humans can act and affect the building according to these services, so the social world, the physical world, and the cyber world are connected together through data, service, and action, and the effective data cycle is formed.

The monitoring system under the W2T framework.
3.1. The W2T Framework
The existing monitoring system for the SBS has focused on the collection and conversion of data to provide the engineer with lots of redundancy data. This leads to the result that the engineer must spend so much time in detecting and disposing the invalid data. This is one of the phenomena that effect system efficiency and impede the data exchange among humans, computers, and things. The W2T is a holistic intelligence framework, leading the system designer to think from the view of data sharing and data cycle. A W2T data cycle system is designed to implement such a cycle, namely, “from things to data, information, knowledge, wisdom, services, and humans, and then back to things.” This data cycle not only focuses on some details but also covers the need of different users. So, the W2T is required to provide a right dynamic service for a right dynamic object at a right dynamic time and in a dynamic context to satisfy a dynamic need in the dynamically changing hyper world [2]. Under the W2T framework, it is not enough that the data and the knowledge within this system meet the needs of this application. All the data and the knowledge should be put into the vast Internet and form a resource node providing the professional knowledge and enjoying the knowledge from somewhere else. From the external user perspective, everything on the Web is alive [20] and obtains the embedded intelligence [21].
The monitoring system for the SBS is a multifield fusion project, including engineering mechanics, electronic technique, and software engineering and involving a series of standards of construction, electrical instrument, and testing. All this knowledge cannot be derived from one person. The W2T provides a design idea where we can fuse the knowledge of engineers in different fields and form an effective data cycle among these three worlds dynamically. From service perspective, the design of this system targets on the requirement of different users.
3.2. The Physical World
Within the scope of a building, the monitoring system we developed is mainly composed of three parts: the data server in the monitoring center, the sensors at the measuring points, and the DAIs developed by China Academy of Building Research, which are the keys that make these sensors work harmonically.
Sensor. Different monitoring parameters need the different types of sensors. The selection of sensor should follow these steps: (1) select the right type of sensor for the monitoring parameter; (2) choose the sensor with range, precision, and frequency response in the rated scope estimated in advance; (3) check the size and weight of the sensor whether it is suitable for the installation position; (4) consider the data interface and power supply with the DAIs synthetically. The sensors that are commonly used for monitoring the building structure are shown in Figure 2 ((a) accelerometer, (b) inclinometer, (c) thermohygrometer, and (d) vibrating wire strain sensor). These sensors are selected and installed in some important positions which are decided by the structural characteristics of the building and connected together by the DAIs.
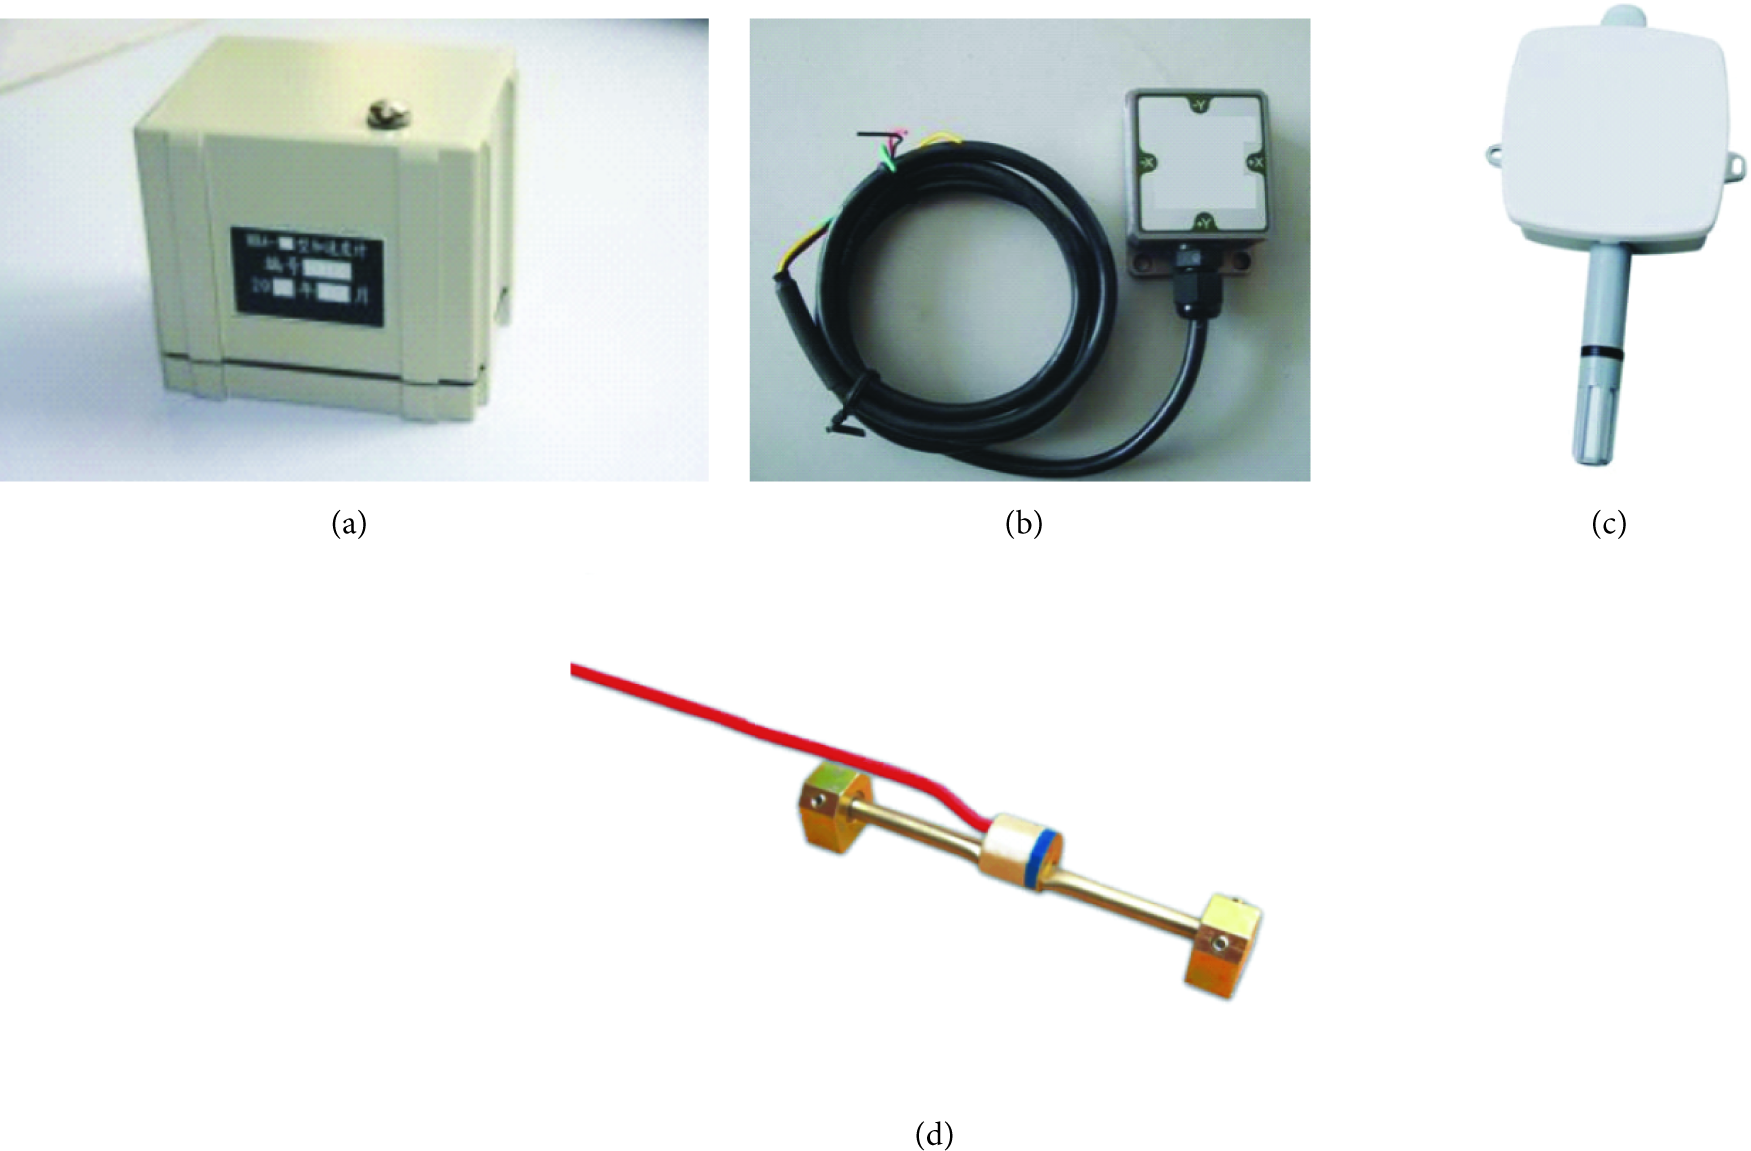
Commonly used sensors.
Data Acquisition Instrument. Data acquisition instrument (DAI) is responsible for receiving commands, performing specific data collection, and detecting exceptional situation. The DAI should match the sensor in the monitoring field; for example, if the sensor has a digital bus such as UART, SPI, or

Wireless data acquisition instrument with four channels.
Data Server. The major functions of data server include online sensor identification, DAI parameter setting, starting/stopping data acquisition, abnormal state check, and data storage, display, and analysis. While the collected data is continuously stored in a data server, the data server provides personalized services to the remote users or the application programs through a certain port and will become an important service node in a wisdom city. The basic process of communication between the data server and the DAIs is shown in Figure 4. There exist two types of commands: broadcast and point-to-point. “Search instruments,” “Start sampling,” and “Stop sampling” are broadcast commands and “Set instruments” belongs to point-to-point command. “Search instruments” is used for detecting the new DAI, and each DAI with hardware connected successfully should respond to this command and report its registration information. “Start sampling” and “Stop sampling” are designed to start all the DAIs in this local monitoring system at a given sampling frequency or stop this process. These data collected from the scattered points have the time synchronization and can be used in the modal analysis of the whole building. In addition, point-to-point start and stop commands are also available. “Set instruments” aims at specific DAI and sets flexible sampling parameters in accordance with its application environment. There are other control commands such as DAI battery check, time synchronization, sleep command, and setting triggering threshold for the engineers to master these DAIs.
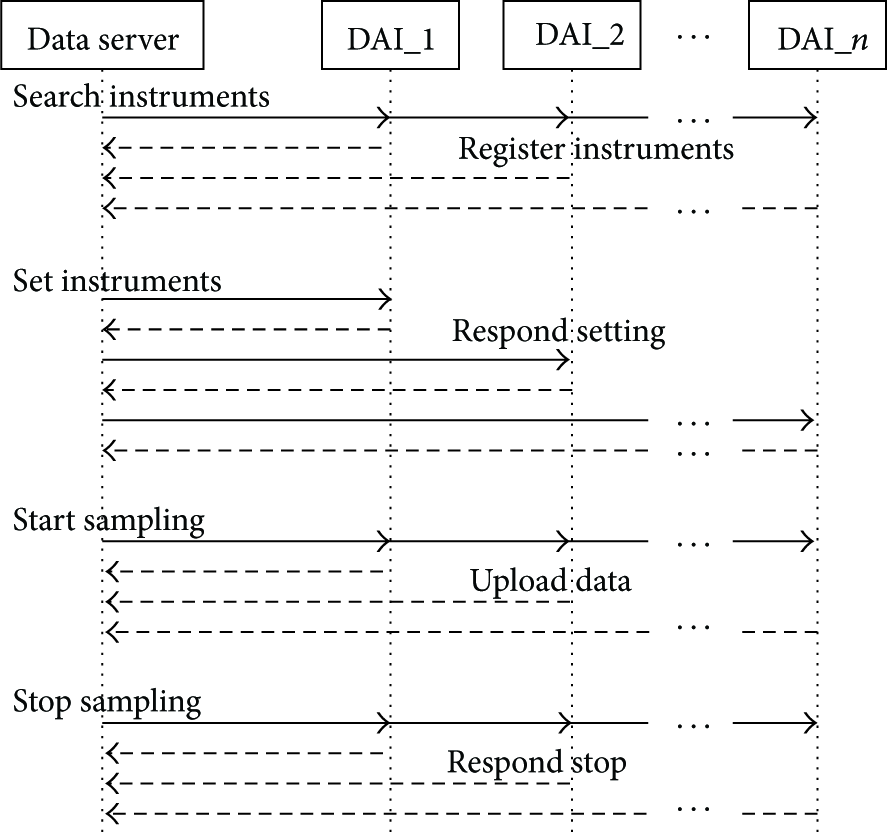
Basic data collecting process.
3.3. The Cyber World
Not only does the cyber world play a role in controlling the data sampling process according to the monitoring plan, but also under the W2T framework it is a key part to form the data cycle, which contains a variety of techniques and knowledge. The stress status of the whole building can be sensed completely by a variety of sensors which are arranged at the different places reasonably and form the raw data. These raw data from the sensors should be put into an application environment, marked with semantic information. By the same marking method, the data with the different expression format [23] from the different sensors or monitoring systems can be shared. The knowledge about the SBS can be organized by fusing this information with the sensor and building domain ontologies [24] and can form the rule-based reason mechanism automatically. Other knowledge such as geospatial ontologies [25] also can be integrated into this system. Supported by the expert system and the professional knowledge, the services such as data query, real-time warning, maintenance plan, and even the prediction of damaged structure remaining life can be provided to the different users who may influence the building. This data cycle aims to discover hidden structural dangers, locate their places, determine the degree of these dangers, and eliminate these hidden dangers. This system plays a positive role in improving the efficiency of building maintenance, making reasonable schedule, and avoiding major disaster.
3.4. The Social World
All the instruments in the physical world and all the data in the cyber world aim to serve the people in the social world. The social world here is the knowledge supplier, the service demander, and the physical world's influencer, not the cyber world's intervenor. The knowledge in the social world is effectively extracted and summarized, represented in the form of ontologies. When the knowledge and the sensed data are combined, the service becomes an interface between the social world and the cyber world. Providing the right service for the right people at a right time and context is an important question, so the personalized service model can be created for the different users [26]. For most structural engineers, they do not care how this system works and what the characteristics of the DAIs are. The things they really want to know are what the data is and when and where the data was collected, and the final goal is to know how the health status is and what kind of action should be taken. The general users maybe only care about some safety tips, and the Government requires providing more macroscopical suggestions.
In a word, this system can collect a large number of data about the SBS in the physical world, fuse with the existing knowledge in the cyber world, and serve people in the social world who will react to the physical world again. So the humans, the computers, and the things will work in a dynamic state. The basis of all these services is the data and their relationships. The data organization is the key effective preprocessing before the data mining.
4. Data, Information, and Knowledge Organization
The background information of the sensed data from a given building can be easily found by retrieving the relational database. However, within the scope of a wisdom city, the different fields or knowledge systems have customized data organization. This makes a remote user unable to get effective context about the sensed data easily. In order to realize the data sharing and interoperating among these systems, a lot of work needs to unify their respective data organization (mainly relational database), and this will cost a lot of time. On the premise of keeping the original data organization unchanged, the semantic technology is a way to solve the above problems [27]. In the cyber world the data from sensors should be organized, marked with the semantic background information, and fused with the related knowledge. So the process can be divided into the raw data, the semantic information, and the multisource knowledge three layers.
4.1. The Raw Data
Before monitoring a building, its mechanical structure should be analyzed according to its design drawings, and then the measuring points can be selected reasonably. All of these steps are needed in order to reflect the actual characteristics of the building structure by using the limited sensor resources. The diagram about model decomposition and data organization is shown in Figure 5.
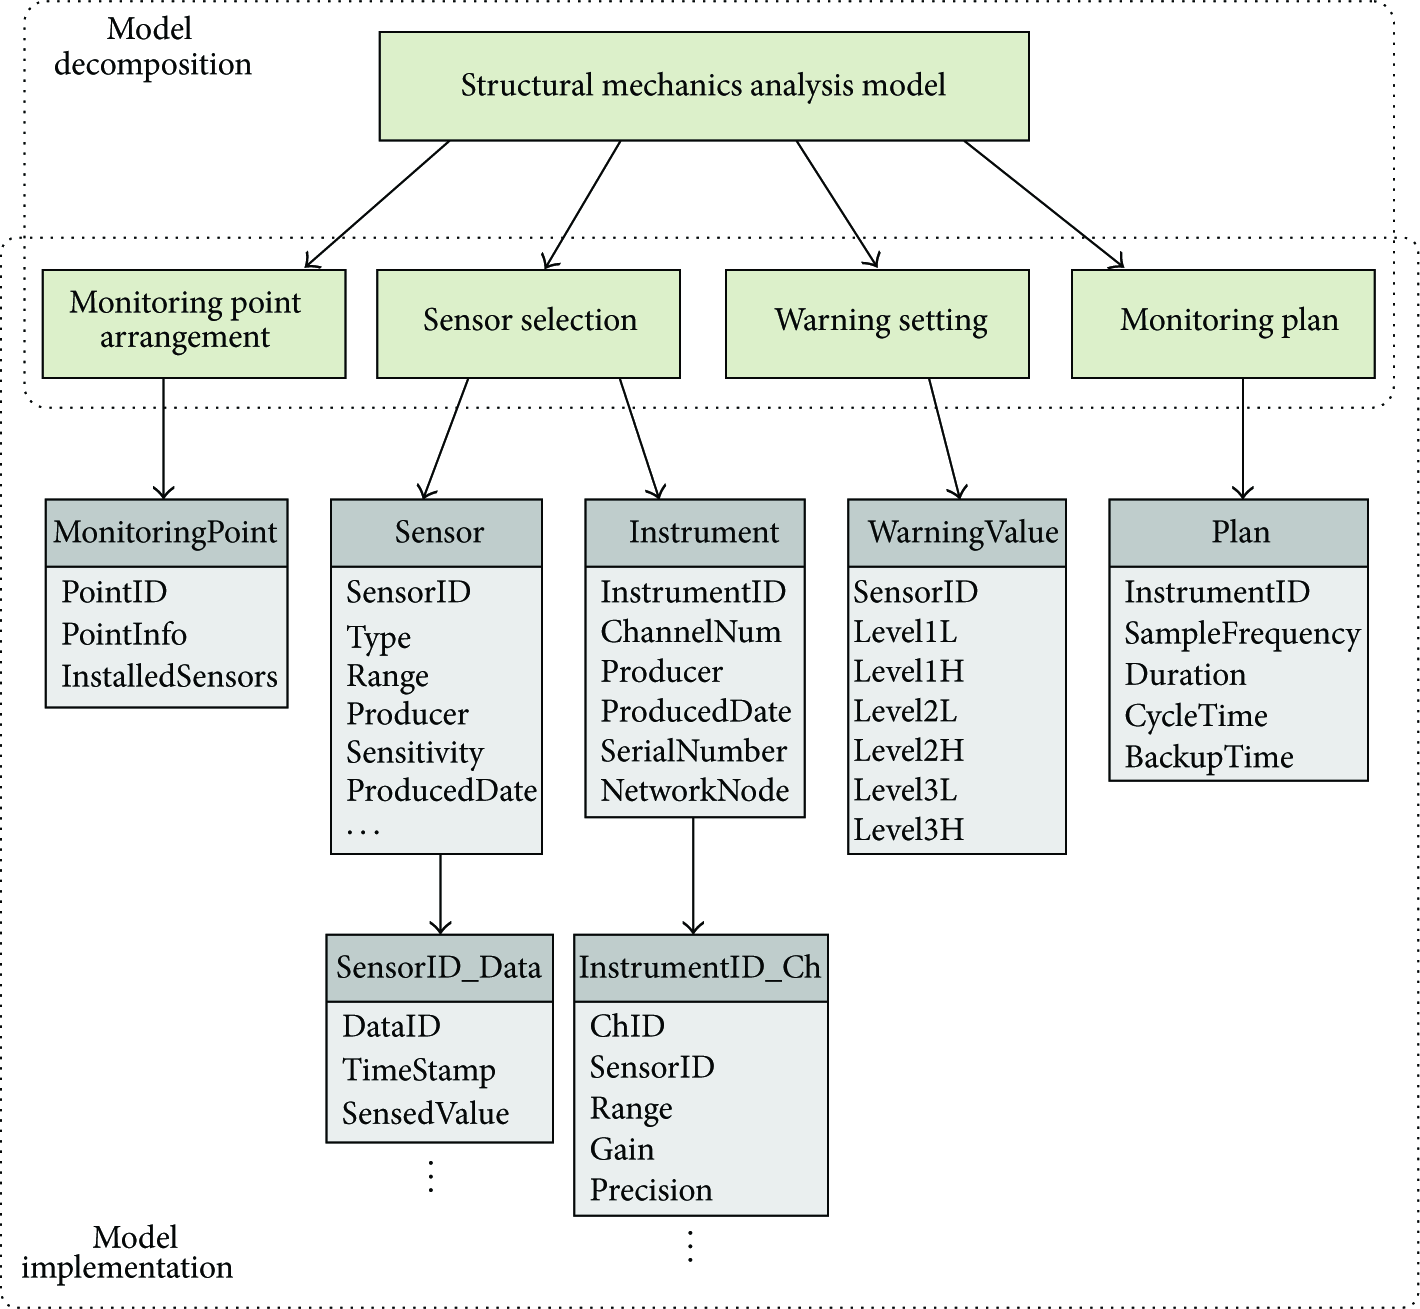
Model decomposition and data organization.
According to the different functions, four function modules are formed: the measuring point arrangement, the sensor selection, the warning setting, and the monitoring plan.
The measuring point arrangement: the measuring points which bear loads are found and what type of the physical parameter should be monitored can be decided. The sensor selection: according to the physical parameters monitored, we could select the appropriate sensors and use the cooperative DAIs. The warning setting: some absolute ratings such as bearing capacity and fundamental frequency can be calculated, and the threshold of each measuring point will be set accordingly. The monitoring plan: how often will a data collection loop start and how much is the sampling frequency of each sensor can be decided.
These four function modules involve a wide variety of data and the relations which can be denoted by relation schema like RelationName (
When a DAI obtains the sensed data and transmits these data to the data server, these relations above are needed to determine what the real meaning of this data is. Figure 6 shows the workflow of getting the sensed data meaning.

Workflow of getting the sensed data meaning.
When a socket is connected, a dataflow which contains the A/D conversion voltage value (inputValue), the DAI ID (devID), and the DAI channel (chID) can be got through parsing data transmission protocol. The following steps should be carried out to get the meaning of this data.
Step 1.
Extract the voltage value (inputValue).
Step 2.
Extract the instrument ID (insID) and the channel ID (chID).
Step 3.
Get the channel information such as the channel gain (chGain) and the connected sensor (senID) from the relation insID_Ch.
Step 4.
Calculate the real voltage,
Step 5.
Get the sensor information such as the sensor type and its sensitivity (sen) through the relation Sensor.
Step 6.
Obtain the monitoring point information about the place where the sensor is installed through senID and the relation MonitoringPoint.
Step 7.
Calculate the physical value
Step 8.
Save the value
As a result, through a series of the steps above, the engineer knows the meaning of the coming data finally.
4.2. The Semantic Information
The relations in different systems are organized in different ways, so the specification of query process could not be unified. With the emergence of Semantic Web, the semantic technology provides effective technical way for the management of a large number of sensors, the representation and sharing of the big data. We use the semantic technology to deal with the data and form the semantic data models. The unified expression is formed by adding semantic information layer between the existing relational database and the knowledge.
The information of monitoring system has been saved in the relational database with multitables. Each record has a set of values Each table corresponds to a NTriple file with the same name. Each record can form a RDF node. According to the table type, the property type of RDF node should be added. A unique identification used as the subject should be formed by the primary key of each record. The attribute of each column is the predicate in RDF triple. The value of each column is the object in RDF triple. If the value of column is a primary key in this or another table, the object in this triple should use the same expression with the subject formed by the primary key in another triple. Make sure of the uniqueness and the habituation of every node name. If necessary, other properties should be increased to form clear semantic information.
Every record can form a NTriple set just like
<http://www.w2t-waas.com/WHY#20131216S2sensedData5455> <http://www.w3.org/1999/02/22-rdf-syntax-ns#type> <http://www.w2t-waas.com/SSW#SensedDataRecord>. <http://www.w2t-waas.com/WHY#20131216S2sensedData5455> <http://www.w2t-waas.com/SSW#fromSensor>< http://www.w2t-waas.com/WHY#2013B1sensor2>. <http://www.w2t-waas.com/WHY#20131216S2sensedData5455> <http://www.w2t-waas.com/SSW#sensedValue> “-2.4”∧∧<http://www.w3.org/2001/XMLSchema#double>. <Http://www.w2t-waas.com/WHY#20131216S2sensedData5455> <http://www.w2t-waas.com/SSW#timeStamp> “2013-12-16T07:54:24.406”∧∧<http://www.w3.org/2001/XMLSchema#dateTime>.
The measuring point information is important in the monitoring system. An engineer can get the information of every point from the measuring point table, and then the unified concept of spatial layout will be formed in his mind. For the computer, the complete semantic context is needed to establish the relationship among the space points. Simply converting this table into the NTriple file is not enough; some other information is necessary. So the requirements of the semantic model about the measuring points are the following:
Users can clearly know the spatial relationship among the points. Starting from any measuring point, all the other measuring points can be found. Adding a property used to represent the anomalies of this point and the building. Through the semantic model, the building can be located accurately in a city.
Generally speaking, the building has symmetry and hierarchy, so the RDF model of a measuring point can be designed as shown in Figure 7. The NS, which is just a symbol and may be different in different applications, stands for the namespace which ensures that the same word has the same meaning in different systems. In this case, we assume that a measuring point spatially associates with six other points around. If there is no measuring point in one direction, string NULL can be used for this. The measuring point adds the property hasAbnormal which is used for indicating the health status of this measuring point and may be inherited by some subproperties (e.g., hasDataAbnormal and hasSensorAbnormal). The property atBuilding connects the measuring point with the building. So the scattered measuring points form a network through semantic properties. For more detailed information, the information in the CAD graphic documents also can be converted into the semantic properties.

The RDF graph about a measuring point.
The static and dynamic data about the application case are changed into the semantic information. In this conversion process, some knowledge represented by ontologies is also used and each piece of the semantic information is an individual of ontology class, an embodiment of conceptual knowledge.
4.3. The Multisource Knowledge
As shown in Figure 8, the multisource knowledge gained through study or investigation combines facts, truths, or principles together, which can form case-based or rule-based knowledge. There is no perfect way to model this knowledge; ontology is one of the feasible methods, which is a formal explicit description of the concept in a domain and can standardize the representation of this knowledge. The ontologies used here are divided into two categories: the commonsense ontology and the domain ontology. The commonsense ontologies quoted here are these ontologies which contain the commonsense concepts of daily life [31] and have been created and maintained by other engineers. The domain ontologies are the standard expression of the domain knowledge and the related concept including semantic sensor network ontology [32], building standards, and design models, which are professional and should be maintained by the engineers in this project. Each relation in the database can be mapped to an ontology class.
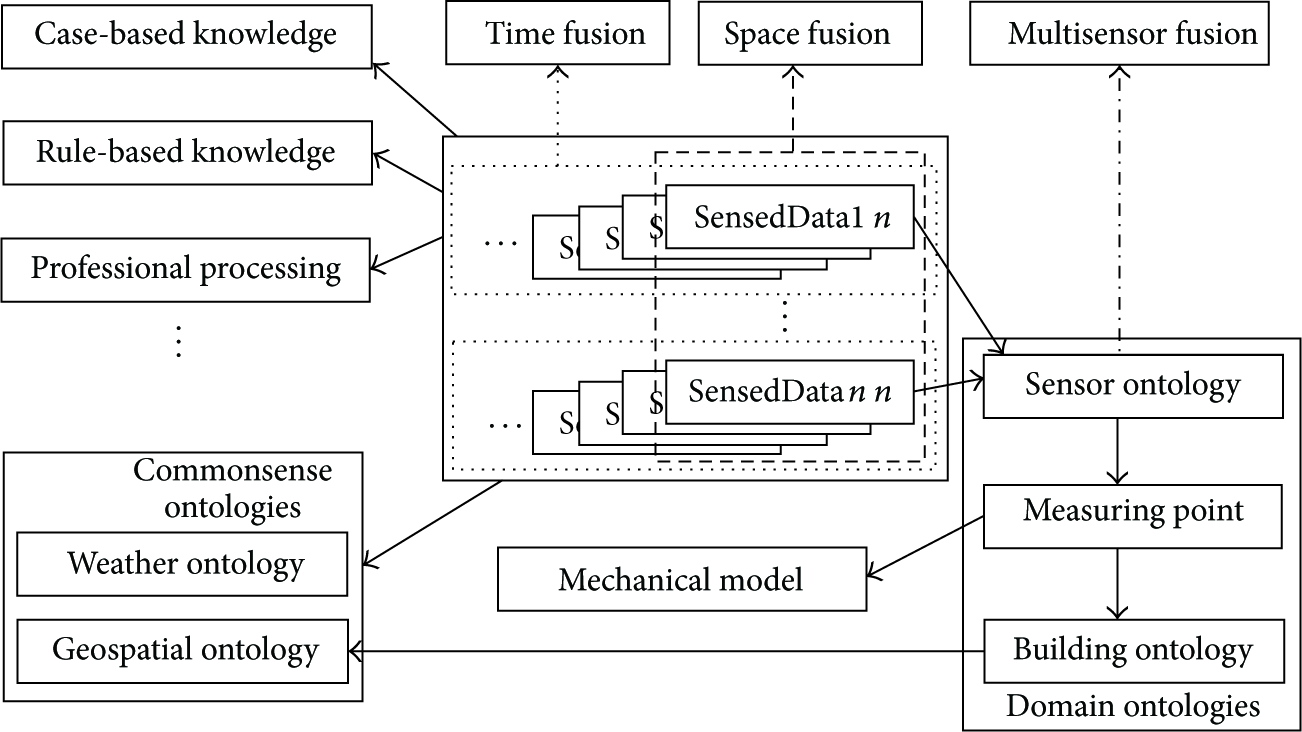
The multisource knowledge organization.
When the sensed data is delivered into this system and the semantic information is created correspondingly by semantic annotation, the sensed data is connected with the existed knowledge resources. The sensed data is directly related to an individual of the sensor ontology, which contains the measuring point's link. With the measuring point, the building ontology can be integrated with the real-time sensed data. Through the sampling time of the sensed data and the geographic information of the building, the commonsense ontologies such as weather ontology and geographic ontology can be used. So the real-time sensed data drops into a knowledge net; a series of results can be reasoned or concluded based on this knowledge.
Generally speaking, one group of sensed data cannot illustrate the fault or the error situation adequately which needs large numbers of data to make a comprehensive analysis and judgment. To achieve this goal, three fusion methods can be proposed from three different viewpoints: time, space, and multisensor [33].
Time Fusion. The time fusion means the analysis of the changing data about a sensor during a period of time, so the rationality of the current data can be concluded by the historical data. The least square method is often used in time-based analysis to form the fitting equation [34], which aims to determine the deviation of each sampling data and predict the trend of the structure deformation. Given a time-based series set of sampling data

The parameters a and b can be calculated by


Those sampling data which have the biggest distance with the fitting curve can be found and should be focused on particularly. From the trend of the fitting curve about a monitoring point, we can analyze the reasons behind the data, find the hidden nature, predict the next value, and so on. All kinds of analysis methods based on time such as Fourier Transform and Wavelet Analysis also can be used in this fusion processing.
Space Fusion. The space fusion means that the data about the space adjacent points can be analyzed and the spatial measuring points can form an interconnected net which reflects the SBS from the perspective of the whole building. The whole building risk factor (brf) is related to the risk factor of each monitoring point (prf):

Multisensor Fusion. The multisensor means that the changes of objective physical characteristic could be reflected more accurately through many different types of sensors. For example, the strain of building structure can be measured by the strain sensor. The strain value (y) sensed is influenced not only by the structural change (

The rules base based on the expert's experience is established to integrate the mining methods into the practical application. When a set of new data is sampled, the different processing methods match the different data according to the rules and the data type which can be retrieved by SPARQL based on semantic data model.
Rule 1.
IF(newdata.fromSensor.type==Strain)
THEN Calculate the deviation with the fitted curve
ELSE IF(newdata.fromSensor.type==Vibration)
THEN Compute architecture modal parameters
ELSE IF(newdata.fromSensor.type==Temperature)
THEN Revise the strain data with this temperature value
ENDIF
After professional processing, the characteristics of data should be annotated timely and can be retrieved directly when user submits some queries. Establishing independent rules base and separating rules from the general operations make the maintenance of system more convenient. The engineer could adjust the rules at any time according to the application without affecting other parts of the system. The meaning of data determines the next step of data processing method, so the semantic annotation of data becomes bridge among knowledge, rules, and data. Except for the fusion of time, space, and multisensor, a series of intelligent processing models including the detection of noisy data, the automatic correction of data, and the real-time warning can be connected together by semantic technology.
Not only is the engineer's work burden alleviated, but also new knowledge (such as case-based knowledge) even can be extracted from the fusion of different knowledge and the ontologies can be improved or modified according to the results. In addition, by adopting the unified namespace or the mapping rules among different systems, the data fusion among buildings in a city can be realized.
5. Prototype System Testing
The internal structure diagram of this testing system powered by the LarKC platform is shown in Figure 9. LarKC (Large Knowledge Collider) is a semantic platform for scalable semantic data processing and reasoning (https://gate.ac.uk/projects/larkc/). LarKC was developed by the European Union's Seventh Framework Program, aiming to remove the scalability barriers of the currently existing reasoning systems for the Semantic Web. The main features of the LarKC platform are as follows.
Configurability: LarKC provides a flexible and modular environment where users and developers are able to build their own workflows and plug-ins, respectively, in an easy and straightforward manner. This platform has a pluggable architecture in which it is possible to exploit techniques and heuristics from diverse areas such as databases, machine learning, cognitive science, Semantic Web, and others [35]. Scalability: in LarKC, massive, distributed, and necessarily incomplete reasoning is performed over web-scale knowledge sources. Massive inference is achieved by distributing problems across heterogeneous computing resources and coordinated by the LarKC platform [35]. Parallelism: LarKC supports parallel reasoning and processing by using cloud computing and cluster computing techniques and is engineered to be ultimately scalable to very large distributed computational resources [36].

The internal structure diagram of the prototype system.
The various types of data used by the different systems can be integrated by the unified semantic representation which can provide semantic interoperability among them [37].
The monitoring data server in a building is established for the SBS and becomes one of the distributed servers on Internet in a smart city. The personalized services can be provided through a specific port. The remote user or the user platform can log in the server and submit queries, and the system will return the results to user webpage or application program. Through the data and the information returned, the user can understand the meaning of data and combine with their own application model. The data source consists of the raw sensed data, the semantic RDF information, and the knowledge represented by ontologies. These files are loaded into the LarKC platform which can provide different data services by designing different workflow plug-ins.
The involved ontology classes and individuals are organized as shown in Figure 10. The class SensedData has the property fromSensor from which we can get the source of those data, then the property hasSensor of the class MeasuringPoint establishes the relationship between the sensor and the measuring point, and then the property atBuilding of the class MeasuringPoint specifies the building monitored. The commonsense knowledge used here is represented by three classes Time, Weather, and Spatial. Through the property timeStamp of the class SensedData and the property inCity of the class MonitoredBuilding, the domain knowledge and the commonsense knowledge are connected together, and some new or neglected knowledge could be found out by knowledge fusion technique.

Ontology organization in the prototype system.
5.1. Sample Performance
The DAI shown in Figure 3 can connect with four strain sensors, taking it as representative. The average sampling response time from sending start command to receiving the first sensed data is about 200 ms which includes the data stability time, the A/D conversion time of four channels, and the signal transmission time. For high-speed data acquisition, 16-Mbit on-broad ram is provided for buffering the data before the transmission in every sampling loop. The sampling precision is one of the key parameters of DAI, and we carried out this test performed by the National Institute of Metrology in China. The result is shown in Figure 11. The minimum resolution is 1


Accuracy testing of strain data sampling.
The calibration rule for this DAI can be made according to formula (6). So the data can truly reflect the physical property. The visual transmission distance is 500 meters with the 4.15 dBi antenna, and it can meet the basic measuring need of a wide range of applications. If necessary, the wireless range can be extended by adding additional repeater units.
5.2. Time Comparison about Data Query
The time comparison about data query between the LarKC-based semantic system and the traditional SQlite-based database system was carried out. The testing platform is composed of Intel i5-2430M dual core processor, 2.95 G physical memory, and Windows 7 operating system. The SQlite-based database system is the traditional database system, designed by Qt Creator which is a cross platform application and UI framework, and provides service for data collection and display. Because it is a specialized design, so it is difficult to realize the data sharing. The time experiment is designed to test the time consumption for querying the same data between these two systems. The steps are as follows:
Prepare two copies of the same data. One is saved in SQlite database and the other is transformed to the semantic NT data. Start the system and load into the respective data. Design the SQL and the SPARQL statements for querying the same data. Run the query in these two systems and get the elapsed time. Repeat Step (4) 10 times. Close software and clean the computer memory.
The test was repeated in different datasets from 10000 to 120000 points. The query time in the LarKC-based semantic system is shown in Figure 12. The first query needs more time as the LarKC does some internal processing and saves the intermediate results in memory. In the process of subsequent queries, the average time consumption is about 15 ms, and it does not change with the expansion of data size observably. The average time consumption is compared in Figure 13. The time used in the SQlite-based database system will increase with the expansion of data size. Aiming at monitoring for the SBS it produces large amounts of data from sensors every day, and the engineer is only interested in those data that exceed the thresholds. The thresholds will not change once the system has been set, so the query is always fixed. Therefore, the LarKC is more suitable for those systems which have the fixed query schema.

Query response time about LarKC-based system under different data sizes.
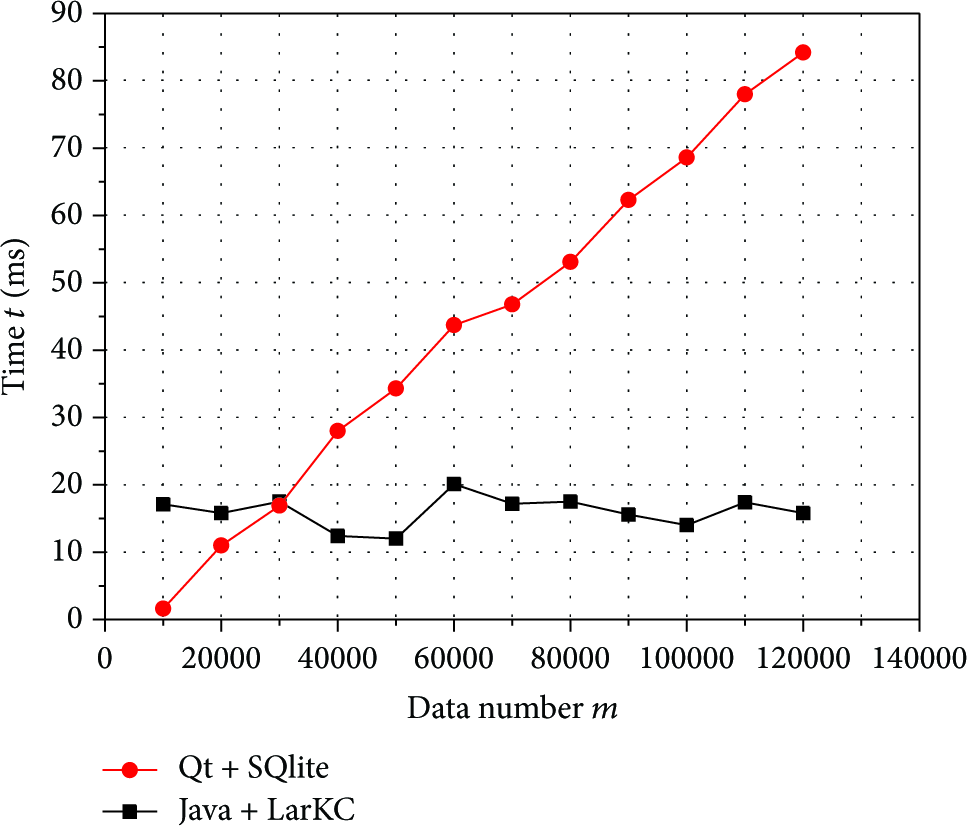
Comparison of query response time.
5.3. Knowledge-Based Detection on Noisy Data
Another advantage of semantic data is the ability to realize the interoperability of data and knowledge on the Web. The inherent correlation of data on the Web can assist us in the reasonable justification of the new sensed data. A sensed temperature data from a bridge monitored in Beijing, China, is
In this case we use geographic ontology and weather ontology to detect the abnormal data like the engineer does. When a sensed data (expressed by the variable tempValue) comes into this system, we can get this information of when this data was sampled and which sensor did this. Further, the installation site information (e.g., building name, longitude, latitude, and city) can get retrieved from the semantic properties of this sensor. By using the sampling time and the location information of the monitored building, the weather information can be obtained through the link between the weather ontology and the geographic ontology. The highest temperature (expressed by the variable highTem) and the lowest temperature (expressed by the variable lowTem) of Beijing on December 16, 2013, can be returned back by using the following SPARQL queries:
SELECT DISTINCT ?day ?highTem ?lowTem WHERE{ ?weaUri rdf:type wea:weather. ?weaUri wea:City ?city. ?weaUri wea:Date ?day. ?weaUri wea:HighTemperature ?highTem. ?weaUri wea:LowTemperature ?lowTem. FILTER(?day=“2013-12-16” && ?city=“Beijing”). }
In this case the relationship between the weather temperature and the temperature of the measuring point is established by the people's experience. The logic rule for detecting this abnormal phenomenon is shown as follows.
Rule 2.
fromSensor(?tempValue,?sensor) and hasSensor(?spot, ?sensor) and
(largeThanOrEqual(?tempValue,?highTem+10) or
lessThanOrEqual(?tempValue,?lowTem-10))⇒ hasSensorAbormal(?spot)
The user application integrates the sensed data, the weather information, and the related knowledge to judge the rationality of the real-time sensed data, so the engineer can receive an abnormal event as a kind of customized services; another user such as the general user and the Government may not get this massage.
5.4. Rule-Based Data Reasoning
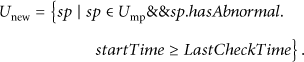
Based on the rules base, some data reasoning can be made and a satisfying answer can be provided to meet the complex query. In practical application, the engineer often asks questions directly related to their purposes. For example, before doing the regular check, they may want to know what are the abnormal points that have happened since the last check? Before answering this question, each monitoring point has been marked for abnormal (risk factor is 3, 4, or 5) or normal (risk factor is 1 or 2) in advance in the light of the sensed data. The abnormality of monitoring point (expressed by the variable
Rule 3.
fromSensor(?data,?sensor) and hasSensor(?spot,?sensor) and
((warnning1HighLevel(?sensor, ?high) and
largeThanOrEqual(?data, ?high)) or
(warnning1LowLevel (?sensor, ?low) and
lessThanOrEqual(?data,?low))) ⇒hasDataAbormal(?spot)
We define Rule 4 as a way to detect the abnormal data caused by sensor; the point set formed by this rule is represented as
Rule 4.
fromSensor(?data,?sensor) and hasSensor(?spot,?sensor) and
((sensorMaxRange(?sensor, ?max) and
largeThanOrEqual(?data,?max)) or
(sensorMinRange(?sensor, ?min) and
lessThanOrEqual(?data,?min))) ⇒hasSensorAbormal(?spot)
The abnormal sensor can be detected by different rules, and Rule 2 is also one of them. The abnormal monitoring point usually could be obtained by the point set with abnormal data minus the point set with abnormal sensor
These rules are built and stored in the rules base. Once data is sampled, the system calls the corresponding rule automatically, determines the current state timely, and marks the data with semantic information adequately. All kinds of data are in a standby state. After user submits the query statements, the system organizes data in the fastest way and avoids the time consumption caused by the call of some algorithms.
The time “after the last check” divides the abnormal point set into two parts. So the new abnormal point set (
Therefore, on the premise of data organization, it only needs to search two properties of RDF without the additional calculations in the process of query.
Users can design the more complex SPARQL query statements to meet their needs or the intelligent models. According to these data, the engineers can know the current state of the building, check the potential danger, and make the building maintenance schedule.
In a wisdom city, when different monitoring systems in the buildings use the same namespace or establish the mapping between different namespaces [38], the data sharing and interoperability become possible, and then the organization of big data for the SBS can be basically completed. Until that time, all kinds of wisdom services under the W2T framework can be provided based on these big data.
6. Security Considerations
Within the coverage area of the WSN, it is possible that other electronic devices access the wireless network. Meanwhile, the opened service port on the Web can be accessed maliciously and even be attacked [39]. Malicious access can cause data disorder, produce incorrect results, or estimate the SBS unpredictably.
For the WSN and open Web, a single security solution for a single layer might not be an efficient solution, and employing a holistic approach could be the best option [40]. So it is necessary to build a security mechanism, and three-level security mechanism is considered at different levels. (1) Wireless access: without the designated username and password, anonymous DAI cannot access the wireless network. Meanwhile, a special communication frame format used for communications between the DAI and the data server is designed. Only the format of data meets the communication format, and then this data frame is valid. (2) Service interface: the remote user must register to get the service. Different services with access permission can be provided to different users according the registration information, and professional model can also be built targeting specific user. (3) Knowledge authentication: referencing the knowledge on the Web the knowledge authentication and the approval mechanism are needed, and wrong knowledge reasoning or wrong service information can be avoided.
7. Conclusion and Future Work
Today, more and more buildings begin to monitor the SBS, and the importance of data will gradually appear. The acquisition and transmission of the sensed data will no longer be problems in the general monitoring case. Instead, the problems will concentrate on these aspects, such as how to manage this coming data stream and how to use these data effectively.
This paper designs an intelligent monitoring system for the SBS under the W2T framework, which organizes the data, the information, and the knowledge by using the semantic and the data fusion technologies. A series of operable tables are got from the model of building structure, and some mapping rules are proposed for converting these tables into semantic information. The real-time sensed data, the semantic information, and the related knowledge are connected together to evaluate the reasonability of the data automatically. At last, the prototype system was tested from sampling performance and knowledge fusion application.
In the future, semantic model about building structure will be optimized, and the ontologies of building structure and sensor will be improved. More methods about data analysis and data fusion can be used in these sensed data, so the system is intended to grow more intelligent. Some researches have been done about the OGC's Sensor Web Enablement (SWE) standards [41] which can make it easy to integrate this information into thousands of geospatial applications that implement the OGC's other standards [42]. The standardized models of the OGC also can be considered to join into this system, and thus more sensor models and sensed data can be reused.
Footnotes
Disclosure
This paper is original and has been written by the stated authors who are all aware of its content and approve its submission.
Conflict of Interests
The authors declare that there is no conflict of interests regarding the publication of this paper.
Acknowledgments
The work is supported by National Natural Science Foundation of China (61420106005, 61272345), National Basic Research Program of China (2014CB744600), International Science & Technology Cooperation Program of China (2013DFA32180), Beijing Municipal Commission of Education, and Beijing Key Laboratory of Magnetic Resonance Imaging and Brain Informatics.