
Abstract
Associated with a project, the application of real-time monitoring and early warning system in the retrofitting process of structures was investigated. Based on the software ANSYS, structural analysis and thermal analysis were carried out to determine the distribution of sensors and the early warning threshold value in monitoring process. SHM system was developed for damage sensing in real-time using FBG sensors. Eight FBG sensor clusters consisting of a strain sensor and a temperature sensor were welded on the steel beam surface. Using these FBG sensors, the real-time strains in key positions during the cutting process of steel beam were measured. The monitoring data provided the early warnings and effective reference for analyzing the stability of steel beam in real-time.
1. Introduction
Due to uninterrupted production, high load production, and poor working conditions, most of buildings came out different levels of performance degradation, especially for the industrial facilities built in 1950s in China. On the other hand, with the development of modernized industrial technology, the requisition on variety, specification, quality, and yield with strip steel increases gradually. Metallurgical and mine enterprises of China made some improvements on old process and production equipment. Such industrial buildings generally are unable to be fit for the production and technique demands. The factors measured above lead scores of industrial buildings to be retrofitted or reconstructed. The performance degradation of these deficient buildings causes increasing concern about the structural safety. Seeking for one kind of high accuracy detection mean of the on-the-spot structure monitoring has become the premise of industrial building reformation.
Structural health monitoring (SHM) is based on acquisition of displacement, strain, and acceleration measurements. Monitoring data reflect the structural behaviour of buildings. The essence of SHM has been clearly reflected by Housner et al. [1], where it is defined as the continuous or regular measurement and analysis of key structural and environmental parameters under operating conditions, for the purpose of warning of abnormal states or accidents at an early stage [2, 3]. Though it is not a simple task to be widely used in practical engineering, many projects had been undertaken to implement partially SHM systems from research laboratories to field applications. SHM has been carried out in bridges to monitor wind load, traffic load, and so forth [4, 5]. Other significant efforts in implementing health monitoring systems include mechanical structures [6], aerospace structures [7, 8], railway structures [9–11], geotechnical engineering [12], and architecture [13, 14]. The ability to provide real-time structural health date of structures subjected to environmental loading is important diagnostic information for preventive maintenance in structural engineering [15].
There are many types of optical sensors used in the above health monitoring applications. In recent years, Fiber Bragg Granting (FBG) strain sensors have been extensively used in SHM, mainly because the sensors have many characteristics as small size, high accuracy, and stabilization. Many experts and domestic institutions invested heavily in the application of FBG sensors in civil engineering structure monitoring [16]. Rodrigues et al. described and appraised the practical installation of a monitoring system based on FBG sensors used for the permanent surveillance of the Lezíria Bridge [17]. Chong et al. developed a FBG sensor for integrated structural health monitoring of high temperature nuclear power plant [18]. Pei et al. have summarized the research and development activities in geotechnical health monitoring using optical fiber sensors [12].
Based on friction principle, Ren signed a clamp-on FBG strain sensor with two grippers [19, 20]. In this paper, we present our results on the practical use of this type FBG sensors in a retrofitting process of industrial plant. The main objective of the real-time SHM is to guarantee the safety of steel beam in the cutting process using oxyacetylene torch. A reliable and practical FE model of platform is established for the stress distribution analysis and the optimal design of FBG sensors placement. Adopting a detailing 3D-FE steel beam model to simulate the cutting process using oxyacetylene flame, temperature field was analyzed and the high temperatures of steel beam during the retrofit process were obtained to determine the yield strength of steel beam. Based on stress results, temperature results, and current code, the limit values of strain variation are set as threshold values in the real-time monitoring system to monitor the safety of steel beam. According to the field monitored data of steel beam and the numerical results, the stability and safety of steel beam are analyzed all the time during the retrofitting process.
2. Numerical Analysis
2.1. Beam Retrofit Scheme
Because of the demand for the process and technologies of ferrochromium smelting, the sections of two steel girders in main shop of one ferrochromium plant must be retrofitted. Two I section steel beams were used as the main structural supports of equipment platform in the plant building. Dimensions of the steel beam were 2,245 mm height, 13,000 mm length, and 1,000 mm width. A concrete upper plate was laid on the top of the girder with the thickness of 300 mm. A blast furnace with about 3,000 kN weight was laid on the platform and the burden weight in the blast furnace changes from 0 to 2,000 kN.
In order to be fit for the new equipment of smelting ferrochromium, part of the steel beam should be removed at beam bottom. The removed part (Part A shown in Figure 1) is 450 mm high and 3,325 mm long, including the bottom flange. To ensure the stiffness of girder, a T-type steel beam and a transverse rib were welded on the I section steel beam before removing Part A. The T-type beam (Part B shown in Figure 1) with 450 mm height and 5,250 mm length was welded on the top of the girder. The transverse rib with 1,034 mm width and 6,472 mm length was welded on the cutting edge at the bottom of the girder. As the equipment of smelting ferrochromium has been installed on work platform, real-time monitoring and early warning must be made to ensure the safety of steel beam in the cutting process.
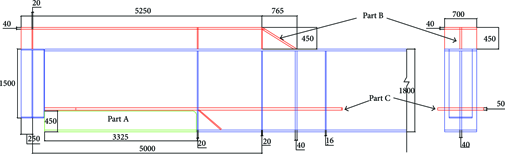
Retrofit scheme of the platform steel beams in geometry.
2.2. Structural Analysis
Finite element analysis was used to determine the optimal sensor numbers and the best monitoring points. In order to eliminate the influence of fixed boundary, the whole floor of work platform and the columns of two layers were set up in ANSYS software. The model was discretized into 29,829 elements and 32,856 nodes using four-node isoparametric shell63 element illustrated in Figure 2. The maximum length of elements is 300 mm. It was assumed that the model was a continuum, homogeneous, isotropic elastic matter. The material properties of steel beam used in finite element analyses are shown in Table 1.
Material (Q245R) properties used in finite element analyses.

Finite element model of work platform used for structural analysis.
The main loads subjected by the platform are equipment self-weight and burden self-weight. The blast furnace was settled on the platform by six equipment supports. The concentrated force applied on each equipment support was 500 kN. There are nine supports for the feed tubes and the force applied on each support is 140 kN. And fifteen supports were settled for furnace lids; each support shares 36 kN concentrated force. The weight of two transformers on the platform is 1,200 kN. Otherwise, the uniform dead load applied on the platform is 5 kN/m2, and the uniform live load is 10 kN/m2. The bottom and top of each column were fixed. The floor covered on steel formwork was made of concrete with 300 mm height and its weight was considered.
Birth and death method was used to simulate the retrofitting process of steel beams. At first, the elements of adding parts (Part B and Part C shown in Figure 1) were killed. The deformation and stress distribution of the girders were analyzed before they were retrofitted. Then, the elements of adding parts were alive to calculate the stress states of the girders welded on the adding parts. At last, the elements of Part A (shown in Figure 1) were killed to analyze the stress states of retrofitted girders.
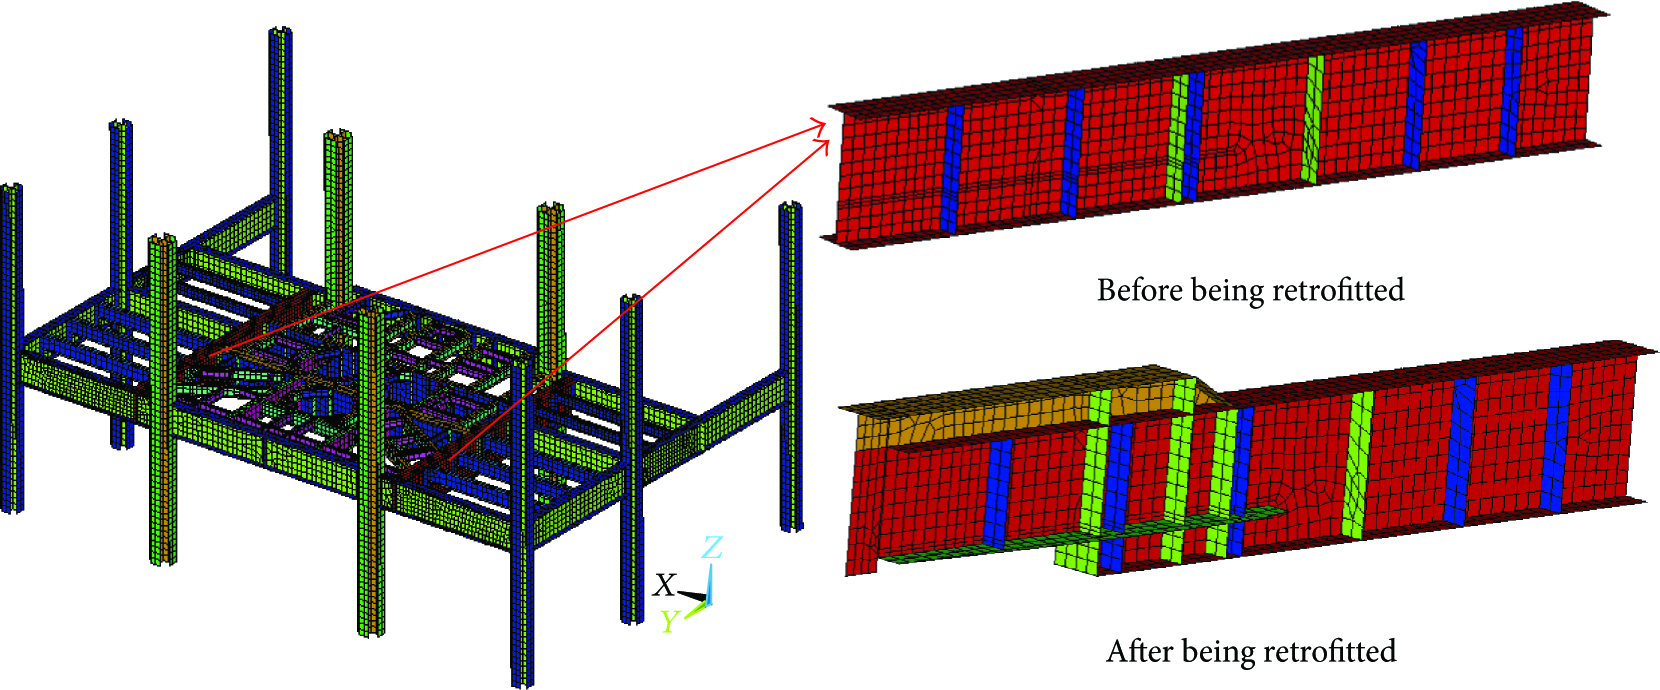
Figure 3 shows the stress distribution of steel beam before and after being retrofitted. The deformations of the girder at middle point are 13 mm before being retrofitted and 13.9 mm after being retrofitted. The deflection only increased 0.9 mm, which indicated that the strength of the platform was not weakened obviously. The maximum major principal stress at the middle point of the girder is 142 MPa as shown in Figure 3(a). After being retrofitted the major principal stress is 132 MPa at the same point, declining approximately 7 percent. But the maximum principal stress is 147 MPa, occurring at the corner of cutting part position as shown in Figure 3(b). The results show that the middle point of the girder is the dangerous potential point and should be monitored in retrofitting process. And yet the numerical analysis results also show that the modification of girders does have slight effect on structural reliability. The maximum principal stress of the girder is far below material yielding stress. Consequently proper safe margin can be ensured in retrofitting process.

(a) Stress distribution of the girder before being retrofitted. (b) Stress distribution of the girder after being retrofitted.
2.3. Transient Thermal Analysis
Oxyacetylene flame was utilized to cut the steel beams in the retrofitting process. Since the steel strength and stiffness would be reduced at elevated temperatures, high temperature of oxyacetylene flame adversely affects steel strength. The transient thermal analysis of the girder during the cutting process was carried out using ANSYS software to determine the threshold strength value at different parts of the steel beam. 3D elements (type = solid 70) were adopted to model the girder. The girder was discretized into 180,162 elements and 266,024 nodes illustrated in Figure 4. The maximum length of elements is 20 mm and the cutting was moving at 100 mm/min, so the step time is 12 s.

(a) Finite element model of steel beam used for thermal analysis. (b) Key points’ location on section A.
The initial temperature of steel beam is 10°C. Coefficient of heat transfer by convection is 110 W/(m2·°C). Oxygen acetylene has high flame temperature (3,200°C) but the temperature at the cutting edge is just about 1,500°C. So the maximum temperature applied at the cutting zone is 1,500°C. The heat generated by oxygen acetylene was considered as a moving heat source for any points in the girder.
The finite element analysis provided the temperature distribution of the girder assuming transient state heat transfer in steel beam during the cutting process. Initially the girder remains at a lower temperature. The temperature of the girder near the oxyacetylene flame increases significantly when the torch arrives, as shown in Figure 5(a). The high temperature zone concentrates in the cutting point and the maximum temperature is 1,500°C. The temperature in the steel beam decreases considerably with the distance increasing from the cutting point. Figure 5(b) shows the temperature changes of some key points during cutting process. These peak temperatures correspond to the points located at 0 cm (Point A), 2 cm (Point B), 7 cm (Point C), and 9 cm (Point D) far from cutting edge which are 1,500°C, 351.8°C, 101°C, and 72.6°C, respectively. The temperature decreases gradually after the torch moves away. The maximum temperature on the bottom of the adding transverse rib (Point B) is 351.8°C. And regarding the technical specification, the high temperature strength of Q245R at 350°C is 139 MPa. According to the distribution of stress, the maximum stress of steel beam after being reformed is 147 MPa. So it is dangerous to cut the steel beam using oxyacetylene flame.

(a) Temperature distribution based on numerical analysis. (b) Temperature variation curves of key points predicted with FE model.
3. Monitoring Procedure
3.1. Fibre Bragg Grating Sensor
A new type of FBG strain sensor was designed to measure the strain variation of a structure by Ren [19–22]. Two grippers were set in both sides of FBG as a transfer of axial force to the sensor. The fiber in both sides of a FBG was encapsulated with epoxy resin in the grippers. The bare FBG between two grippers was packaged by steel tube. The steel tube is used just as protective housing and does not transfer the host material strain to the FBG. The FBG strain sensor was packaged by steel tube and fixed with grippers in both sides as presented in Figure 6(a). This packing technique prevents the damage of the bare FBG and has advantages of simple structure, easy packaging, and convenient installation.

(a) FBG strain sensor. (b) FBG temperature sensor.
It is known that the wavelength shift of the reflected light is influenced by both strain and temperature. To eliminate the influence of the ambient temperature on FBG strain sensor, FBG temperature sensors were used for temperature compensating. Figure 6(b) shows an example of the FBG temperature sensors designed by Ren with enhanced sensitivity which is packaged by a stainless steel cube. In the design of the FBG temperature sensor, several novel techniques are presented availably to eliminate the adverse effect of strain and remarkably improve the thermal sensitivity. Temperature sensors provided the necessary data for compensating temperature variation during the cutting process of the steel beams.
Mounting steps of FBG sensors are as follows: Firstly, two steel bricks were welded on the steel beam surface. Then the grippers of FBG strain senor were fixed on the steel bricks when the temperature of bricks was low. At last, the FBG temperature sensor was fixed at the top of FBG strain sensor, as presented in Figure 7. This installation method reduces the contact area between FBG sensor and steel surface and reduces the influence of steel temperature on FBG sensor.

FBG strain sensor welded on steel beam surface.
After this preparation, the assembling of the FBG sensors on the steel beam could be carried out. Since these sensors work in temperature environment below 120°C, they were welded on the top of the adding transverse rib near point D as shown in Figure 4(b). Figure 5(b) shows that the temperature near this location is a safe temperature for sensors in the retrofitting process.
3.2. System of Real-Time Health Monitoring
A polytypic and synchronous data acquisition device system has been developed to measure the FBG sensors and electric signals, including voltage, current, and digital I/O, which have covered most types of electric sensors. This data acquisition device, shown in Figure 8(a), is featured with the following characteristics. (1) A high-power, low-noise swept laser source for FBG demodulation: using a swept laser source instead of a broadband source yields many advantages such as greater distances to FBG sensors (tens of kilometers) and multichannels functionality, wide tuning range (80 nanometers) with more than 100 sensors per fiber, narrow source that provides better repeatability and accuracy, fast laser scanning for dynamic measurements, and real-time built-in calibration that means no periodic recalibration required. (2) A synchronous data acquisition mechanism for polytypic signals: in this system, the signals from FBG and electric sensors pass through FBG demodulation module, voltage module, current module, and digital I/O module, respectively, which are controlled by Field Programmable Gate Array (FPGA). The FPGA, minimizing reliability concerns with true parallel execution and deterministic hardware dedicated to every task, acts as not only the analog signals input unit to sense both FBG and electric sensors but also the synchronous timer with 40 MHz clock to trigger the signals sampling synchronously. (3) An embedded hardware and real-time operating system with industrial stability, as shown in Figure 8(b): the real-time controller contains an industrial processor that reliably and deterministically executes the data communication from the FPGA to host PC and offers multirate control for data acquisition.

(a) The polytypic and synchronous data acquisition device. (b) The software interface of structure health monitoring system.
3.3. Measurement Locations
To provide a comprehensive monitoring in the cutting process, 8 FBG sensor clusters consisting of a strain sensor and a temperature sensor were attached to the steel beam. According to the results of structural analysis and transient thermal analysis, five FBG sensor clusters, sensors numbers 1–5, were distributed along the cutting road. The positions of the sensors are 50 mm, 600 mm, 1,200 mm, 1,800 mm, and 3,500 mm from one end of the steel beam, just like those shown in Figure 9. Three FBG sensor clusters, sensors numbers 6–8, were mounted on the bottom of steel beam, located at 4,000 mm, 5,000 mm, and 6,500 mm from the same reference end of the steel beam as that of FBG 1–5 sensors.

Monitoring points position and number of FBG sensors on steel beam.
4. Real-Time Monitoring from Strain Measurement
4.1. Monitoring Process
During the cutting process, three steps were adapted: (1) In the first step, traditional manual cutting method was adopted near the end of steel beam for the reason that there was no space to place the cutting machine. (2) The middle part was cut by using machine. (3) At the corner removing part, traditional manual cutting method was adopted again.
Before the cutting process started, sensors and polytypic and synchronous data acquisition device were checked. After this preparation, the assembling of the FBG sensors on the steel beam was carried out within a few minutes, and the strain at different cutting process could be observed on the screen of laptop computer. The cutting process and the real-time monitoring process are shown in Figure 10.

Cutting and real-time monitoring process. (a) Cutting process. (b) Real-time monitoring process.
According to the structural analysis, the maximum principal stress on the positions of sensors numbers 1–5 is 80 MPa before the girder is retrofitted. And regarding the technical specification, the high temperature strength of Q245R at 100°C is 210 MPa. In order to guarantee the structural safety, the stress increment should be less than 130 MPa at these points. And the deformation modulus of steel is 206 GPa, so 631
4.2. Monitoring Results
When cutting the steel beam, it is heated and starts to deform. Strain is associated with this deformation. The real-time analysis of strain curves permits continuous monitoring of the structural deformation of steel beam with eight sets of FBG sensor arrays throughout the cutting process and also detecting of the damage initiation, giving information to warn workers to stop cutting process.
Figures 11 and 12 show the data obtained from the FBG strain sensors during the cutting process. The real-time variations of strain data reflect the stress conditions of steel beam in the cutting process. As the curve of sensor number 1 shown in Figure 11, when the cutting process started, the position of FBG sensor number 1 was in tension for the thermal expansion of steel. With temperature increasing, the strain increased sharply. When oxyacetylene flame passed, the strain decreased gradually with the temperature dying down. The strain was volatile at the beginning of cutting machine working and then leveled out after cutting machine moved away. For the reason that the positions of other sensors are far away from the location of changing the cutting way, the monitoring results change smaller than the strain obtained by sensor number 1.

Responses of the FBG sensors in the cutting process observed at positions 1–5.
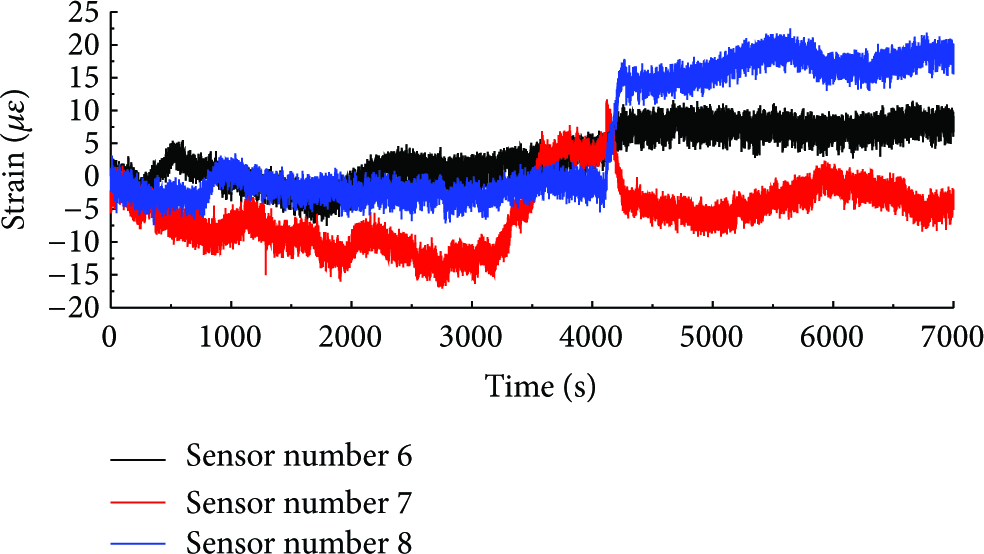
Responses of the FBG sensors in the cutting process observed at positions 6–8.
The detected signal provides a detailed picture about the local strain real-time changes during the cutting process caused by the cutting operation. The strain curves obtained by the sensors indicate the strain variation produced by the cutting process. It can be seen from Figure 11 that the maximal variation of strain recorded by FBG sensor 1 is 270
5. Conclusions
The retrofit of older plants requires the real-time monitoring system, capable of monitoring physical sizes such as vibrations, deformation, and strain, as well as a processing system capable of extracting information, eventually, to produce a reaction like the activation of an alarm or to warn workers of the dangers in structure reforming.
SHM system has been developed for deformation sensing in real-time. This was done using FBG sensors applied for strain sensing under cutting environment. Results of numerical analysis were combined with SHM to determine the distribution of FBG sensors and the early warning threshold value in monitoring process. The use of FBG sensors in real-time monitoring can provide effective monitoring data to permit a faster and more efficient identification of the damage initiation. FBG sensors provide the continuous monitoring of the security of the steel beam. The accuracy of the results obtained validates the use of this technique to know structure premature evolution and behavior up to failure. FBG sensor revealed being more adapted in high temperature environment, showing good radiation and high temperature resistance; even temperature is higher than 100°C.
In summary, the experience shown in the present paper confirms the usefulness and effectiveness of FBG strain measurements in detecting and monitoring the safety of steel beam safety in the cutting process. It is worth pointing out that real-time monitoring is an aspect of buildings safety package for providing safety and minimizing loss of life and equipment under retrofit conditions.
Footnotes
Conflict of Interests
The authors declare no conflict of interests.
Authors’ Contribution
Shuli Fan makes substantial contribution to conception and design, analysis, and interpretation of data. Liang Ren makes substantial contribution to conception and design and acquisition of monitoring data. Hongnan Li participates in drafting the paper or revising it critically for important intellectual content. Biao Song provides acquisition of monitoring data.
Acknowledgments
This work has been supported by the Science Fund for Creative Research Groups of the National Natural Science Foundation of China (Grant no. 51421064), the 973 Program (Grant no. 2015CB060000), the Special Fund for Basic Research on Scientific Instruments of the National Natural Science Foundation of China (Grant no. 51327003), and the Fundamental Research Funds for the Central Universities (DUT15YQ107). These grants are greatly appreciated.