
Abstract
Acute hypotensive episodes (AHEs) are one of the hemodynamic instabilities with high mortality rate that is frequent among many groups of patients. This study presents a methodology to predict AHE for ICU patients based on big data time series. The experimental data we used is mean arterial pressure (MAP), which is transformed from arterial blood pressure (ABP) data. Then, the Hilbert-Huang transform method was used to calculate patient's MAP time series and some features, which are the bandwidth of the amplitude modulation, the frequency modulation, and the power of intrinsic mode function (IMF), were extracted. Finally, the multiple genetic programming (Multi-GP) is used to build the classification models for detection of AHE. The methodology is applied in the datasets of the 10th PhysioNet and Computers Cardiology Challenge in 2009 and Multiparameter Intelligent Monitoring for Intensive Care (MIMIC-II). We achieve the accuracy of 83.33% in the training set and 91.89% in the testing set of the 2009 challenge's dataset and the 84.13% in the training set and 82.41% in the testing set of the MIMIC-II dataset.
1. Introduction
The acute hypotensive episodes (AHEs) are defined for an hour at any time of 30 minutes or more during which at least 90% of the MAP signal measurements are at or below 60 mmHg. AHE is the common phenomenon in the ICU, which may result in irreversible organ damage and eventually death. As a result, the prognoses of AHE are of fundamental importance in the management of critical ill patients, and the early detection of AHE will give professionals much more precious time to determine a proper treatment for patients.
Now the AHE prediction is a hot research topic in medical signal processing. Generally, the research of predicting AHE can be categorized into two types, which are only ABP or MAP signal analysis and ABP with other physiological information analyses. For the only ABP or MAP signal analysis, Bassale [1] proposed to generate the statistical summaries of ABP signals to predict hypotension before hypotension episodes, including the mean, standard deviation, variance, skewness, and the quantile-quantile. Saeed introduced a temporal similarity metric, which applied a wavelet decomposition to characterize time series dynamics at multiple time scales to utilize classical information retrieval algorithms based on a vector-space model. This algorithm was used to identify similar physiologic patterns in hemodynamic time series from ICU patients by the detection of imminent hemodynamic deterioration [2]. Ghaffari et al. [3] used the neural network multimodels to calculate the MAP signal in the forecast window of 1 hour and then predicted the AHE. The first phase mainly trained the models according to comparison analysis between the current blood pressure signal and a collection of historical blood pressure templates. In the second phase, the multimodel structure was employed to predict the possible occurrence of AHE. Moreover, the PhysioNet/computers held a research challenge about detecting the AHE in 2009. In this challenge, some valid approaches were proposed. Foumier and Roy [4] used KL divergence between two distributions to identify the discriminative features and then utilized these features to train the classification model based on the nearest neighbor algorithm. Mneimneh and Povinelli [5] presented a rule-based approach for the prediction of the AHE.
In the ABP with other physiological information analyses, Singla et al. [6] showed the correlation between some independent variables and the development of early hypotension episodes. Those variables included age, sex, body mass index, history of hypertension, diabetes mellitus, anemia, heart rate, and systolic and diastolic blood pressure. Lin et al. [7] studied the association of specific variables with the increasing risk of hypotensive episodes, namely, weight, height, American Society of Anesthesiologist physical status, surgical category (orthopedics, plastic surgery, general surgery, obstetrics, and urology), and systolic blood pressure. Based on these variables, Lin et al. proposed a logistic regression model to assess the risk of developing a hypotensive episode. Frölich and Caton discovered that the higher baseline heart rate, which possibly reflected a higher sympathetic tone, might be a useful parameter to predict hypotension in 2002 [8]. Rocha et al. aimed to detect AHE and MAP dropping regimes (MAPDRs) using electrocardiogram (ECG) signal and ABP waveforms in 2010 [9], and this method was based on calculating the shock occurrence probability with an adaptive network fuzzy inference system, which incorporated the influences of heart rate, systolic blood pressure, diastolic blood pressure, age, gender, weight, and some miscellaneous factors.
This paper demonstrates how AHE can be predicted in the next 1-hour forecast window. In order to achieve this aim, the analytic signals are obtained from MAP with the Hilbert-Huang transform method, and then five features are absorbed in the analytic signals. Genetic programming (GP) is an effective method to select features and constructs a classifier simultaneously [10–12]. In this work, multi-GP is used to classify the AHE and no AHE patients. (In particular, AHE means there is an episode of acute hypotension beginning within the forecast window.) The validation sets consist of two datasets, A and B. The set A is comprised of 110 records [13], while the set B is comprised of 2866 records which are obtained from MIMIC-II database [14]. The experiment shows that our method achieved accuracy of 83.33% and 91.89% in the training and testing sets of set A, respectively, and of 84.13% and 82.41% in set B.
In the following section, the database and methods of the application are described in detail. In Section 2, the datasets are introduced briefly. In Section 3, the methodology is introduced, including the Hilbert-Huang transform, features extraction method, and multi-GP classifier method. The experiment verification and discussion are given in Section 4. The last section gives conclusions.
2. Datasets
In the MIMIC-II, patients’ records contain most of the information that would appear in a medical record, such as results of laboratory tests, medications, and hourly vital signs. About 5000 records also include physiologic waveforms, such as ECG, blood pressure, and respiration. The intent is that a MIMIC-II record should be sufficiently detailed to allow its use in studies, for example, for basic research in intensive care medicine or for development and evaluation of diagnostic and predictive algorithms for medical decision support [13, 14].
The blood pressure signal includes systolic arterial blood pressure (SABP), diastolic arterial blood pressure (DABP), heart rate, SpO2, pulse, and respiration. The SABP is the maximum pressure (Figure 1, red box) when the heart contracts and blood begins to flow. The DABP is the minimum pressure occurring (Figure 1, green circle) between heartbeats (see Figure 1).

ABP, SABP, and DABP diagram.
In this experiment, we focus on MAP signal analysis, which is calculated as follows:

For example, the ABP data during five minutes before

Transform ABP to MAP data.
Each data record contains 3-hour data, including 2-hour data before
In this paper, we will put forward a methodology to predict AHE in the forecast window with the MAP data. The validation sets consisted of two datasets, A and B. Set A is the 2009 challenge dataset which is selected from the MIMIC-II patients’ records. Because of some missed data, only 48 records and 37 records are selected as training set and testing set. Set B is a big dataset which contains 2866 records downloaded from MIMIC-II 3.0 dataset. For all records used in the datasets A and B, the sampling frequency is 1 Hz and their signals are MAP.
3. Methodology
An overview of the methodology of this work is proposed in Figure 3. Firstly, the MAP signal before

The methodology of predicting AHE.
3.1. The Hilbert-Huang Transform Method
The Hilbert-Huang transform (HHT) is an adaptive method for time series signal analysis, which is proposed by Huang et al. [15]. HHT is composed of EMD method and the Hilbert spectrum analysis (HSA) method. The HHT is used in many applications, such as gravitational wave, biomedicine, and nonlinear system. In this work, the EMD method is applied to data decomposition of patients’ MAP signals.
The sifting process of EMD can decompose the complex signal into a finite number of IMFs adaptively, according to the local characteristic time scale of the source signal/data. As a consequence, each IMF component contains the local characteristics of original signals in different time scales. Each IMF must satisfy the following conditions.
In the whole data sequence, the number of extreme values and the number of zero crossing points must be the same or not more than one at most. At any time, the envelope mean, defined by the signal of local maximum and minimum, is zeros.
For a fixed length time series signal
Step 1.
Find out all the local maximums and minimums of the signal

Step 2.
Define the intermediate variable
Step 3.
When
Step 4.
Repeat the process with the residual signal
At the end of the decomposition, the original signal

3.2. Feature Extraction Method
Feature extraction methods are important for classification problems [16]. In this paper, the Hilbert-Huang transform method was used to extract some features. In the Hilbert-Huang transform method, the Hilbert spectrum expresses the time-frequency-energy distribution in the source signal. Each IMF signal means the local information of source signal; meanwhile, the HSA can obtain instantaneous significance from the IMF. In a MAP time series, the instantaneous parameters, including the instantaneous amplitude, instantaneous frequency, and instantaneous power, are significant for the features extraction through the EMD and HSA (further information about the Hilbert spectrum representation of the nonstationary data can be found in [15]). For each IMF signal, the Hilbert transform is defined as follows:

The

The

The polar form of analytic signal reflects the physical meaning of the Hilbert transform, which obtains the local optimal approximation through a sinusoidal frequency and amplitude modulation. Therefore, considering the definition of the instantaneous frequency, the instantaneous frequency

In order to measure the instantaneous amplitude


In this work, we select the first three IMFs signals of AMB and FMB, respectively, and the last IMF's power as the seven features for classification. Because energy changes more rapidly in the first three AMBs than it does in the other AMBs, coincidentally, the first three FMBs have more significant changes than the other three ones. Moreover, the last IMF's power can express the patient's blood pressure level.
3.3. Multigenetic Programming Classifiers
Based on the Hilbert-Huang transform method, we have extracted five classification features. These features can express the AHE signals in both time domain and frequency domain. After that, training the best classifier assists us in predicting whether the patients suffered from AHE.
GP is an automatic programming technique for evolving computer programs, which is able to solve problems in a wider range of disciplines (may be more powerful than neural networks and other machine learning techniques) [10] and is widely applied in evolutionary computation [19]. GP is applied in the classifiers design and feature selection frequently [11, 12]. For example, for the attributes A, B, and C and the target attributes, yes and no, with the mathematical operator set

Basic GP classifier model.
The classifier is a discriminant function which is defined as:

In this work, binary classifier algorithm based on GP [11, 12] is used for classifier and the fitness function is defined as follows:

In order to avoid model overfitting, the dataset is split for training models. The process is showed in Figure 5. In the beginning ①, the dataset is split into


Multigenetic programming classifier method.
By voting combination, the classification model consists of several discriminate functions (named multigenetic programming classifiers). Then, for each record in testing data,
4. Result and Discussion
For clarity, two source signals, no AHE patient (number 3831217 nm) and AHE patient (number 3061778 nm), are randomly selected to describe the methodology presented in this paper. The source signals are showed in Figures 6 and 7, respectively.

Source signal of number 3831217 nm (no AHE).

Source Signal of number 3061778 nm (AHE).
As mentioned before, the EMD method provides an approach to decompose the source signal of patients into a set of IMFs. The IMFs

IMFs of the patient of no AHE.

IMFs of the patient of AHE.
The first component, which is decomposed by EMD method, contains higher frequency components than the second and the others. The first half parts of the IMFs could be defined as the high frequency components, and the rest are low frequency components. In the high frequency of IMFs, no AHE patients are smoother than AHE patients. It can be found that the AHE patient in Figure 9 is easy to rise sharp fluctuation in a certain period of time (box parts in Figure 9
Then, in order to explain the changes of frequency and amplitude simultaneously, IMFs signals are transformed into the analytic signals by the Hilbert-Huang transform. According to the obtained analytic signals, the instantaneous amplitude (IA) of no AHE and AHE could be calculated and displayed in Figures 10 and 11. The instantaneous frequency (IF) could be calculated and displayed in Figures 12 and 13. Generally, the IA can be interpreted as one patient's intensity of blood pressure, and the IF can be interpreted to be the changing speed of blood pressure.
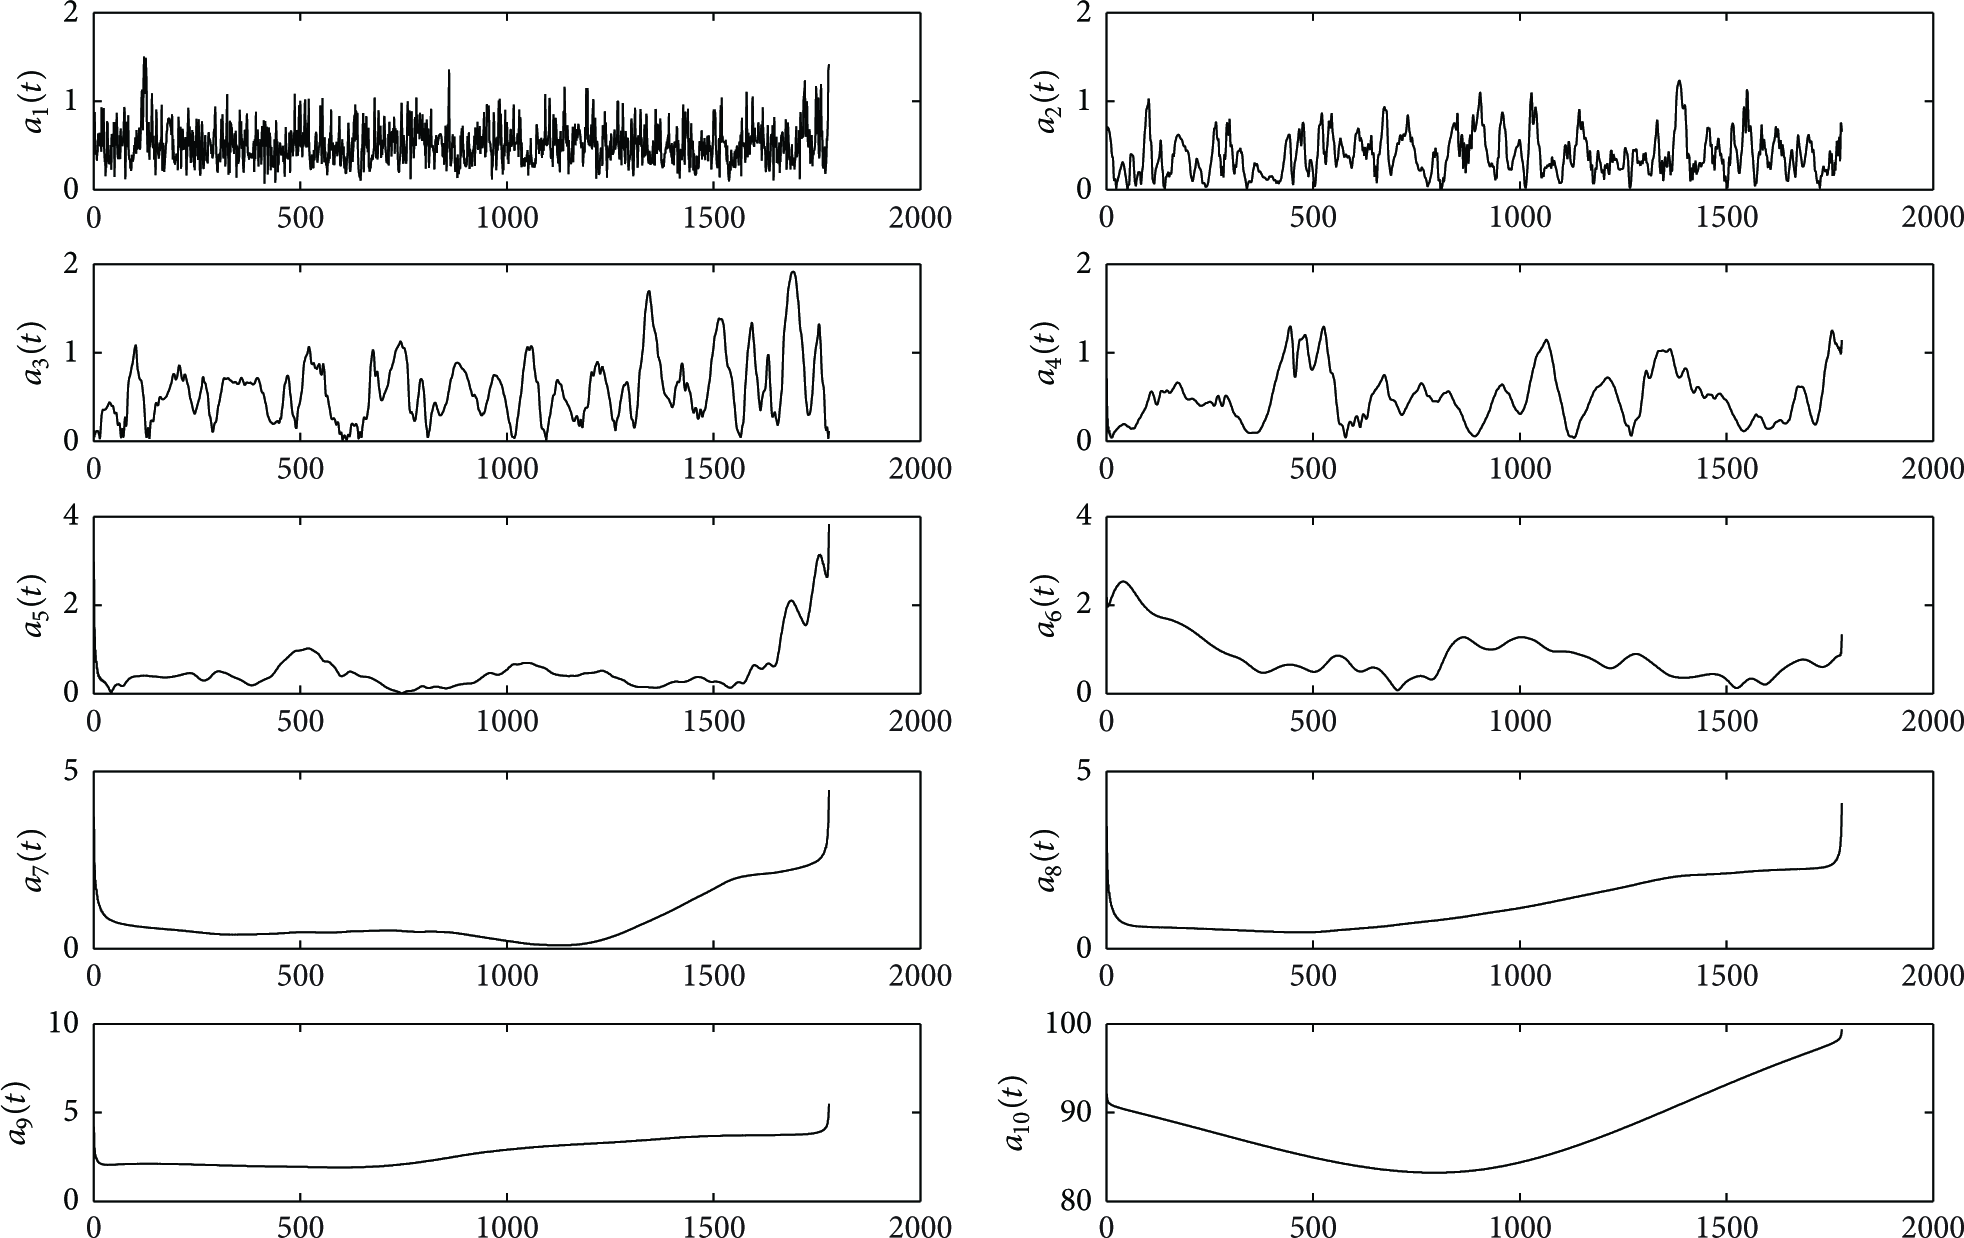
IA of the patient of no AHE.
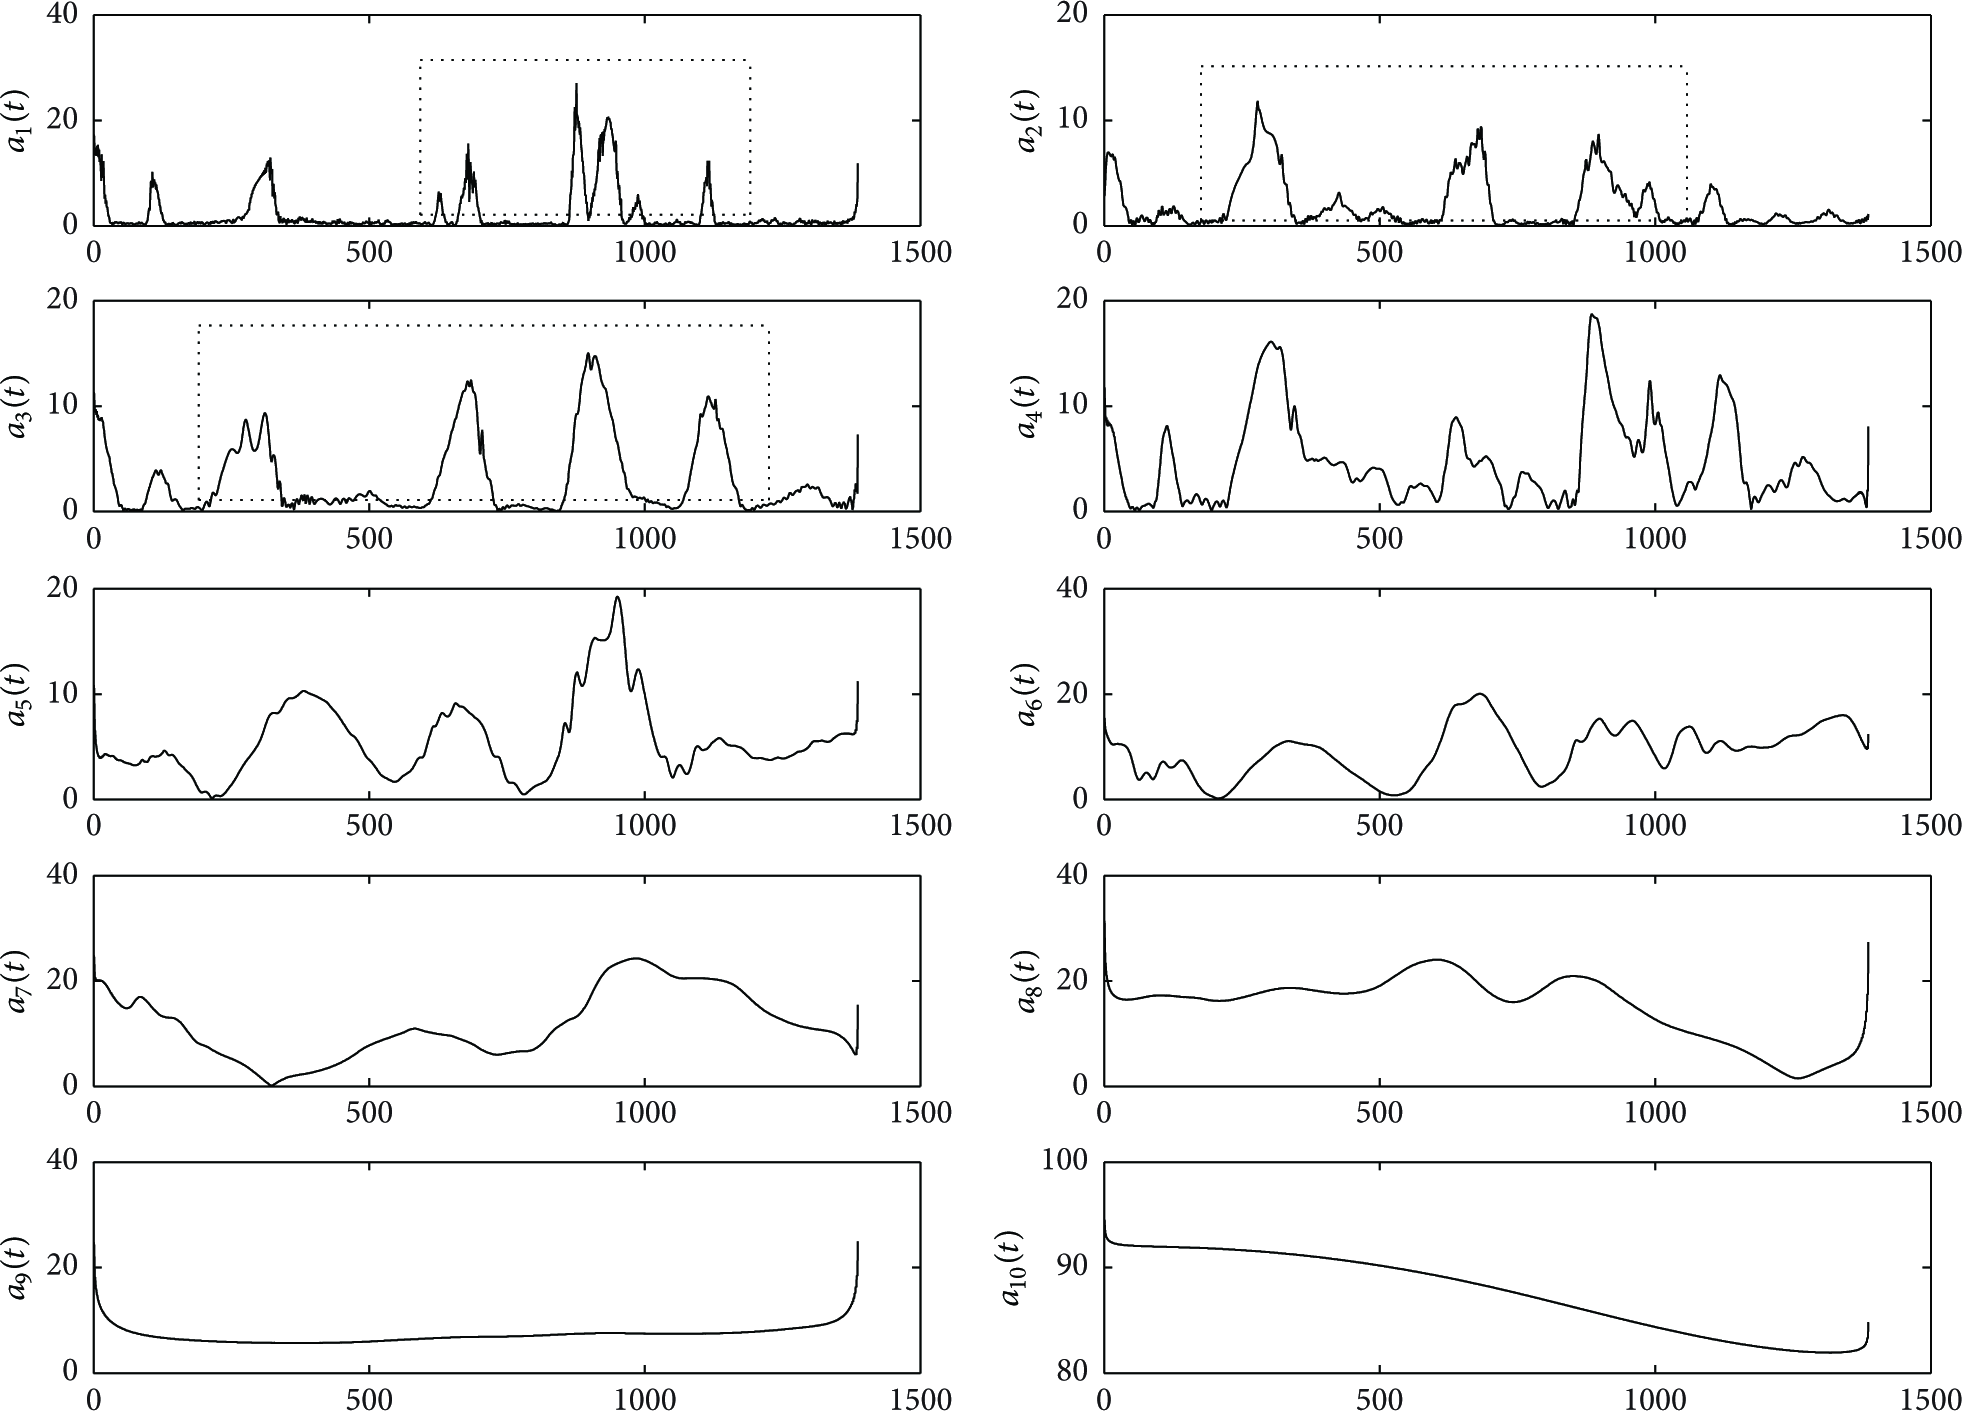
IA of the patient of AHE.
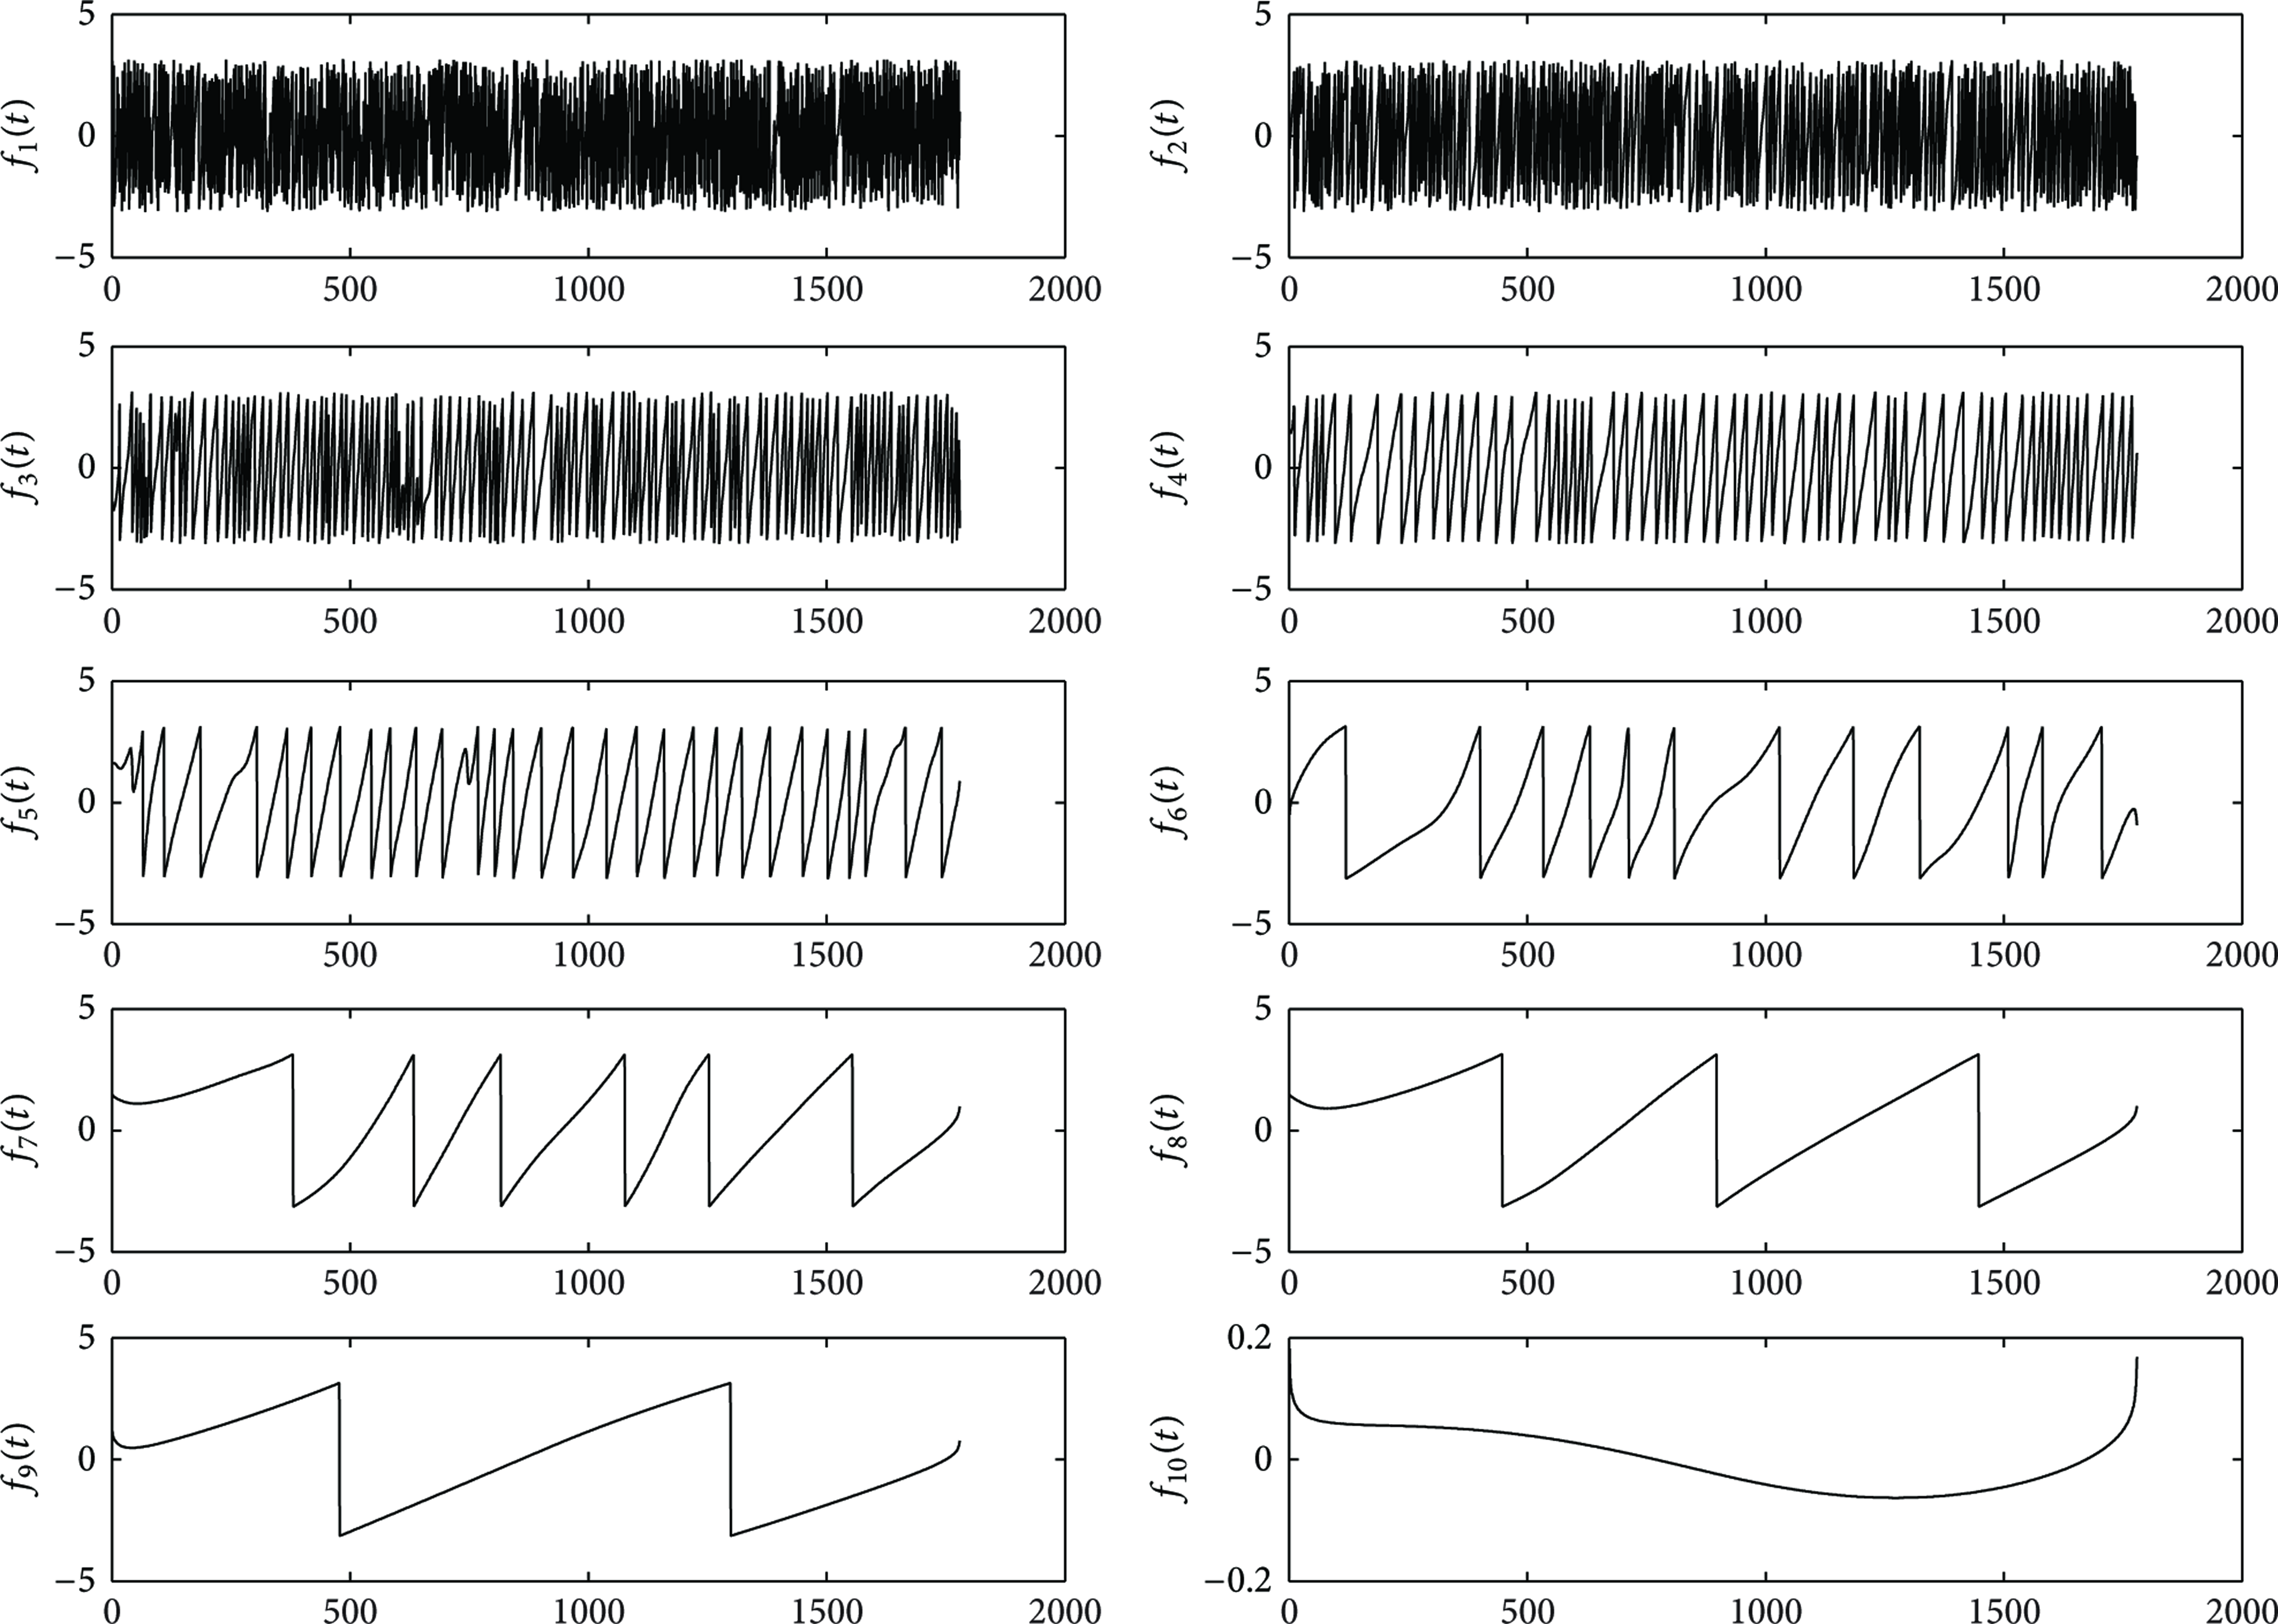
IF of the patient of no AHE.

IF of the patient of AHE.
The extracted features, AMB and FMB, are applied to measure the abrupt change of the IA and IF, respectively. According to our experiments, the magnitude of the first three components can clearly distinguish the changing of patients. Thus, the corresponding values of AMB and FMB are the inputs of classifier. Table 1 presents a sample of AMB and FMB values for no AHE and AHE patients.
The AMB and FMB for no AHE and AHE patients.
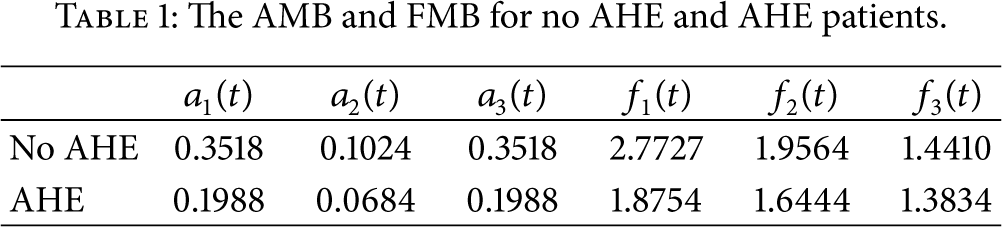
According to the result of experiments, the first component of instantaneous amplitude and frequency is necessary, which expresses the volatility of a patient's health condition. Besides, the second or third component is a complementary component for distinguishing the AHE and no AHE patients. Furthermore, the amplitude of the last IMF is much higher than other components; it could be said that the last IMF accumulates the most of the energy of the source signal. The experiment shows that the no AHE patients own the higher energy than the AHE patients. So the signal power, a manifestation of energy, is selected as the measurement parameter for distinguishing the AHE and no AHE patients.
Thus, for multi-GP classifier, the
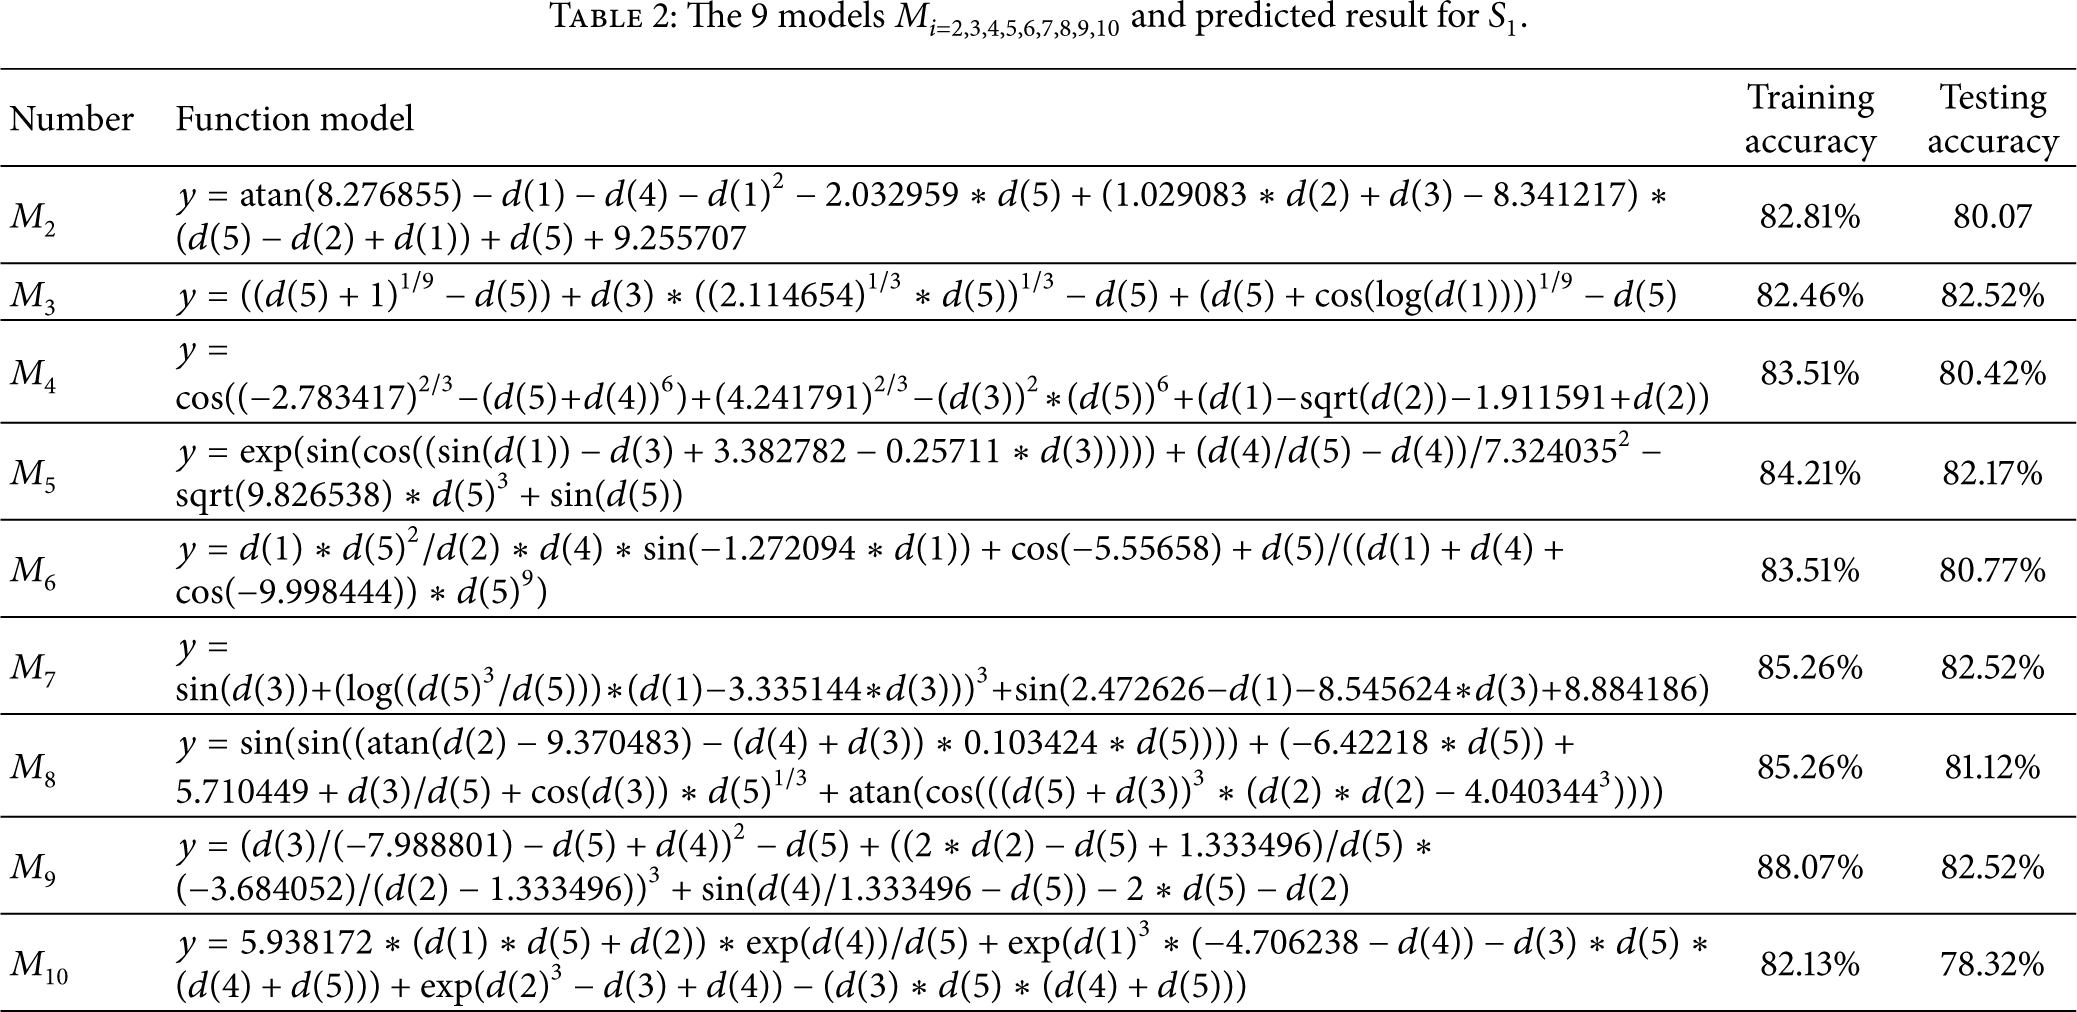
Because the set B is a big dataset, the dataset is randomly divided into 10 subdatasets (datasets
The 9 models
The results obtained by Multi-GP and SVM.
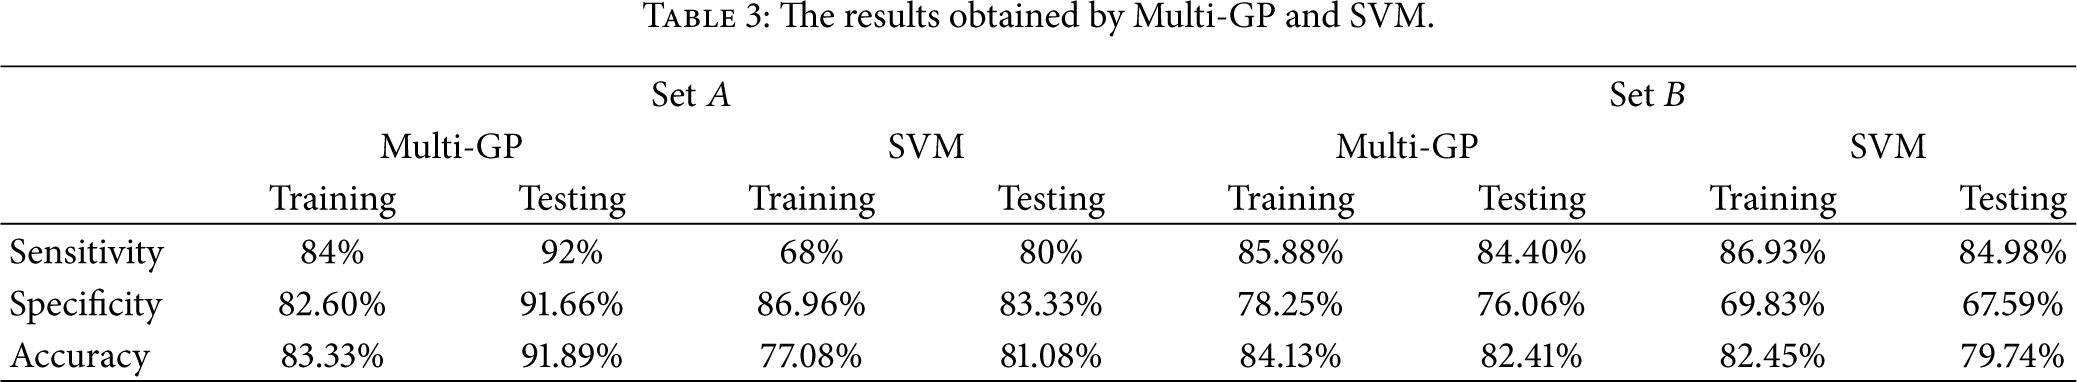
The accuracy of the multi-GP classifier is 83.33% and 91.89% with the proposed features in the training data and testing data of set A, and the accuracy is 84.13% and 82.41% in set B, respectively. Furthermore, within the same training and testing set, the SVM method with radial basis function kernel (
5. Conclusion
Time series data is pervasive across almost all human endeavors, including medicine, finance, science, and entertainment. As such, it is hardly surprising that time series data mining has attracted significant attention. As typical medical time series data, MAP signals are analyzed tentatively in this work. As a nonlinear and nonstationary signal processing tool, EMD method is used to decompose the MAP time series into a number of IMFs. The complex and unordered MAP data become regular and become ordered by the decomposition. After features extraction, multi-GP method is used to establish the classifier for AHE prediction. The result shows that the classification model can provide the medical guidance for predicting, which is significant for the care and cure of AHE in ICU.
For future work, as a much potential method, EMD is worth analyzing and applying with more effort. More features can be extracted in the IMFs. After that, we can select useful features based on the GP's ability of feature selection. In the multi-GP classifier voting decision theory, we can assign different parameters in different model [20]. Furthermore, the methodology of this paper could be applied into other applications, such as internet of things, mobile computing, and cloud computing [21, 22].
Footnotes
Conflict of Interests
The authors declare that there is no conflict of interests regarding the publication of this paper.
Acknowledgments
This work was supported by Natural Science Foundation of Guangdong Province (no. S2013010013974), in part by the Shantou University National Foundation Cultivation Project (no. NFC13003), and in part by the National Natural Science Foundation of China (no. 61175073 and no. U1135005).