
Abstract
WSN (wireless sensor network) technology came to become fairly activated and as WSN is a part of the world's environment, research on it is considered important. WSN automated life and work; miniaturized wireless sensor nodes enable observational measurement in regions where access by humans is difficult or periodic sensing data is necessary. Thousands of such sensor nodes are needed. However, when they are wrongly placed in an observed area, sensor node batteries may run out fast or disconnection may result, which may trigger the loss of sensing data by sensor nodes and create an enormous cost. Moreover, even though sensor nodes have the same function, there are different kinds; therefore, it is difficult to select and place optimal sensor nodes. Accordingly, this paper proposed the WS3L (wireless sensor simulator using sensor log) as a simulator aimed at the composition of a more efficient sensing infrastructure and problem analysis for Internet of Things. This WS3L utilized sensor log data for precise prediction, not merely execution depending on simulators developed earlier. This WS3L read sensor log data of the observed area from the user and provided various analysis functions to examine problems.
1. Introduction
Owing to the rapid development of the wireless sensor network (WSN) in IT, the quality of life has drastically improved. Using diverse sensor nodes in the observed area, WSN detects an incident and delivers sensing data to sink nodes through the network. Then, this sensing data is transmitted to the middleware, or the server. The transmitted information is properly processed by application programs to be used for various services (national defense, aerospace, distribution, industries, security, disasters, and U-care) [1–5].
In such a WSN environment, the consumption of batteries should be evenly minimized given the cost of sensor modules, the enormous installation cost when its size is large, and the sensing infrastructure maintenance and repair cost. For actual experiments on the WSN that requires hundreds or even thousands of sensor nodes; the cost of the sensor nodes, the time taken for the program to load, debugging for information logging, tracing for information analysis, and the external interference through other communication equipment should be taken into account. In addition, even if sensor nodes have the same function, there are different kinds and it is very difficult to select and place the optimal sensor nodes in the observed area [6–13]. For such reasons, different kinds of simulators, including ATEMU [14, 15], AVRORA [16], EmStar [17], GloMoSim [18], NS2 [19, 20], NS3 [20], QualNet [21], SENSE [22], SWANS [23], and TOSSIM [24], have been developed as tools for the selection and placement of sensor nodes and the design and verification of protocols.
However, although such various kinds of simulators have been developed, detailed simulation is tricky due to their restricted functions, thereby producing very limited outcomes. Their execution speed is fairly slow, and the processing on a large or small scale of networks is poor. Besides, sensors do not provide functions to derive and enhance problems in the observed area where they have been actually installed, and therefore, the formation of an efficient sensing green infrastructure is difficult to attain.
Accordingly, we propose a WS3L that uses sensor log data in order to form an efficient sensing infrastructure. WS3L enables the inference of an optimal placement by deriving and ameliorating problems through the visualization of an actually observed area through using sensor log data in a constructed WSN environment. This paper is composed as follows. Section 2 explains the operation mechanisms of previously developed WSN simulators. Section 3 expounds upon sensor log data, sensor node analysis, visualization, and the graphics processing unit (GPU) mode of the WS3L proposed in this study. Section 4 deals with the design of the WS3L. Section 5 is concerned with the embodiment of the WS3L, while Section 6 comparatively explains the performance improvement of existing simulators. Finally, Section 7 consists of an overall summary, conclusion, and future research tasks.
2. Related Works
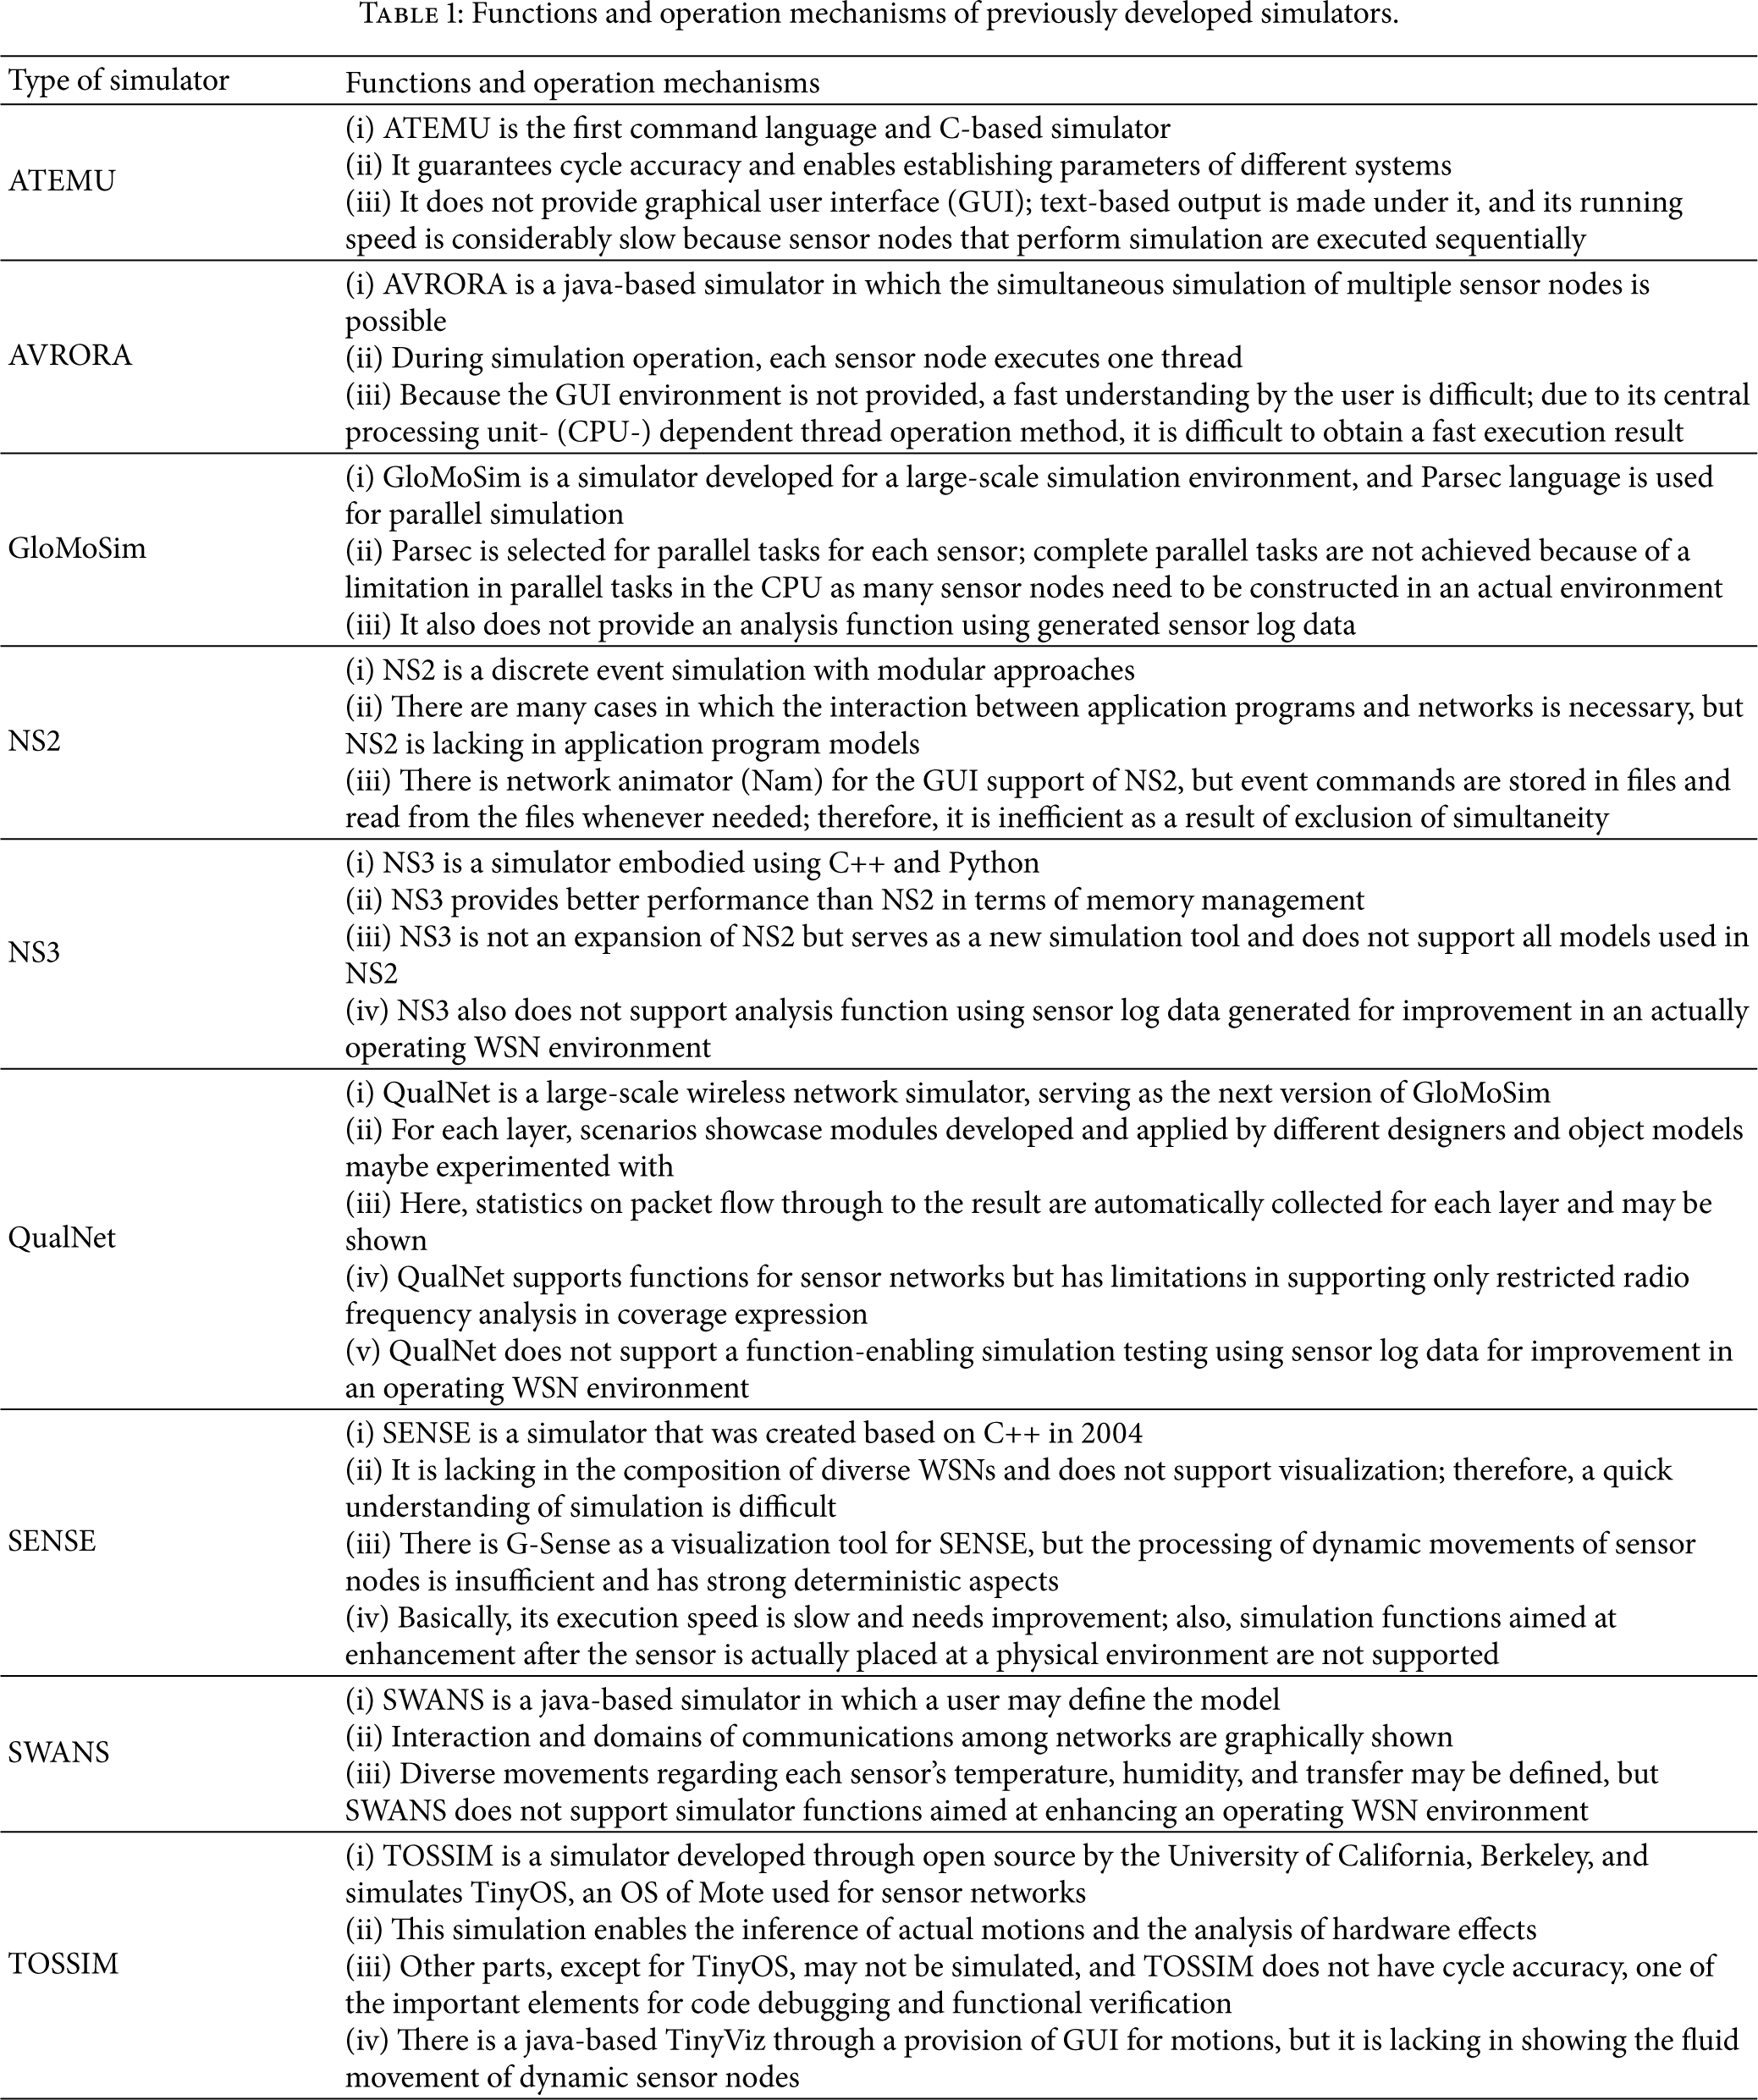
The functions and operation mechanisms of previously developed simulators introduced by relevant works—ATEMU [14], AVRORA [15], GloMoSim [18], NS2 [19, 20], NS3 [20], QualNet [21], SENSE [22], SWANS [23], and TOSSIM [24]—have been examined. Table 1 shows the functions and operation mechanisms of previously developed simulators.
Functions and operation mechanisms of previously developed simulators.
3. Scheme of WS3L
The basic functional structure of the WS3L proposed, along with its method to use sensor nodes, is as follows.
3.1. Sensor Log Data
In an actually composed sensing infrastructure, each sensor node does not evenly consume power and therefore, the composition of topology may be changed. In addition, a considerable number of sensor nodes are placed and therefore, enormous time and effort are required to find and modify errors; furthermore, testing each sensor node is actually impossible.
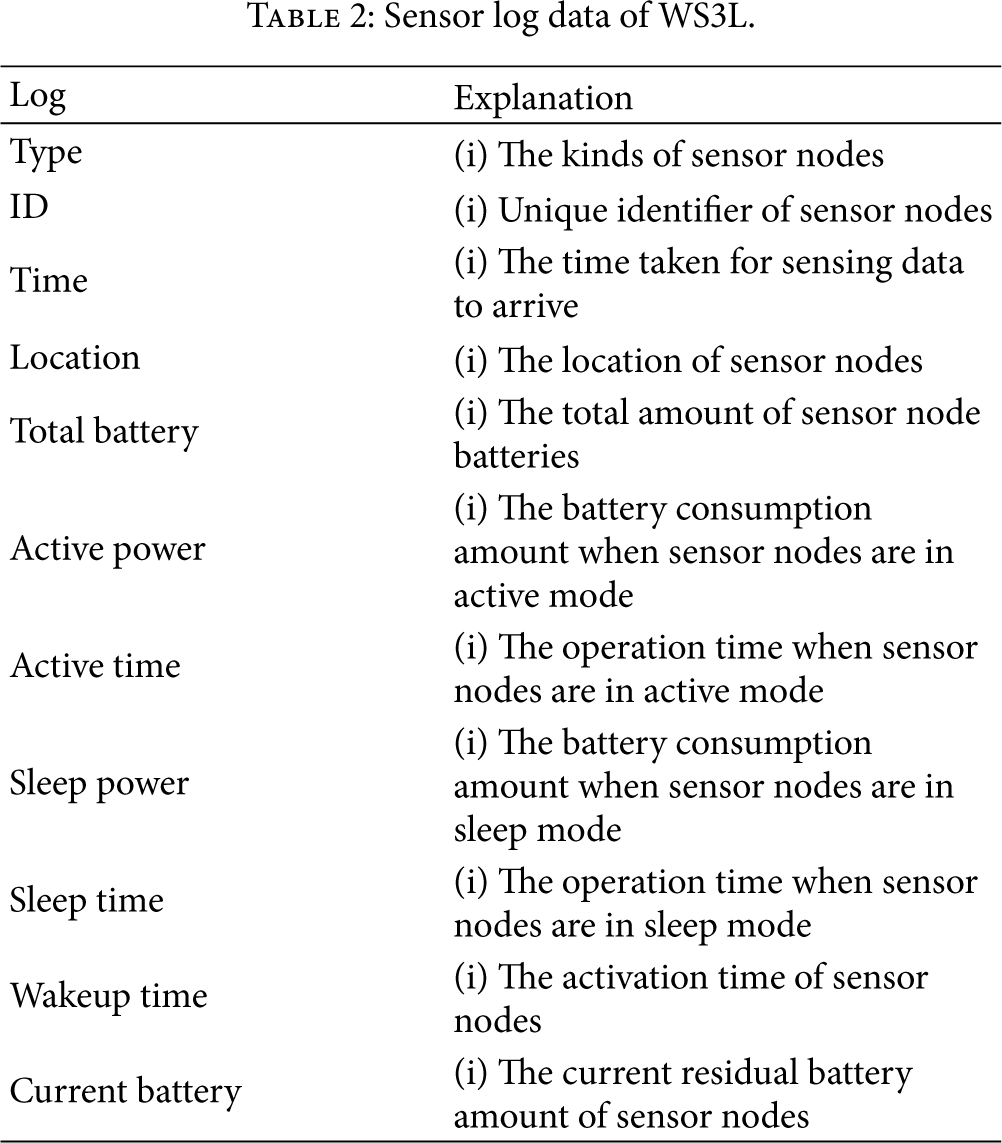
WS3L uses sensor log data in order to derive problems in actually observed areas. Sensor log data is comprised of type, aimed at classifying different kinds of sensor nodes; ID, to identify each sensor node; time, which shows time taken to deliver sensing data; location, which represents the location of sensor nodes through a global positioning system; total battery, which signifies the total amount of batteries; active power, which signifies battery consumption amount when the sensor nodes are in an activated mode and time, representing operation time; sleep power, which shows the battery consumption amount when the sensors are in sleep mode and sleep time, which is time duration in sleep mode; wakeup time, which represents the time of sensor note activation; and current battery, which is the current residual amount of sensor node batteries as shown in Table 2.
Sensor log data of WS3L.
Sensor log data is extracted based on the information obtained from actually composed sensing infrastructure.
3.2. Analysis of Sensor Nodes of WS3L
For the analysis of sensor nodes, the log data in Table 2 is used; the operation and life time of the sensing infrastructure and battery consumption by each sensor node were analyzed.
When the total amount of batteries is 
In addition, the battery consumption amount is 
For the comparison of sensing infrastructure, a comparative analysis between the residual lifetimes of each sensor node is calculated by the formulas (1) and (2), and the expected residual lifetime is possible.
When the first sensor node is 
The battery consumption rate of the sensor node 
By comparing the battery consumption rate of each sensor through the formula (4), the locations of the sensor nodes and the causes of any problems may be actively clarified.
3.3. Visualization of WS3L
WS3L provides the visualization to users of the WSN environment by using sensor log data. The basic functions of visualization are to show the residual amount and consumption rate of batteries and sensors’ routes. The battery consumption rate is visualized in a circle, as shown in Figure 1, with the coordinate of the sensor node as the standard. ① and ② in Figure 1 show the residual battery amount of a sensor node in gradation and a primary color, respectively. The range and selection of this color is set at green and red, and the user may arbitrarily change them.

Battery visualization of WS3L.
WS3L provides a battery consumption analysis function by each time slot. The analysis is to depict each sensor node's battery consumption state with a graph indicating the units of year, month, week, day, hour, minute, and second using sensor log data. In addition, the average battery consumption rate of the sensor nodes is calculated and sensors whose battery consumption amount is larger than the standard value set by the user may be extracted. Such functions are to visualize the sensor log data extracted based on mere text as in Figure 2; the timing of replacing actually placed sensor nodes is known and the causes of such problems are analyzed, thereby enabling an active response. ① and ② in Figure 2 show the visualization of a sensor node in which the battery residual amount is smaller than 20% and 40%, respectively.

Visualization of battery residual amount of a sensor node.
3.4. GPU Mode of WS3L
Previously developed simulators express one sensor node per each thread in order to represent independent sensor nodes. Such methods induce optimal performance when the number of CPUs is the same or larger than the number of sensor nodes. Nonetheless, in an actual WSN environment, hundreds of sensor nodes operate, and due to frequent context-switch, synchronization processing becomes large, which results in very slow execution speeds. For fast simulation execution, the WS3L supports the GPU mode under the NVIDIA-based system. The WS3L provides two kinds of simulation functions according to whether java binding for compute unified device architecture (JCUDA) is supported for GPU use by an operating system. When JCUDA is supported, the calculation processing of sensor nodes is maximized by performing calculations in many-core GPU, and not a single-core or multicore CPU, for the analysis of each node according to the number of simulation sensor nodes. Here, the operation provides an automated execution of the WS3L and an execution function by a user's manual selection. Because the function of the automated execution of the WS3L may have a lower performance than the CPU, according to the performance of GPU that supports JCUDA, an automated execution of the WS3L is made when the number of sensor nodes is the same or larger than the number of GPU-supported threads. If JCUDA is not supported, a simulation is conducted using CPU only.
4. Design of WS3L
The WS3L proposed in this paper is functionally divided into user interface, map manager, map controller, log manager, node generator, node manager, interaction broker, coordinate converter, and viewer. Figure 3 displays the structure diagram of its overall functions.

Architecture of WS3L.
User interface is subdivided into graph interface, log interface, map interface, and node interface. Graph interface is where the visualization of sensor nodes under simulation is selected by users and provides the expression units of graphs by seconds, minutes, hours, days, weeks, and years. Log interface is where sensor log data is inputted for the simulation of the operating sensing infrastructure; it not only visualizes the operation condition of sensors and the residual battery amount, but also predicts its consumption condition. Map interface may set the location information of the observed area through the input of actual topography and mapping, which is made possible through geography markup language (GML). Node interface consists of the following: range control, which can set basic sensor information, such as sensing range, communication range, supersonic wave range, and trace range, which is to receive the input of range in order to compare the battery consumption of the selected sensor node with that of the other sensor nodes; mobile information, in order to establish information on mobile sensor nodes; and fixed information, which sets information on fixed sensor nodes. Mobile information and fixed information receive input from user input for the setting of active power, active time, sleep power, sleep time, total battery, sensor location, and wakeup time. Operation mode enables the automated execution of the WS3L and the selection of an execution method by a user.
Map manager plays the role of applying actual topography and mapping possible GML documents to the WS3L and managing them. In more detail, the map manager is composed of a GML importer aimed at adding GML documents selected by a user to the WS3L through the map interface of the user interface; GML parser, which makes an analysis in order to apply added GML documents to the WS3L; a map layer, which generates map objects after judging whether the objects of analyzed GML topography data are obstacles and sends them to the layer manager; the layer manger, which manages topography information delivered from the map layer.
The map controller operates when the input is received from a user through the map interface of the user interface and performs the zooming in and out of maps, domain magnification, and selection and transfer. The result of such functional executions is shown to a user in the viewer through the coordinate converter. The log manager is comprised of sensor log importer to add sensor log documents to the WS3L through a log interface of user interface, as well as sensor log analysis to analyze added sensor log data in order to transform it into sensor objects. Analyzed sensor objects are added to the sensor object list (SOL) and sent to the node generator.
The node generator is where sensor nodes are generated for simulation. The node generator consists of node type analysis that analyzes the sensor type of SOL delivered from the log manager and sensor creation (SC) that generates sensors. SC generates mobile sensors and fixed sensors, according to the type of analyzed sensor, and the generated sensor node is sent to the node manager.
The node manager classifies the sensor node delivered from the node generator as a mobile type or a fixed type and adds it to the mobile sensors list or fixed sensors list. The added sensor nodes are operated by the node CPU operator, which performs calculation through the CPU, or the node GPU operator, which conducts calculation through the GPU according to the user's set battery consumption rate and expected lifetime, and whether the simulated system is GPU or CPU. The sensor data analyzed in such a way is then delivered to the coordinate converter and finally visualized through a viewer for the user. The interaction broker functions as a broker that sends operation modes or changes in sensor setting input from the user interface to the map controller and the node manager. The coordinate converter processes and sends data on operation situations through topography and log information of sensor nodes so that it can be shown in the viewer.
The viewer is composed of a mobile sensor node (MSN) viewer that visualizes dynamically moving sensor nodes according to processed data delivered through a coordinate converter, a fixed sensor node (FSN) viewer that visualizes fixed-type sensor nodes, a map viewer that visualizes topography, and a stats viewer aimed at visually showing diverse analysis results of the MSN or FSN. Through this viewer, a user may predict the expected residual lifetime of sensor nodes, derive problems through operation situations, and make active responses.
5. Implementation of WS3L
Figure 4 displays the initial implementation screen of the WS3L. In ① of Figure 4, a user makes an input so that a single view mode simulation or a dual view mode simulation of the WS3L is selected among mobile and fixed modes according to the sensor node type. In ② of Figure 4, information is revised when intending to change the sensor type of the read sensor log. In ③ of Figure 4, a sensor log data file is selected and in ④ of Figure 4, the read sensor log data file is visualized and analyzed. ⑤ of Figure 4 represents a control view of the MSN viewer; in ⑥ of Figure 4, the sensing range, communication range, supersonic wave range, node trace line, node connection, and node trace range may be set by a user so that the diverse setting of the sensor node on the sensor log data file may be read through a control view of the FSN viewer. ⑦ of Figure 4 represents a frame activated when the right side of the mouse is clicked on the simulation view and the execution mode for the simulation calculation is selected among auto, GPU, and CPU. The basic setting is auto, and an operation is made according to whether CUDA of NVIDIA is supported.

Initial execution screen of WS3L.
Figure 5 is a simulation screen that uses sensor log data. ① of Figure 5 shows the movement of the mobile sensor node and the battery consumption state. According to the battery consumption state, the color of the sensor node gradually changes from green to red. ② of Figure 5 visualizes the location of the fixed sensor node and the battery consumption state, enabling the user to know whether all of the sensor node batteries are evenly consumed. In addition, through the control view of MSN and FSN, the revision of sensor nodes and a comparison with other sensor nodes are made possible.

Operation screen using sensor log data of WS3L.
Figure 6 visualizes the residual amount of sensor node batteries within the sensing infrastructure. When a user selects a sensor node whose location information is needed, the ID of the sensor and the coordinate mapped on the GML are shown. Through this, the user may judge battery exchange location and timing for the maintenance of sensing infrastructure.

Location identification through sensor node coordinate of WS3L.
6. Performance Evaluation
For performance evaluation, the lifetime of sensing infrastructure was predicted using sensor log data through the WS3L embodied in this paper, and the execution performance of the WS3L was analyzed. For the prediction of sensing the infrastructure's lifetime, a battery consumption state for 100 sensor nodes, as shown in Figure 7, was applied for 10 days. Figure 7 represents log data on a sensor node whose battery consumption rate is 0.04 mA and whose active time is five seconds under the active mode, and whose battery consumption rate is 0.3 μA and whose sleep time is 1795 seconds under the sleep mode.

Log file on 100 sensor nodes for 10 days.
① of Figure 8 is a graph that shows the battery consumption state when 100 sensor nodes are executed for 10 days using the WS3L. In this graph, a user may adjust the battery unit and y-axis interval, the measurement time cycle, and the x-axis interval. When the battery interval is 300 mA, the cycle of time is a day. ② of Figure 8 is a graph that predicts the lifetime of the residual battery amount based on the battery consumption state shown in the graph of ①. In ②, the blue line represents the battery consumption state of all of the sensor nodes for 10 days, while the red line enables an estimation of the residual lifetime for 24 days, according to the slope produced through the blue line.

Prediction of battery lifetime using sensor log data of WS3L.
Figure 9 makes a comparison of simulation speed of the sensor log data in Figure 7 in order to compare the CPU mode, GPU mode, and auto mode of the WS3L. The auto mode of the WS3L is executed according to whether CUDA of the executed system is supported. The auto mode is determined by the number of threads of GPU; when 1024 threads are possible, a calculation of a maximum of 1024 sensor nodes is conducted. In addition, in order to appropriately select the CPU and GPU modes, a performance comparison is internally made according to the number of sensor nodes. In other words, when a simulation is executed for the first time in the system, the performance of the GPU is measured. For measurement of GPU performance, the calculation execution time of the sensor nodes executed in CPU as well as the calculation execution time of the sensor nodes executed in the GPU is compared, thereby finding the starting point of the GPU mode operation when the calculation result is above a certain threshold. In Figure 9, the CPU and GPU calculations are conducted under the auto mode, according to sensor log data amount. When a calculation is made only under the CPU mode, the calculation execution time becomes long due to an increase in sensor log data. Under the GPU mode only, performance is faster than under the CPU mode when many calculations are required, but when a small number of calculations are needed, the processing speed slows down due to the data duplication of global memory.

Comparison of processing speed of WS3L under CPU, GPU, and auto modes.
7. Conclusion
As WSN is a part of the world's environment, research on it is considered important. Accordingly, this paper proposed the WS3L as a simulator aimed at the composition of a more efficient sensing infrastructure and problem analysis for Internet of Things. This WS3L utilized sensor log data for precise prediction, not merely execution depending on simulators developed earlier. This WS3L read sensor log data of the observed area from the user and provided various analysis functions to examine problems.
Future research will be concerned with a framework for software modulation of sensor type in order to simulate a diversity of sensor environments. In addition, for improved calculation speed when simulations of many sensor nodes are operated, component modulation and interface for memory setting will be studied in order to consider global memory, shared memory, local memory, register, and bank conflict, not simply the thread symmetrical to many-core GPU.
Footnotes
Conflict of Interests
The authors declare that there is no conflict of interests regarding the publication of this paper.
Acknowledgments
This research was supported by the MSIP (Ministry of Science, ICT and Future Planning), Republic of Korea, under the ITRC (Information Technology Research Center) support program (NIPA-2014-H0301-14-1021) supervised by the NIPA (National IT Industry Promotion Agency).