
Abstract
A portable human body joint power test system was developed using inertial sensor technology and wireless Bluetooth acquisition technology. A detailed description of the internal structure of the system and the data processing method involved is provided. The test system uses the cubic spline interpolation method, which is very convenient for obtaining the maximum peak points of muscle isotonic contraction joint power curves under different loads. Moreover, the system is portable and can be deployed in the classroom and the playground for education and testing. The test system is very useful in many respects, such as athlete selection and daily strength training. We established a model of our subject using a balanced proportion scaling method in the inverse dynamics software AnyBody modeling system. The muscle model uses the Hill muscle model. The data import interface program was written in the parameterized model definition language AnyScript to import data. The raw data was smoothed with a Butterworth low-pass filter. Dumbbell curl simulation was conducted in AnyBody. The results of the simulation and those of the real test system were tested using the paired samples t-test method; the value of Sig was determined to be greater than 0.05, indicating no significant difference and that the data of the test system are valid.
1. Introduction
In sports technology, joint power is usually referred to as explosive power. In sports, the joint power or explosive power of the body is of great significance. For instance, at the start and in the process of sprinting, the acceleration achieved is determined by joint power; in throwing events, jumping events, weightlifting, boxing, and rugby, players are required to have large explosive power.
The problem is determining how to find the point where speed and power can cooperate to achieve the best sports performance, namely, the peak joint power point. The method with which this point is found can be used not only in education but also in athlete selection and many other areas such as daily strength training. Joint power can be derived from the muscle contraction tension-speed power curve. The typical method used to plot this curve involves using an isokinetic dynamometer. By setting the device to different speeds, we can determine the peak joint power and the corresponding joint speed and muscle torque.
However, isokinetic dynamometers are very expensive. Indeed, few domestic universities and colleges own such devices. Because the device is not portable, it cannot be used in the classroom or the playground. Isokinetic equipment can only perform isokinetic motion. In daily life or sports, however, our body usually performs isotonic motion to provide resistance against free loads. Different mode of motion will certainly affect test results in different ways. To obtain the peak joint power curve of isotonic motion conveniently, the portable isotonic contraction joint power curve test system was developed.
2. Test Principle and Method
Take the bicipital muscle of the arm in the dumbbell curl motion for example. The motion is fixed rotation, and the center is the elbow joint. The bicipital muscle and brachialis muscle contract isotonically to pull the forearm to complete this movement. In a typical isotonic contraction test, the hand will hold the dumbbell such that the two objects (hand and dumbbell) can be treated as one. O is the forearm rotation center (elbow joint),

Force analysis of bicipital muscle in dumbbell curl motion.
The isotonic muscle contraction power of the bicipital muscle and brachialis muscle is calculated as follows:

The total moment of the forearm is calculated by
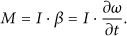
The moment can also be expressed as follows:

The resisting moment caused by the weight of the forearm is

The resisting moment caused by the weight of the arm is

The resisting moment caused by the weight of the dumbbell is

According to the Zatsiorsky model, the multiple regression equation of forearm weight

Male:

Male:

Male:

Male:
The joint power P of muscle contraction in elbow flexion can be derived from 1–10.
3. The Components of the Portable Human Body Joint Power Test System
The portable human body joint power test system mainly consists of an inertial tester, weight-adjustable dumbbell, and test software.
3.1. Hardware
The hardware mainly includes an attitude measurement system based on inertial sensors. The system can output an accurate attitude angle, 3D rotation angular velocity, and linear acceleration along three axes [1]. The internal structure of the system is mainly composed of inertial sensors, an ARM processor, and a Bluetooth wireless transmission unit (Figure 2).

Internal structure of the attitude measurement system based on inertial sensors.
3.1.1. Orientation Coordinate System
The 3D orientation output [2] is defined as the orientation between the body-fixed coordinate system, S, and the earth-fixed coordinate system, G, using the earth-fixed coordinate system, G, as the reference coordinate system. By default, the local earth-fixed reference coordinate system used is defined as a right handed Cartesian coordinate system (see Figure 3).
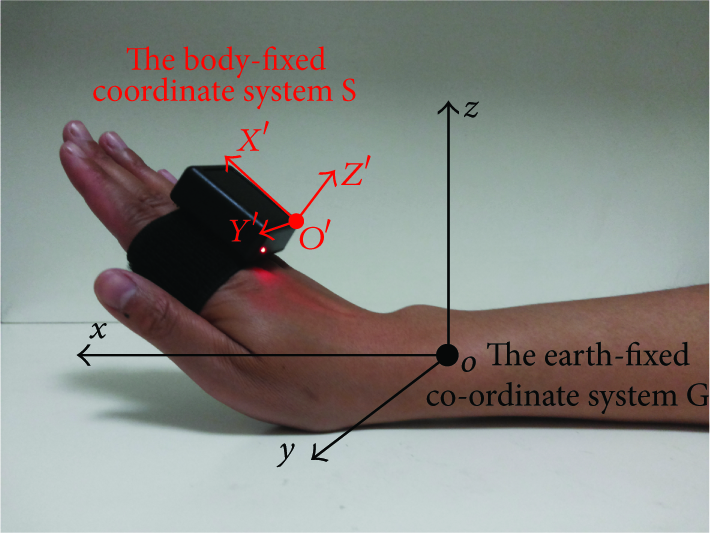
Orientation coordinate system.
3.1.2. Inertial Sensor
The inertial sensor consists of three orthogonally configured microgyroscopes, three microaccelerometers, and three micromagnetometers [3]. The devices are fixed to the motion coordinate system. The output is angular velocity, linear acceleration, and magnetic force relative to the inertial space along each axis of the motion coordinate system. The sampling frequency is 100 Hz, the range of angular velocity is ±1200°/s, and the range of linear velocity is ±16 g [4].
3.1.3. ARM Processor
To perform the massive numerical calculations required, the control unit uses a 32-bit SCM STM32F103 with an ARM Cortex-M3 processor for control, data acquisition and processing, communication, and other functions.
(a) Data Processing of Inertial Sensors. Linear acceleration data errors due to measurement differences in each axis can be reduced using a normalization method. The sensor positions are adjusted to obtain the maximum and minimum values on each axis. The maximum and minimum values on the

A least-squares linear fit is performed using the gyroscopes to modify the integral angle error and thus reduce the effect of drift.
Three-dimensional eight-trajectory calibration is executed by the magnetometer to determine the magnitude and direction of the interference vector in a fixed magnetic field. The sensor that needs to be calibrated is made to follow a figure-8 trajectory. The objective is to make the normal direction point to all eight quadrants in space. With a sufficient number of sample points, we can obtain the magnitude and direction of the interference vector:

(b) Data Fusion. Select with Kalman filtering, we can apply data fusion to the acquired data to more closely approximate the true values. Attitude data using quaternion form to avoid Gimbal lock:
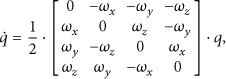


Euler angles.
(c) Data Format. The data navigational parameters are adapted to the required format [5]. A head and check bit are added to the data to avoid misreading during Bluetooth wireless transmission.
3.1.4. Bluetooth Wireless Transmission
The signal can be transmitted by a Bluetooth transmitting terminal and transmitted wirelessly to the Bluetooth receiving end, which is connected to a PC. Finally, the data contained in the signal can be used by the PC software for testing [6].
3.2. Software
The muscle isotonic contraction joint power curve test system software can be run in Windows. The software is written in VC++6.0 and contains three modules: a subject database, test interface, and result analysis interface [7].
3.2.1. Subject Database
The subject database manages the subject name, sex, age, height, weight, and other information and is convenient for adding, modifying, deleting, and searching such information.
3.2.2. Testing Interface
The testing interface involves load value,
3.2.3. Result Analysis Interface
The result analysis interface involves single longitudinal data analysis and multiple lateral data analysis. Values, 2D and 3D histograms, curve charts, pie charts, box plots, stacking charts, and scatter diagrams can be displayed. The analysis results can be printed out.
4. Experimental Teaching Test
The muscle isotonic contraction joint power curve testing system was put into teaching practice in the biomechanics class for undergraduate students at Beijing Normal University when it was completed. In the experiment, the class was divided into several groups; each group had three members: the first one operated the computer, the second one acted as the subject, and the third one acted as the assistant. The three took turns playing different roles so that everyone could be tested. The assistant helped to adjust the weight of the dumbbell and measure the distance L2 between the barycenter of the dumbbell and the elbow joint. The operator operated the software and input the subject information to the database; in the test interface, the operator input the load value and L2 and prepared the system for testing by clicking the start button. The subject leaned against the wall after a warm-up exercise, attached the attitude test system to the forearm by tying the bandage, and then held the 4 KG dumbbell with the right hand for the first time. The subject curled the dumbbell three times with maximum power (Figure 5). If the operator was satisfied with the test result, he or she would save it. Otherwise, the test would be repeated. A two-minute break was taken during each test. The weight of the dumbbell was increased in 1 kg or 1.5 kg increments. The experiment was repeated as described below, and the system would yield the isotonic contraction joint power curve for each subject under different load conditions. Due to the changes in the load, interpolation must be performed. A cubic spline interpolation method is used to ensure data continuity. The peak point of the interpolation power curve is the maximum joint power output value. The value and its corresponding loads, velocity, and other data are of great importance in training, selection, and many other respects (Figure 6).
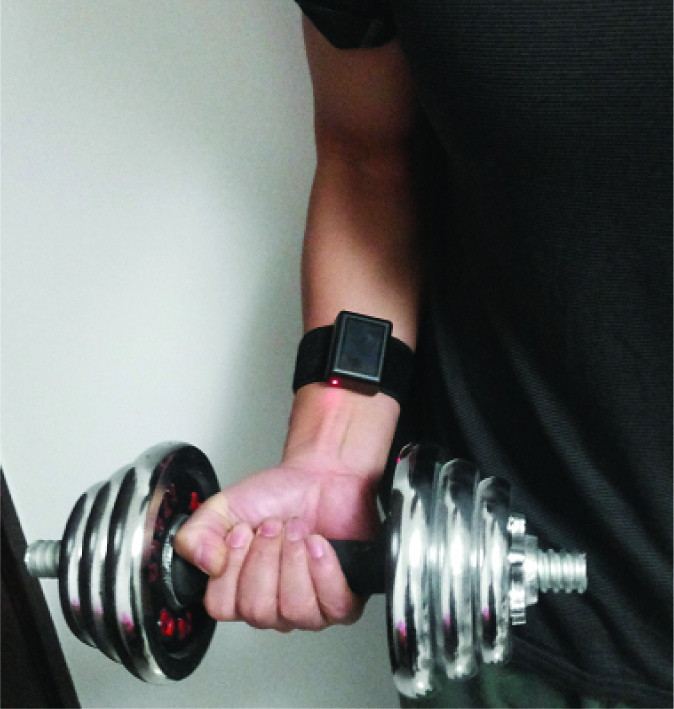
Experimental teaching test.

Test interface of the muscle isotonic contraction joint power curve test system software.
5. Inverse Dynamics Simulation in AnyBody
The AnyBody modeling system is an inverse dynamics analysis software for analyzing the musculoskeletal system [8]. The software was developed by a biomedical engineering research team at Aalborg University in Denmark. The software can be used to analyze the force state of muscles, tendons, and joints of the body when exercising under certain conditions [9].
5.1. Musculoskeletal System Modeling in AnyBody
To conduct a kinetic analysis of the dumbbell curl process, we must first establish the musculoskeletal system. Because the lower extremity and left upper extremity are fixed to the coordinate system and do not fall within the scope of our study, we only established the musculoskeletal system model of the trunk, head, neck, and right upper extremity [10]. Moreover, because the trunk, head, and neck are fixed, they only provide attachment points for the right upper extremity muscle [11]. Considering the computational time required by the simulation, only the right upper extremity muscle was added to the model. The muscle is a Hill-type muscle; the model is also called the triplet model because it consists of three elements: a contraction element (CE), which represents the activity performance of the muscle fibers; a series elastic element (T), which represents the elasticity of the tendon; and a parallel elastic element (PE), which represents the passive rigidity of the muscle fibers [12].
The model is scaled using uniform balanced scaling: the scale of the model is changed according to the weight, height, and joint distances of the body model. This scaling method scales the three axes in AnyBody by the same proportion, but the ScalingUniform.any and AnyMan.any files must be included in the main file during programming [13] (Figure 7).

Musculoskeletal model of human body.
5.2. Kinesiology Data Import and Filter
The parameterized model definition language in which AnyBody is written (AnyScript) is an object-oriented programming language similar to JavaScript and C++. It has good logical structure and features plain test editor [14]. The test data is organized in a nested structure and is saved as an “.any” file in accordance with the storage format of the language. The smoothing of the raw data is conducted with a Butterworth low-pass filter, and the cut-off frequency is 2 Hz [15].
5.3. Inverse Dynamics Analysis of Dumbbell Curl in AnyBody
Inverse dynamics indicates that the dynamics presentation of motion under the laws of mechanics is derived according to the movement of the objects of interest. In AnyBody, with an appropriate muscle biomechanical model, a dynamics presentation of the musculoskeletal system is obtained by inputting the appropriate kinematics parameters [16]. Muscle recruitment is performed in the form of minimum/maximum recruitment [17]. Peak values of joint power curve during the dumbbell curl motion can be achieved from inverse dynamics analysis in AnyBody and our test system. The values obtained in this study are shown in Table 1. The subjects are represented by the first letters of their names. In the experimental teaching test described above, eight males were selected randomly from the biomechanics class.
Comparison of peak values (in watts) of joint power curve during dumbbell curl motion obtained from AnyBody and our test system.
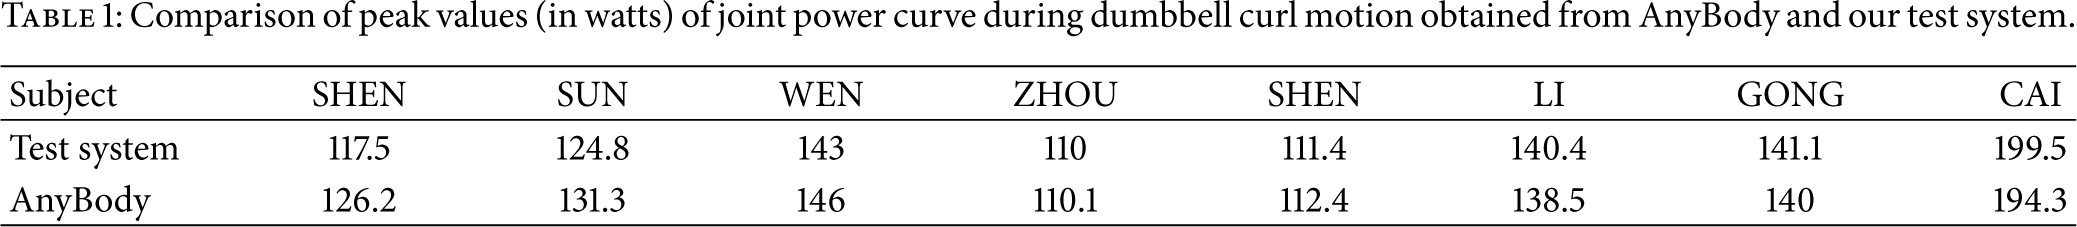
The two groups of data were tested for normality using SPSS. Finally, the two groups of data were analyzed by the paired sample t-test method. The test results are shown in Table 2. The row PowerAnyBody provides the data obtained from AnyBody, and the row PowerSys provides the data obtained from our test system. According to Table 2, the value of Sig is greater than 0.05, so the two groups of data show no significant difference.
Paired samples test results.

6. Conclusions
In this study, a portable human body joint power test system was developed. The system can determine the maximum peak points of the joint power curve under different loads. The system can be taken to the classroom and the playground for teaching and testing because it is portable. The device can be deployed for athlete selection, daily exercise, and many other important applications. Muscle isotonic contraction joint power curve test system can be used in elbow joint power curve testing. In future studies, the system can be used to test other joints. By comparing the dumbbell curl inverse dynamics analysis data obtained from the joint power curve test system with that obtained from AnyBody, the test system was proved to be valid.
Footnotes
Conflict of Interests
The authors declare that there is no conflict of interests regarding the publication of this paper.
Acknowledgments
This work was funded by the Ministry of Education of Humanities and Social Science Project (11YJA88003), Beijing Normal University Teaching Construction and Reform Project (12-01-13).