
Abstract
Prediction of aerosol optical thickness (AOT) is important to study worldwide climate changes. Researchers have built multiple AOT prediction models. However, few researches were focused on the validation of input attributes for AOT regression. In this paper, we proposed a support vector regression (SVR) model-based sensitivity analysis approach to order 35 MODIS input attributes according to their sensitivity to prediction outputs. Next, the attribute sensitivity orders are used for feature selection in the context of regression by removing insensitive attribute one at a time or by removing attributes whose sensitive orders are larger than number k. The experimental results based on the collocated data between MODIS and AERONET from 2009 to 2011 showed that the top 10 insensitive attributes can be screened to speed up prediction model computation with very little loss of accuracy. The results also suggested that the top sensitive attributes are the most informative attributes, requiring the highest precision for accurate AOT prediction. Thereby, our approach will be valuable for remote sensing scientists or atmospheric scientists to optimize the design precision of top sensitive attributes in scanning equipment like MODIS and therefore improve AOT retrieval accuracy.
1. Introduction
Aerosols are small solid or liquid particles produced by natural or man-made sources. The research on atmospheric aerosols is very useful to reveal the mechanism of the earth's solar radiation budget, water cycle balance, and climate change dynamics [1, 2]. Aerosol optical thickness (AOT) is one of the most important aerosol properties. AOT has been computed both by ground-based and satellite-based methods for years and many aerosol retrieval theories and algorithms were proposed. Although ground-based measurements, such as AERONET (Aerosol Robotic Network), turn out to be effective and have high accuracy in AOT retrievals, they require great cost correspondingly and are conditioned to a small amount of sporadic land observation sites. Satellite-based measurements based on domain model, such as MODIS (Moderate Resolution Imaging Spectroradiometer), have global coverage with low costs. But they have no enough accuracy due to the complexity nature of chemical or physical processes affecting aerosols.
Thereby, in recent years, scientists worldwide proposed several data-driven retrieval approaches or machine learning methods for AOT prediction and validation [3–13]. In these approaches, satellite-based measurements generally are used as input attributes and corresponding ground-based measurements are used as AOT validation outputs. They are combined together to build a supervised global AOT prediction model.
However, few researches were focused on the validation of input attributes, or, say, feature selection, for regression models. Although feature selection has been studied in classification tasks [14–17], few works have been implemented in regress tasks. To some degree, too many input attributes could be redundant or noisy for accurate model prediction. Particularly, for some types of data, such as images, multiple feature extraction approaches can be applied to obtain many features [18, 19]. But only parts of them are informative for regression models. Thereby, it is very useful to study feature selection problem in the context of regression.
In this paper, we proposed a novel model-based sensitivity analysis approach for feature selection in AOT regression. The approach combines support vector regression (SVR) model with sensitivity analysis (SA) method together to validate the usefulness of model input attributes. SA is a useful tool to ascertain how the output of a given model depends on its input attributes. It has been developed in a growing number of fields, such as domain modeling in hydrology, ecosystem, structure engineering, and so forth, where computational models are used to simulate the real world [20–26]. SA helps the modeler to understand the model better, especially when the model is complex and unknown correlations exist among input attributes.
Our approach consists of three steps. Firstly, we build an optimized support vector regression (SVR) model to predict AOT. This is because SVR model has been demonstrated to achieve better prediction accuracy than other effective machine learning approaches for AOT prediction [3]. Next, we propose a model-based sensitivity analysis approach to order the input attributes by their sensitivity effects to the prediction model outputs. Further, we compare prediction accuracy of model with full inputs to those of models by removing insensitive attribute one at a time or by removing attributes whose sensitive orders are larger than a number k. The experimental results based on the collocated data between MODIS and AERONET from 2009 to 2011 show that the top 10 insensitive attributes can be screened to speed up prediction model computation with very little loss of accuracy. The results also suggested that the top sensitive attributes are the most informative attributes, requiring the highest precision for accurate AOT prediction. Thereby, our model-based sensitivity analysis method will be valuable for remote sensing scientists or atmospheric scientists to optimize the design precision of top sensitive attributes in scanning equipment like MODIS and therefore improve AOT retrieval accuracy.
The contribution of this paper is two sides. On one side, feature selection is normally studied in data classification task and few researchers study the problem in the context of regression prediction. In this paper, we proposed a novel model-based sensitivity analysis method for this purpose. On the other side, experimental results show that our method not only can refine the inputs to AOT prediction model, but also provide valuable insights for remote sensing scientists or atmospheric scientists to optimize the observation equipment design and therefore improve their geophysical parameter retrieval algorithm.
2. Related Work
In recent years, several data-driven retrieval approaches or machine learning methods were proposed for AOT prediction and validation [3–13]. Radosavljevic et al. used MODIS radiance observations as inputs and predicted AERONET AOT by neural networks [4]. Further, they applied five measures to evaluate the AOT retrieval accuracy [5]. Both experimental results showed that the proposed ensemble of neural networks was significantly more accurate than domain-based AOT retrievals for all measures. To make models more accurate, Radosavljevic et al. proposed that the predictors should be customized according to different spatiotemporal partitions [6]. They also explored to reduce AERONET sites and select only most informative neighborhood sites to improve accuracy [7]. Based on the research by Radosavljevic et al., Ristovski et al. proposed a bootstrap technique for regression and uncertainty estimation [8]. Das et al. argued that AOT predictor could be enhanced by combining active learning method with neural networks [9]. Han et al. applied a statistic approach to predict AOT as a complement to the domain algorithm [10]. In their research, two statistic approaches, spatial interpolation and neural network predictors, were explored. The results showed that statistic approach could serve as a useful complement to traditional deterministic methods with reduced computational efforts. Albayrak et al. used a neural network algorithm with one hidden layer to build a global bias adjustment model to improve MODIS AOT retrieval accuracy [11]. Besides of neural networks methods, support vector regression (SVR) was used for AOT prediction by Nguyen et al. [12]. They used instance data set and aggregate data set, respectively, to build two SVR models for AOT predictions and they achieved more accurate results than neural network predictions. In addition, Djuric et al. proposed a semisupervised approach to integrate AOD estimations from multiple satellite sensors together and make more accurate estimations [13]. However, all aforementioned related work did not use data-driven approach to validate the input attributes and check if the inputs really make significant contributions for AOT regression models.
3. Method
In this section, we will explain the proposed model-based sensitivity analysis approach for feature selection in AOT regression. The approach consists of three steps, building a SVR prediction model, SVR model-based sensitivity analysis, and feature selection for regression. The processing steps are illustrated in Figure 1. We will explain each step in detail as follows.

Processing flow.
3.1. Prediction Model: SVR
SVR is a machine learning method to do regression prediction. It was built on the basis of the Vapnik-Chervonenkis dimension theory and structure risk minimization principle in statistical learning. SVR maps model's input attributes from lower nonlinear dimensions to higher dimensional feature space and tries to find the best regression hyperplane. The most commonly used SVR model is epsilon-SVR.
Suppose the training dataset is composed of points

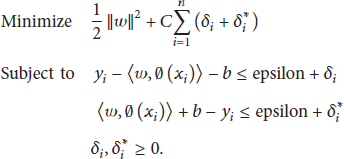
For the function f to be epsilon-insensitive and also as flat as possible, we have the objective function and constraints for SVR as follows:
By introducing the Lagrangian and performing optimization, we can have the regression hyperplane in the following dual representation:
Here,
There are four major types of kernel functions, linear kernel, polynomial kernel, radial basis function kernel, and sigmoid kernel. In this study, we use epsilon-SVR with radial basis function kernel provided by libsvm [27] for AOT prediction. Formula (4) shows Gaussian Kernel, one of the radial basis function kernel used by libsvm:

3.2. Model-Based Sensitivity Analysis
To apply feature selection, we firstly need to order attributes according to their contribution to the regression model, such that the most informative attributes are in the top and the noisy or useless attributes are in the bottom. In this paper, we combine SVR regression model with SA method together to propose a model-based sensitivity analysis approach for deciding the attribute order.
SA is a powerful method widely used in studying the uncertainty of model inputs. It orders input attributes by their degree influencing the model outputs. The most sensitive attributes with the biggest impact to outputs are ranked in the top. And the insensitive attributes with no or very little impact on outputs are ranked in the bottom.
In our approach, by using the kernel function showed in formula (4), we build the epsilon-SVR regression model.
As we explain before,

The larger the
3.3. Feature Selection by Filtering out Insensitive Attributes
After we obtained the sensitivity order of input attributes to regression outputs, we can apply feature selection by filtering out insensitive attributes.
We have designed two types of feature selection. One is the univariate filtering out. In this case, according to the reversed sensitivity order, we will remove an insensitive attribute from inputs to the SVR regression model one at a time. By experiments, we can pragmatically point out which attribute can be filtered out from inputs with no or little loss of regression accuracy or even improving accuracy. The other type of feature selection is multivariate filtering out. We will leave out attributes whose sensitivity orders are larger than number k. k is optimized by experiments. The SVR regression model with the remaining attributes will achieve similar accuracy as the model with full attributes.
3.4. Measurements of Prediction Accuracy
Our sensitivity analysis is built based on the SVR regression model. Each input attributes are evaluated by their sensitivity degree to impact the SVR prediction accuracy. For fully judge of the impact, we select multiple widely used regression accuracy measures in AOT retrievals.
The most simple and plain measurements are mean square error (MSE):

Another most commonly used measure is coefficient of determination (

Here,
Correlation coefficient (CORR) is the indicator of the degree of correlation between truth and prediction variables; it is often used to measure the regression accuracy and defined as

According to domain scientists, there are inherent measurement errors in MODIS AOT retrievals [2]. The expected boundary is defined as

Based on this boundary, two domain specific measurements of AOT retrieval accuracy, mean square relative error (MSRE) and fraction of successful prediction (FRAC), were proposed in [4]. We also use these two measurements to evaluate our model.
MSRE is defined as
The closer it is to 0, the more accurate the AOT predictor is.
FRAC is defined as

4. Experimental Results
4.1. Data Set
Like many previous studies, we use AERONET retrievals as ground-truth for validation of our prediction outputs. We randomly picked 24 AERONET sites among 40 whose longitude is between 70°E and 140°E and latitude between 20°N and 50°N (shown in Figure 2). And their level 2.0 cloud-screened and quality-assured AERONET data from 2009 to 2011 were collected. Since AERONET does not provide AOT retrievals at wavelength of 550 nm, we interpolated it with its measurements at 440 nm and 675 nm by the following equation:

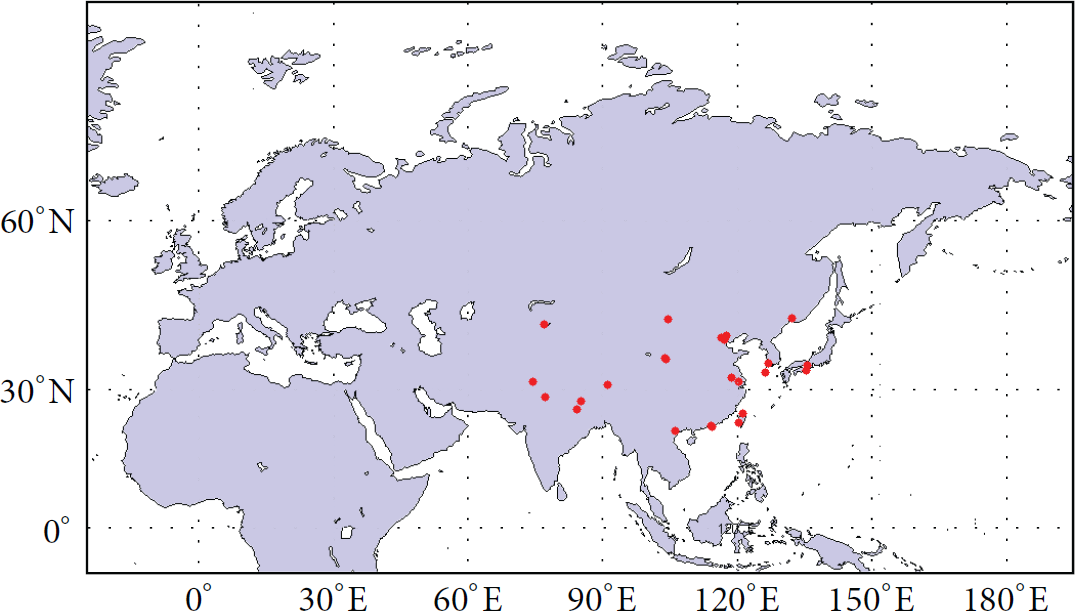
AERONET sites used in the experiment.
As for MODIS, we choose three aerosol related products from MODIS instrument aboard on TERRA. They are MOD02SSH level 1B radiance data with spatial resolution of 5 km, MOD04 level 2 aerosol retrievals, and MOD35 level 2 cloud mask product with resolution of 1 km. To collocate MODIS data with AERONET data spatially, we apply a region box of ±0.15 degree in latitude and longitude around the corresponding AERONET site when considering MODIS data. MODIS information in the region box is synchronized with the temporal mean values of the AERONET AOT observations taken within ±30 minutes of MODIS overpass. In this way, we derived 35 attributes from MODIS products, represented as
35 attributes derived from three MODIS products.

For each piece of MODIS data, it was taken into account only when MODIS data within the region described above contains at least one noncloud pixel and at least one AERONET AOT retrieval is available within the time range of ±30 minutes around MODIS overpass. In total, we obtain 1080 spatially and temporally collocated data samples.
4.2. SVR Model Optimization
To build a SVR predict model, we use the tool libsvm [27]. It is an efficient and widely used SVM tool package. It can be applied to many classification and regression problems and provides four types of common kernel functions. We first format the experiment data into following form:

The AERONET AOT retrieval result was labeled as
Then we normalize the input attributes of formatted samples. All attribute values were normalized into the range
In order to gain an optimal model, parameters of each SVR model are optimized by using grid-search provided by libsvm. We choose epsilon-SVR and radial basis kernel function. The optimized parameters are c, g, and p, representing cost in epsilon-SVR, gamma in kernel function, and epsilon in loss function of epsilon-SVR, respectively. Other parameters are set to the default values.
First, the searching ranges of the three parameters were all set to [
Results of SVR model parameter optimization.

4.3. Sensitivity Analysis Experiments
To explore the impact of each input attribute on model prediction output, we change the value of each attribute with a small offset one at a time and then calculate the prediction output difference as described in (5).
By sorting
Sensitivity order of attributes by 1000 times of experiments.
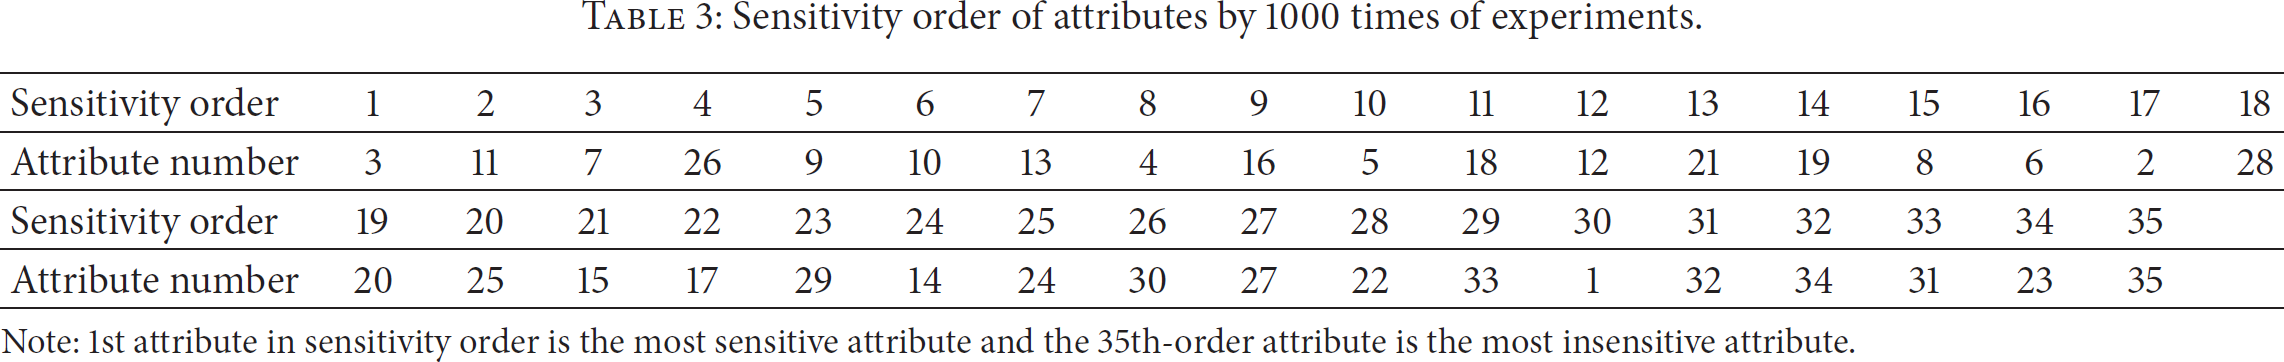
Note: 1st attribute in sensitivity order is the most sensitive attribute and the 35th-order attribute is the most insensitive attribute.
To further validate the sensitivity order of 35 attributes, we repeat experiments by changing parameters from three perspectives: the repeating number of independent experiments, the value of Δ, and the model parameter setting.
For the first aspect, we simply repeat the experiments for 2000 times. For the second aspect, we try
By analyzing the experimental results, we find that the sorting order of attributes in the sensitive group and insensitive group is stable through all experiments by various conditions in the three aspects. The rest medium-sensitive group shows no fixed pattern. But it is rare that attributes in one group moved to another group when condition changed.
These experimental results proved that the sensitivity orders of attributes reported in Table 3 keep stable in various conditions.
4.4. Feature Selection Evaluation
In this step, we aim at exploring feature selection by using the obtained sensitivity order results. We implement two groups of experiments. In the first group, we remove an attribute from inputs to the model one at a time in the reversed sensitivity order. In the second group, we remove all input attributes whose sensitivity orders are larger than number k. In both groups, attributes are removed in reversed sensitivity order as reported in Table 3. That is, in the first group, we rotationally remove the 35th, 23rd, 31st, …, until 3rd attribute. In the second group of experiments, we will firstly model regression by leaving out 35th attribute, then model regression by leaving out 35th and 23rd attributes, next model regression by leaving out 35th, 23rd, and 31st attributes, …, and so forth. When every time we remove an attribute or multiple attributes with sensitivity order larger than k, the model training process was reoptimized and prediction test process was redone. We use the five measures,
The changes of the above five measures as we remove one attribute from inputs to the model in the first group of feature selection experiments are shown in Figure 3. From Figure 3, we can see that roughly the five measures changes little when we remove any of the top 25 insensitive and medium-sensitive attributes. In such conditions, models with one less attributes achieve accuracy around
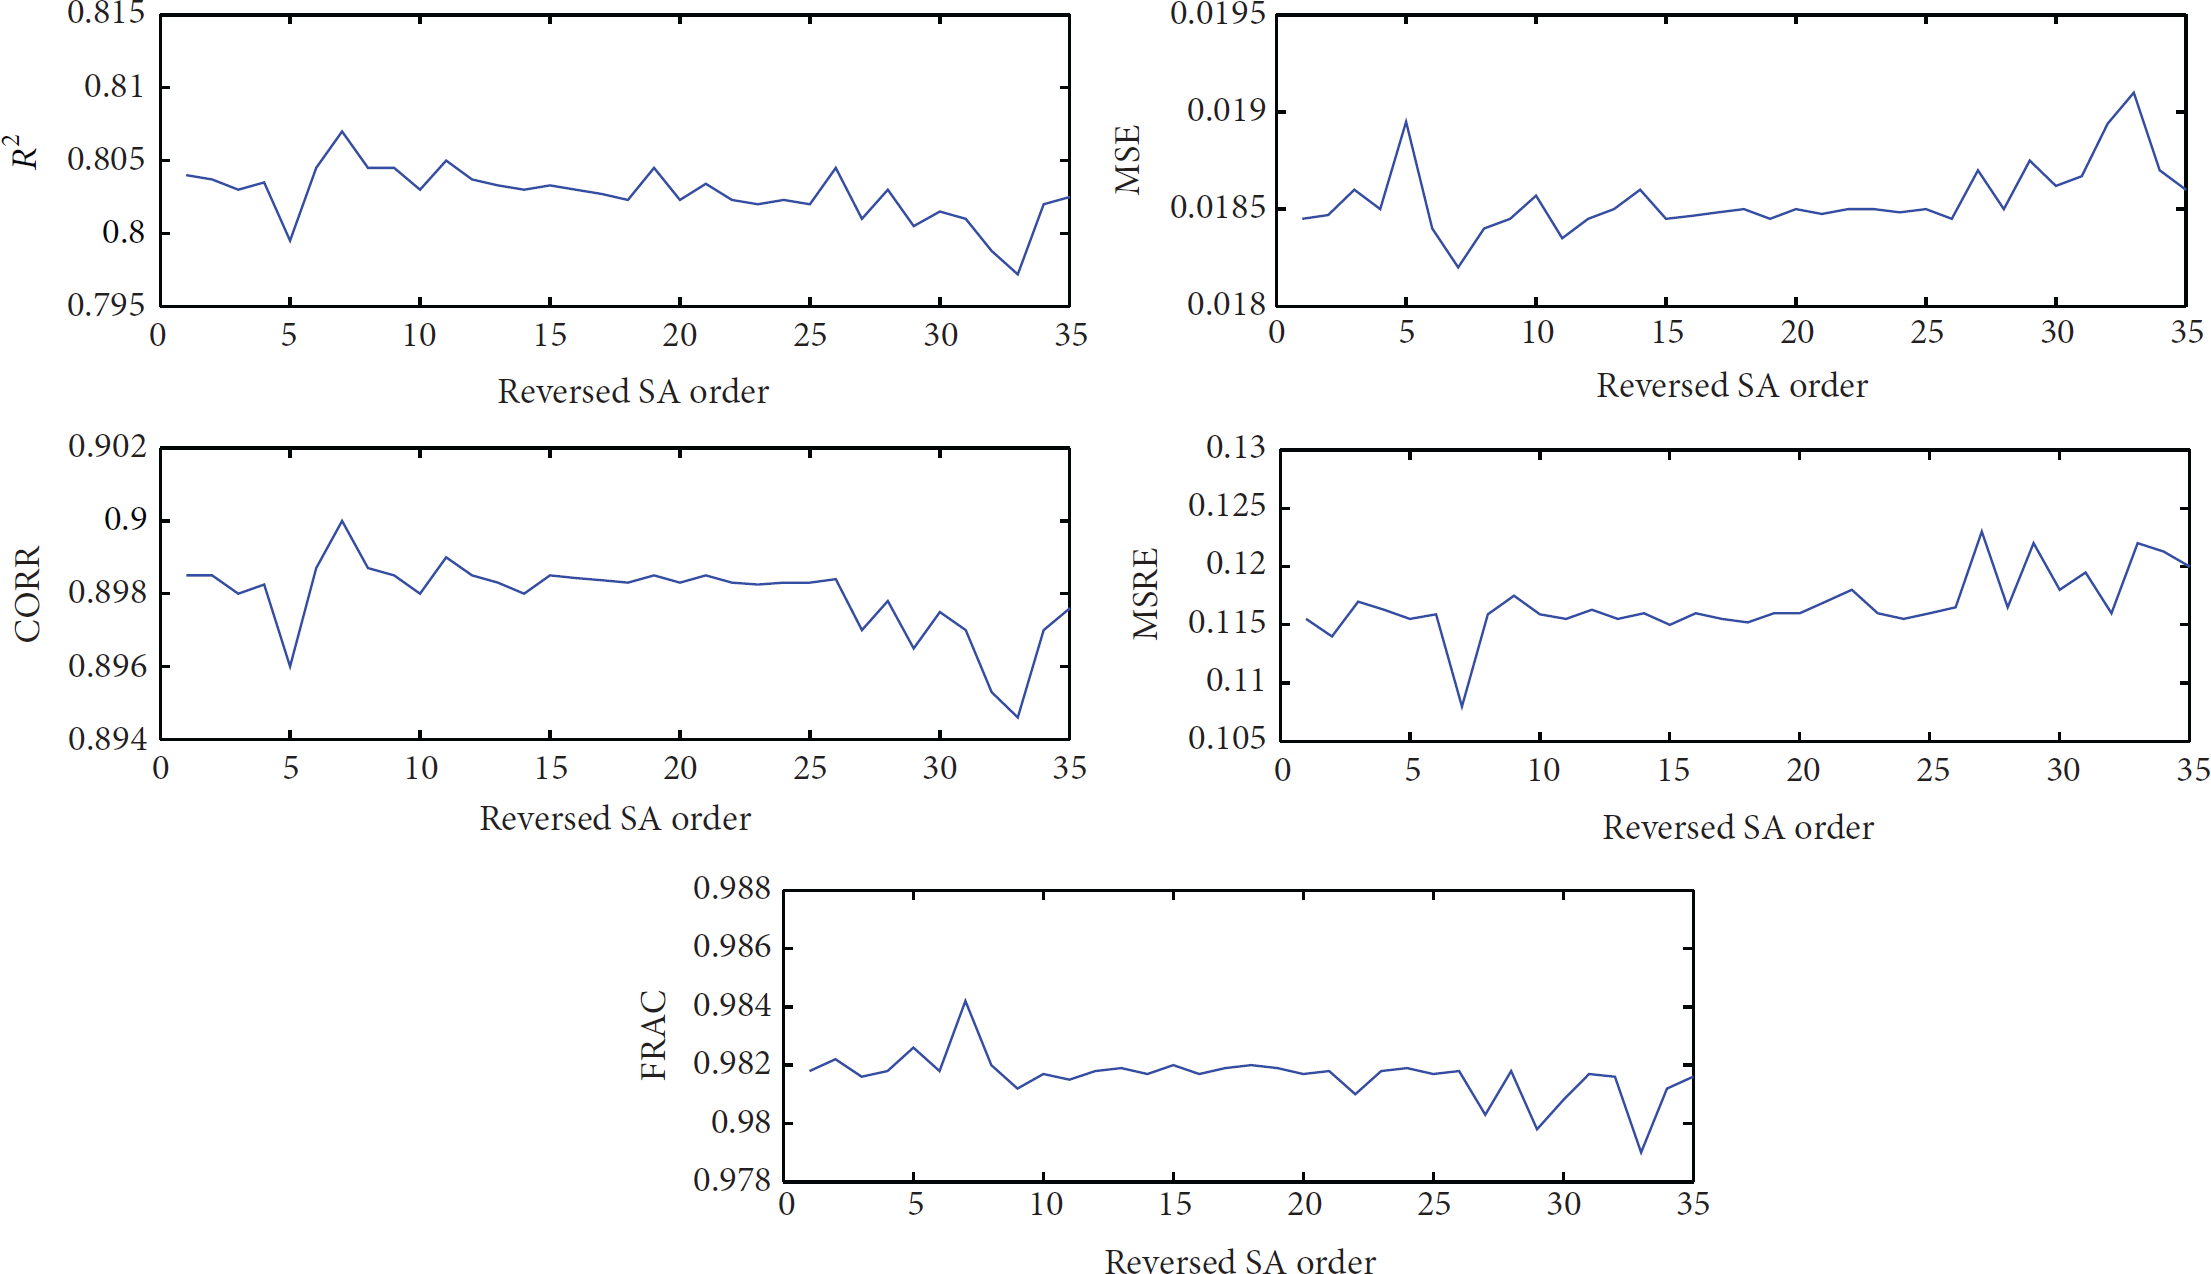
Changes of R-square, MSE, CORR, MSRE, and FRAC when we remove an attribute in sensitivity order one at a time.
In particular, Figure 3 shows that the 3rd sensitive order attribute; that is, attribute 7, the average MODIS radiances over cloud-free pixels at wavelength 0.55
The exception insensitive attributes are in the order at 5 and 7. The 5th insensitive attribute is
In this way, by implementing experiments practically, we found that sensitive attributes affect the prediction accuracy greatly while other insensitivities are not. In addition, we observe that there are some correlations among the input attributes, affecting the SVR model prediction accuracy. So if a sensitive attribute was left out, but the information it contains can be covered by other remaining attributes, then the prediction accuracy will not change much. This phenomenon can partially explain the reason why removing any attribute in the range of reversed sensitivity order 10–25 has little impact to regression accuracy.
The changes of the five measures as we remove all input attributes whose sensitivity orders are larger than a number k are shown in Figure 4. From Figure 4, we see that the five measures did not change much (

Changes of R-square, MSE, CORR, MSRE, and FRAC when removing all input attributes whose sensitivity orders are less than k.
5. Conclusions
In this paper, we proposed a SVR model-based sensitivity analysis approach for feature selection in the context of AOT regression. Specifically, we firstly use our method to order 35 input MODIS attributes according to their sensitivity to prediction outputs. Next, the attribute sensitivity orders are used to carry out feature selection by removing insensitive attribute one at a time or by removing attributes whose sensitive orders are larger than number k. The experimental results of regression based on the collocated data between MODIS and AERONET from 2009 and 2011 showed that the top 10 insensitive attributes can be screened to speed up prediction model computation with very little loss of accuracy. The results also suggested that the top sensitive attributes are helpful to identify the most informative attributes as well as the attributes requiring the highest precision for AOT prediction. Thereby, our approach will be valuable for remote sensing scientists or atmospheric scientists to optimize the design precision for some observation attributes in scanning equipment, like MODIS, and further improve AOT retrieval accuracy.
6. Future Work
Next, we will experimentally combine sensitivity analysis with other data mining models, such as neural networks and decision trees, to test their model-based sensitivity analysis ability.
In addition, we will apply the proposed model-based sensitivity analysis method to other satellite sensors in A-train satellite constellation and analyze their informative observing attributes for AOT regression. Then we aim to fuse these selected attributes from multiple sensors together for further improving AOT regression accuracy.
Our future work also includes extending our proposed method in big data cases in the internet of things or astronomy context [28–30]. In these cases, we will collect information from multiple sources with different scale of uncertainty. For example, for estimating astronomy photometric redshift, we need to combine multibands together from multiple sky surveys, such as SDSS, UKIDSS, and WISE. It is useful to first apply our model-based sensitivity analysis approach to pick out those attributes which make significant contributions for the regression model before information fusion from multiple sources.
Footnotes
Conflict of Interests
The authors declare that there is no conflict of interests regarding the publication of this paper.
Acknowledgments
This work was supported in part by the National Natural Science Foundation of China under Grants 61272272 and 61440054. The authors also would like to thank the NASA scientists for providing MODIS and AERONET data.