
Abstract
Sensing coverage, which is one of vital issues in the design of wireless sensor networks (WSNs), can usually interact with other performance metrics such as network connectivity and energy consumption. Whatever the metrics, the fundamental problem is to know at least how many sensor nodes are needed to maintain both sensing coverage and network connectivity. In this paper, we propose a Percolation Model on Novel Gilbert Graph (PM-NGG) to obtain the critical density at which the network can become fully covered and connected considering the similarity between the occurrence of percolation and the formation of a covered and connected network. The PM-NGG is based on directional sensor network where sensors are assigned a determined sensing direction with angular intervals varying from 0 to 2π. Furthermore, we define the sensing and communication model in directional sensor network in presence of channel randomness including deterministic path attenuation, shadow fading, and multipath fading. Besides, we discuss the coverage and connectivity together as a whole under the proposed model. It is worth mentioning that the theoretical analysis and simulation results of the relationship between critical density and transmitting power give insights into the design of directional sensor network in practice.
1. Introduction
The collaborative and low-cost nature of wireless sensor networks (WSNs) has inspired immense amounts of concrete researches on it. Over the years, WSNs have been widely considered to be a promising technology and were applied to diverse fields including environment monitoring, battlefield surveillance, intrusion detection, and wildlife habitat monitoring [1]. It is worth noting that sensors in WSNs usually have tight resource constraints in terms of limited computing, communication and memory capability, and limited energy among which energy is always a paramount apprehension for the strict energy limitation of sensors and the inconvenience of replacing the batteries, especially in some hostile environments. Therefore, extensive attempts have focused on reducing energy consumption and sleep scheduling is an effective and promising one among them. The nature of sleep scheduling is to keep a minimum number of active sensors to reduce the energy consumption caused by idle listening. An energy efficient sleep scheduling scheme involves a series of procedures and the foremost step is to determine the optimal density of active nodes that needed to achieve the required QoS. In WSNs, sensing coverage and connectivity can be regarded together as a measure of the QoS. Coverage answers how well each point in the sensing field is covered by the sensor nodes, while connectivity measures how well each pair of active nodes in the network is connected. A perfect design should realize node energy consumption and the communication overhead minimization, highly reliable coverage level, and global network connection at the same time. But the low power consumption naturally contradicts high quality of coverage and connectivity especially in adverse communication circumstances which resulted from channel noises, obstacles, and multipath fading. A lot of researches have exploited this issue [2]. Gandelli et al. investigated the possibility of integrating antenna technologies for conserving energy in large distributed wireless sensor networks [3]. The authors in [4, 5] investigated the effectiveness of evolutionary algorithms to maximize the system performances and the network lifespan. Nevertheless, most of these works are limited to omnidirectional sensors. Furthermore, they usually adopt the simple disk sensing model which fails to capture the actual channel characteristics.
In this paper we propose a PM-NGG model in which the critical conditions of directional sensor node with aligned orientation range
The remainder of this paper is organized as follows: Section 2 presents related work and details the contributions of the paper. Section 3 describes the related model and some terminologies. The PM-NGG model is presented in Section 4. Section 5 discusses the numerical results. Finally, Section 6 concludes the paper.
2. Related Work
In this section, we present some related work and list the contributions of this paper.
2.1. Coverage and Connectivity in WSNs
Due to the significance of coverage and connectivity in WSN as noted above, plenty of researches have been done. In [6], Meguerdichian et al. studied the optimal number of sensors that needed to provide a satisfied coverage with each node having a fixed coverage radius. In [7] Gupta and Kumar derived the critical power a node needed to have to ensure a high coverage probability with a constant number of sensor nodes; Gupta et al. in [8] focused on the problem of determining the minimum number of sensors that should be randomly deployed in the object area such that the monitoring area can be effectively covered. Apart from the above works, similar studies also include [9–11]. The researches above are mainly concentrated on coverage sensing; however, it is connectivity that determines the effectiveness of coverage. As far as we know, Xing et al. in [12] first proved a sufficient condition to ensure a fully network connectivity for 1-coverage networks, that is, in WSNs, if a region is completely covered, then the region is connected under the condition that
Apart from the research issues, the studies aforementioned are all focused on omnidirectional sensors and seldom consider the random channel condition adequately. Directional sensor nodes differ from traditional omnidirectional sensors in their unique characteristics, such as sensing model and communication model, due to the fact that they usually have a finite angle of view and thus cannot sense the whole circular area. Ma and Liu firstly presented the concept of directional sensor network and discussed how to solve the connectivity problem for randomly deployed sensors [15]. Other researches concerning directional sensors include Sung and Yang [16] and Yu et al. [17]. Reference [18] is one of the earliest studies on the impact of fading channel upon wireless network which shed light on the research of WSNs. Besides, Elsawy and Hossain only take multipath fading and multipath effect into consideration [19]. Yip and Ng in [20] proposed a mathematical model for simulating a Nakagami-m (
2.2. Continuum Percolation and Coverage and Connectivity
Percolation theory was first proposed by Broadbent and Hammersley [21] in 1957 and it is used to describe various physical phenomena, such as Mott transition in extrinsic semiconductor, spread of fluid or gas through a random medium, and the propagation of a fire though a forest. Scher and Zallen first proposed the concept of critical probability for percolation and gave the critical percolation densities in two and three dimensions in [22] and their work starts the research of critical conditions for percolation. This finding has been expanded to many applications [23–25] and continuum percolation model has become a hot research issue to address the coverage and connectivity in WSNs. Gilbert investigated the probability of whether there exists a connected component containing n nodes but without obtaining an exact value [26]. Philips et al. [27] developed the work of Gilbert by providing a tighter bound of the critical value. Ammari and Das [24] mapping the coverage and connectivity problems into a phase transition problems (SCTP and NCTP) by using percolation and they obtained the critical density at which an infinite covered or connected component could form for the first time. In [28], Khanjary et al. dealt with the SCTP and NCTP problems of aligned-orientation sensors which can be seen as a development of [24]. All the researches above are of guiding significance for our research.
2.3. Approach and Contributions
In this work, we propose a Percolation Model on Novel Gilbert Graph (PM-NGG) for calculating the critical density for coverage and connectivity of directional sensor network under fading channel conditions. Compared with the existing researches, the contributions of this paper are mainly embodied in the following:
Our model is especially for directional sensor networks and it considers the randomness of both the deployment of sensors and the channel conditions. Besides, with our definition of the sensing and communication model of directional sensors under channels in presence of path loss and shadowing fading as well as Rayleigh fading, we obtain an equivalent sensing and communication radius which is more close to the real channel conditions compared with previous works [29–31]. The model we propose incorporates the “dimensional invariants” theory in percolation which is a relatively new point of view. Additionally, simulation results show that the critical exponents obtained under our model are close to the value found in previous studies [32–34] or by Monte Carlo simulations [35] and validate our model. The angle of view of the directional sensors considered in this paper varies in This work has instructive significance in practical projects; that is, apart from the critical density, we also reveal the relationship between the critical radius (or transmitting power, equivalently) and the percolation of the network; therefore, we can adjust the transmitting power level to meet the percolation condition such that the network is connected while being maintained at a relatively low energy consumption level.
3. Models and Terminology
In this section we describe first the scenarios to be considered in this paper; we define the sensing model of directional sensor under random channel conditions. Then, we obtained the equivalent sensing radius in the presence of deterministic path loss, shadowing fading, and Rayleigh fading. We proceed then with a brief introduction to the percolation theory.
3.1. System Model
Let us consider a domain
Definition 1 (sensing model of directional sensor).
We define the sensing range of a directional sensor

Unlike omnidirectional sensor, the sensing area of the directional sensor has a finite angle of view instead of a whole circle area. We abstract the sensing region of the directional sensor as a sector in a two-dimension plane. Taking into account that our model is based on random channel conditions, the sensing ability of sensor varies in all predetermined angular range and thus the radius of the sector is no longer uniform as shown in Figure 1. Please note that, throughout the rest of paper, without causing ambiguity,

Sensing model of directional sensor.
Definition 2 (communication model of directional sensor).
We define the communication model of the directional sensor by


Communication model of directional sensor.
To make the problem tractable and derive a general expression, we use the equivalent sensing radius to substitute the random one in Definition 1. The next section gives the equivalent sensing radius in presence of deterministic path loss, shadowing fading, and Rayleigh fading.
3.2. Equivalent Sensing Radius in Presence of Deterministic Path Loss, Shadowing Fading, and Rayleigh Fading
Generally, the sensing characteristics of sensors are described by the propagation model of signals which are determined by the conditions of radio channel. Considering the complexity of the wireless channel, any applicable channel models are just simplified mathematic models of the real-world wireless communications and none of them can capture the exact nature of the real channel. However, given specific scenarios, some models will be more suitable. In our paper, we build a channel model where the signals' deterministic path attenuation, shadow fading, and multipath fading are all considered which is considered to be a better choice for WSN.
Lemma 3.
In the scenarios where deterministic path attenuation, shadow fading, and multipath fading exist simultaneously, the equivalent sensing radius is given by
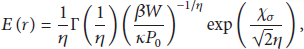
Proof.
In order to obtain the equivalent sensing radius in the aforementioned channel conditions, we start from a relatively simple one which only considers the deterministic path loss and shadowing fading and then extended the result to the scenarios defined in the model.
The received signal power at a sensor can be expressed by


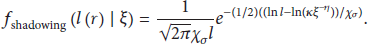
Let us take the shadowing effect into consideration; then, given the distance between a sensor and the target event (ξ), the path loss is a random variable related to ξ and the pdf of it is given by [18]


3.3. Continuum Percolation Theory
Percolation is a standard model for disordered systems which consists of a collection of points together with certain regions (called defects and in this paper referred to as sensing regions) surrounding them. Percolation occurs when the isolated defects with random shapes called components span over the entire network forming an infinite or “giant” connected component at the critical density defined by
Apart from the critical density

Definition 4 (excluded area and total excluded area).
The excluded area (indicated by
4. Critical Exponent under PM-NGG
This section defines the Percolation Model on Novel Gilbert Graph (PM-NGG) and, on this basis, we present methods to determine the critical exponent for coverage and connectivity issues in WSN.
4.1. Description of PM-NGG
The Novel Gilbert model is an improved version of Gilbert's disk model. According to the scenarios of this paper, the Novel Gilbert model is defined as follows.
Definition 5 (the Novel Gilbert's model).
Let

(a) The Novel Gilbert's model and connected component with a random radius. (b) The Novel Gilbert's model and connected component with equivalent radius.
Definition 6 (connected component).
A connected component is the maximal set of points such that, for any two points
To modeling the, we need to find
4.2. Excluded Area in PM-NGG
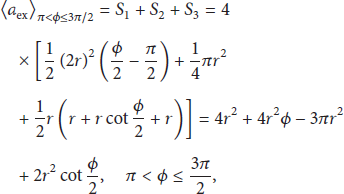
According to what is described herein before, the total excluded area

Excluded area for sectors with angle of view (a)
According to geometry, the excluded area can be easily derived by
(a) (b) (c) (d)


4.3. Critical Exponent
In this section we discuss under what conditions will percolation occur, including critical density
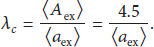
4.3.1. Critical Density for Coverage
According to the “dimensional invariants” theory and recent findings, the value of
Thus, by substituting

4.3.2. Critical Density for Connectivity
While sensing coverage requires all points in the network to be covered by at least one sensor, which is a property of all locations in the network, connectivity only requires all sensors to be within the communication range of an arbitrary sensor which is a property of only the location of the sensors. Intuitively, coverage requires a tougher condition than connectivity. As mentioned above, the network is guaranteed to be connected if the communication radius is at least twice the sensing radius. Apparently, these findings can be applied to directional sensor network. Now, we focus on analyzing the sufficient condition when
In our model, connectivity can be guaranteed as long as the maximum distance between two sensors


Thus far, percolation thresholds for coverage and connectivity are derived.
5. Simulation Results and Discussion
In this section, we present a selection of the most interesting results that can be obtained following our approach. We analyze the impacts of different channel conditions on the critical value of percolation as well as the relationship between percolation for coverage and connectivity. We consider a scenario in which sensors are placed according to a Poisson point process (PPP) with intensity λ. For the intuition of simulation analysis, we assume the simulation parameters are shown in Table 1. The simulation results are described below.
Simulation parameters.

5.1. Impact of Channel Conditions and Transmitting Power on the Coverage Radius
Before exploring the critical density for percolation, it is interesting to look at how the sensing radius depends on the transmitting power
In Figure 5, the sensing radius curves for different channel conditions varying with the transmitting power are compared, by which we can conclude that the analysis on the equivalent sensing radius in Section 3.2 precisely matches the simulation results. Three phenomena can be observed; that is, (1) sensing radius is an increasing function of the transmitting power which implies that we can adjust the sensing radius by changing the transmitting power, (2) the channel randomness induced by shadowing can enlarge the value of the equivalent sensing radius, while the multipath fading phenomenon can reduce it and the effect of the former is greater, and (3) the higher the SNR thread, the smaller the equivalent sensing radius. It is worth noting that the beneficial effect of shadowing on sensing radius is identical to the result derived in [33] and this intuitively surprising insight can be interpreted as follows: the fading effect on the obstacle direction can be compensated by its gain effect in some other direction without obstacle and the gain effect is greater than the fading effect. However, this effect only holds in theoretical analysis since in real real-world scenario a higher shadowing usually means a higher path loss and thus a smaller sensing radius.

Impact of SNR thread β on the sensing radius (for each color, the solid line, dotted line, and dashed line stand for
Figure 6 is an illustration of the impact of shadowing phenomenon on the sensing radius; moreover it is a supplementary certification of observation result (2) of Figure 1. As can be seen, the red, dashed line in the bottom represents the absence of shadowing and there is only one red line for it is unaffected by shadowing; looking at the blue line/green in isolation, we observe that, under same channel fading composition, the solid line (

Impact of shadowing phenomenon on the sensing radius (for each color, the solid line, dotted line, and dashed line stand for
5.2. Impact of Channel Conditions and Transmitting Power on the Coverage Radius
Considering the critical exponents for coverage and connectivity are based on the “dimensional invariants” theory, the excluded area
Figure 7 shows the value of excluded area when the angular interval is varied from

Comparison of excluded area for actual value and approximations.
5.3. Critical Exponents Analysis
The percolation threshold can be expressed as either the critical density
Figure 8 reveals how the critical values change with the angle of view. To facilitate theoretical analysis, we assume the sensing radius is 1 and the relationship between sensing radius and the critical value will be discussed below. The critical density

Critical exponents for different angle of view
Table 2 presents a comparison of the value of
Comparison of actual value and approximate value in [30].

Besides, the critical area fraction
At last, in Figure 9, we investigate the impact of the sensing radius on the critical exponents for percolation. As expected, larger values of sensing radius reduce the critical density necessary for percolation which means we can reduce the sensor density by increasing the sensing radius or by increasing the transmitting power equivalently. As shown in the graph, the lines representing the critical reduced density

Impact of sensing radius on the critical exponent.
6. Conclusion
In this paper, we investigated the critical density at which both sensing coverage and connectivity are achieved in directional sensor network. We defined the sensing and communication model of directional sensors with an angle of view
We first obtained the percolation conditions for coverage and then derived the percolation conditions for connectivity based on the relation analysis between coverage and connectivity. Instead of estimating the excluded area by hexagonal equivalence, we gave a method to calculate the actual value of the excluded area accurately. Simulation results verified that the deviation brought by approximation can influence the accuracy of the critical density and the critical exponents derived in our model are very close to the value obtained by Monte Carlo simulations. Besides, we also discussed the relationship between channel conditions, transmitting power, and the critical density which sheds lights on the design of practical directional wireless sensor networks.
Directions for future work include unaligned directional sensor networks where the sensing orientations of sensors are randomly distributed and the sensors are deployed according to a more general distribution.
Footnotes
Conflict of Interests
The authors declare that there is no conflict of interests regarding the publication of this paper.
Acknowledgments
The authors wish to show great appreciation for the support offered by the Research and Application of Key Technologies in Smart Grid Park Energy Management and optimization for Smart City and the National Natural Science Foundation of China (no. 61271186).