
Abstract
This paper uses the concept of effective transmission coverage area as a model for the derivation of analytic expressions in order to characterize the dynamic statistics of link lifetime, new link arrival rate, new link interarrival time, link breakage interarrival time, and so forth. Extensive simulations have been undertaken to verify the derived analytical expressions via generated mobility traces. Results demonstrate that the proposed analytical model can characterize the dynamic statistics well. Furthermore, the mathematical results of expected link life and expected new link arrival rate are provided to be used in analyzing the network connectivity. Combining with queueing theory, the upper bound connectivity of a VANET is obtained. This work thus provides a fundamental guideline on designing new mobility models, new routing protocols, and the corresponding performance analysis in VANET.
1. Introduction
VANET (Vehicular Ad Hoc Network) has emerged as a promising field of research and development, where advances in wireless and mobile ad hoc networks, global positioning systems, and sensor technologies can be collectively applied to vehicles and result in great market potential. It resembles MANET in its rapidly and dynamically changing network topologies due to the fast motion of vehicles. Vehicular communications are carried out by a set of wireless links between node pairs in multihop networks, where each node, except source and destination, behaves as a relay node to forward data packets to its next hop.
Therefore, link properties are essential to applications and services in such networks because they directly impact on many performance metrics, such as end-to-end delay, packet losses, and throughput. Moreover, link dynamics, as fundamental characteristics of network dynamics, can also be used to maximize routing performance, optimize topology control, and achieve the desired network performance. However, the characterization of link dynamics is not very easy, mainly because they are determined by a set of random factors, such as radio channels, dynamic transmission range, node mobility, and node pair distance. The mobility of vehicles in VANETs, especially, is generally constrained by predefined roads. Vehicle velocities are also restricted by speed limits, level of road congestion, and traffic control mechanisms (e.g., stop signs and traffic lights). The quality of the wireless links between mobile nodes in a VANET can still vary over time. In extreme cases, a communication link has a limited overall lifetime due to its limited transmission coverage area on road as nodes move toward and away from each other. Link dynamics may not only lead to network connectivity being time varying but significantly affect the performance of network control algorithms. In addition, different transmission coverage areas, when constrained by the predefined roads, may also lead to different link dynamics.
In this paper, we would like to systematically explore the behavior of link dynamics and its dependence on various network characteristics in VANET. In particular, considering the real scenario of VANET, we would like to focus on the concept of “effective transmission coverage area” as a function of the vehicular mobility, the intensity of vehicles on a road, and the width of the road. We use this concept to establish an analytical framework for communication links when one or both vehicles are moving on a highway with the same or opposite directions. Then we derive formal expressions for a number of link dynamic properties/measures. Their performance is evaluated by both analytical expressions and simulations. The comparisons also verify the correctness of our analysis and the success of the concept of the “effective transmission coverage area.”
The contributions of the paper are as follows. (1) The concept of “effective transmission coverage area” of node is firstly considered to analyze the link dynamics in VANET. In this concept, not only the speed limits, level of road congestion, and transmission range of node, but also the predefined road are considered, which are more able to characterize the communication environment of real highway scenario. (2) We investigate how the link properties change while varying the effective transmission coverage area. The mathematical expression is derived for link lifetime, link arrival, link breakage, and link changes. It provides a fundamental guideline on designing new mobility models and routing protocols. (3) We provide extensive simulation results to support our findings. On one hand, our results verified the derived mathematical expression in effective transmission coverage area; on the other hand, the results collectively assert that, in characterizing the link dynamics, there exists an important factor-effective transmission coverage area to be considered, which has been largely overlooked in the literature but is necessary. (4) We explore its application of the derived mathematical expression in analyzing the network connectivity. By using queueing theory and the mathematical expression of link dynamics, the upper bound connectivity of a VANET is obtained.
The organization of the rest of the paper is as follows. In Section 2, we discuss related work on the effects of mobility on link characteristics in MANET. Section 3 describes the system model and assumptions. We derive an analytical framework to study link dynamics in Section 4. In Section 5, the derived expressions are validated through simulation results. Section 6 gives the applications in connectivity analysis. Finally, Section 7 concludes this paper.
2. Related Work
Link dynamics plays an important role in topology control [1–3], routing design, data dissemination, and protocol optimization in both the traditional MANETs and the latest VANETs. Some efforts have been directed towards designing routing schemes that rely on the identification of stable links in the network. Nodes evaluate and predict stable links and then preferentially use them for routing. In [4], authors used simulations to study the probability densities of link lifetime and route lifetime for some mobility models. According to this study, the path duration seems to be a good metric for predicting the general trends in the performance of vehicular routing protocols. In SSA (Signal Strength-based Adaptive Routing) [5], signal stability and location stability are utilized to quantify the reliability of a link. With the signal stability, each node classifies its neighbors as either strongly connected or weakly connected according to the signal strength of received beacons generated periodically by its neighbors. In MORE (Movement-Prediction-based Routing) [6], the future positions of vehicles and the duration of links are predicted, by estimating the time needed for the transmission of data to decide which link is used. The RABR (Route Lifetime Assessment-Based Routing) [7–9] estimates the lifetime of a link based on the measured change rate of the signal strength averaged over the last few samples and then is used to select routes for data transmission. Also some efforts focused on the mobility trace to exact the link properties for data transmission. In Maxprop [10], the historical mobility data is used to estimate the link likelihoods. In references [11, 12], the ICTs (Intercontact-Times) of mobile nodes are estimated for data forwarding. As a random variable, ICT can reflect the link properties in some degree. The importance of link dynamics in protocol design is more and more considered; however, understanding and analyzing the link dynamics is still a big challenge nowadays.
Existing works have been focused on examining the effects of node mobility on link dynamics, such as link lifetime [13–17], link change rate [13, 18], link residual time, and link availability [13, 17, 19, 20]. The main achievements include the following. (i) Markovian model is an effective method to study relative movements and distance of a node pair. (ii) There exists a peak in the link lifetime distribution based on random mobility models. (iii) The PDF (probability density function) of link change interarrival time can be approximated by an exponential distribution with fairly high accuracy. Existing research on link properties falls into three categories: simulation-based, experimental-based, and analysis-based studies. Extensive simulation-based studies [14, 15, 21] have been performed to provide empirical distributions and statistical analysis of link lifetime and residual lifetime under different mobility models, including RWP (Random Waypoint), RW (Random Walk), Gauss-Markov, Manhattan model, and Reference Point Group Mobility model. Apart from simulation-based studies, the research literature also contains analytical work on mobility and protocol performance modeling. McDonald and Znati [22] used a RWP-like mobility model derived expressions for the probability of path availability and link availability for different initial conditions. Samar and Wicker [23] suggested a random model to analyze the link dynamics in mobile ad hoc network environment. Stochastic properties of the RW model were studied recently in [18, 24]. Su and Gerla proposed a model for link duration and evaluated it using the RW model. Based on various mobility models, Cai and Eun [25] investigated the relationship between characteristics of underlying mobility patterns and stochastic properties of contact-based metrics. Another research methodology is to study realistic mobility models extracted from real traces upon which link properties between mobile users are widely studied in [26, 27]. Bai and Krishnamachari [28] showed that the exponential model is a good fit for highway vehicle traffic. In [29], Zhu et al. studied the real taxi trace from Shanghai on the frequency and duration of transfer opportunities between taxies macroscopically and pointed out that the tail distribution of the ICT exhibits an exponential decay over a large range of timescale. Li et al. [30] carried out an extensive experiment involving tens of thousands of operational taxis in Beijing city and then found that the contact interval can be modeled by a three-segmented distribution.
The limitations of existing works on link properties are threefold. First, existing random mobility models, such as RWP model and its variants, have significant drawbacks towards the steady-state properties of moving speed and node distribution, which could lead to defective analysis and simulation on link studies. Second, the contact-based link dynamics analysis from real trace is seriously dependent on the ICT distributions; different distribution may change a lot over different region and time. Third, the prevalent assumption of the previous studies is that the transmission coverage area of each node is a constant, which is helpful in simplifying the analysis, at the cost of ignoring the effect of real network environments. For instance, in [23, 31], the authors showed that the relative movement of the transmitter-receiver pair can cause significant link variability, given that the nodes in the network are initially placed randomly and nodes move randomly at any directions. However, the results are not real in VANET environment.
There are two obvious features for VANET environment. One is that the movement of node is constrained by the predefined road and the vehicles' velocities are also restricted by speed limits; the other is that the effective transmission coverage areas for nodes are not equivalent to the transmission range of node. Up to now, there is little research work that has considered the effective coverage area to capture various link characteristics. Therefore, we aim to study the link properties considering not only the vehicular traffic variation but also the effective transmission coverage area, which include more parameters in the effective coverage area and thus we can do more systematic studies. To the best of our knowledge, such a study at this level has not been done before.
3. System Model and Assumptions
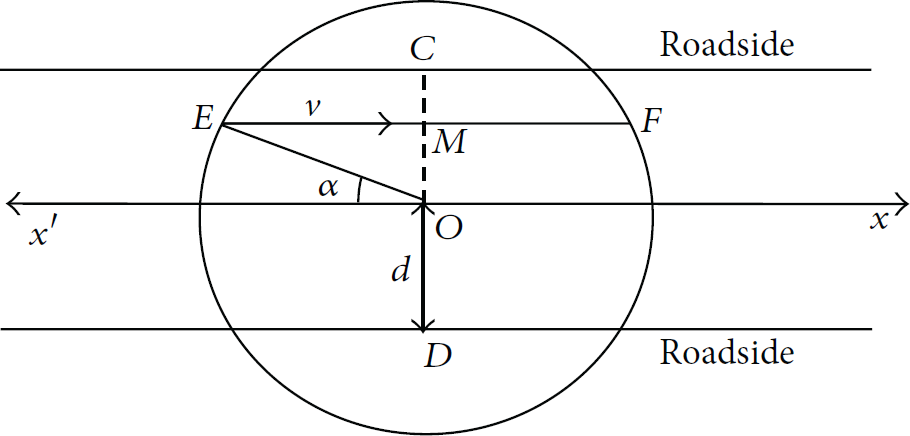
We consider a VANET in a highway scenario, where N vehicles are moving along the highway in the same or opposite directions. All the vehicles are equipped with OBU (Onboard Unit) devices for wireless communication. Each vehicle has a relay capability so that the vehicle can communicate with another one out of its transmission range through a multihop path. As a mobile node, each vehicle has the same transmission range indicated by the circle in Figure 1.

The effective transmission coverage area of a mobile node.
Since vehicles move on the road in just the same or opposite directions and vehicle's movement is constrained by the bound of the road, usually the transmission radius is much larger than the width of the high way. In the area outside the road, even if it is covered by a node's transmission range, there should be no nodes to communicate with the node on the road. Considering this real mobility scenario, we define the “effective transmission coverage area” of a node to be the overlapping area between the road segment and the circle as indicated by the grey area in Figure 1. For other nodes, it is similarly defined. Obviously, the transmission radius of node and the width of road are two main parameters to affect the effective transmission coverage area. A vehicle can only communicate with other vehicles that come into its effective transmission coverage area. The following list describes the assumptions made in characterizing the link dynamics:
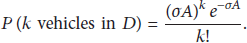
The terrain is flat so that we need not consider the “line of sight” effect. This would also allow us to estimate the transmitted signal when the SIR (Signal to Interference Ratio) remains high up to a certain distance R from the transmitter. The mobile nodes have bidirectional communication links with each other when the distance is smaller than R. A node in the network moves with a randomly chosen speed which is uniformly distributed between a m/s and b m/s. This mobility model allows for a more challenging test environment and facilitates the determination of low bounds on the link properties for a general VANET in highway scenario. The mobility of a vehicle is independent of other vehicles on the highway. That is, the speed, direction, and location of vehicles are mutually uncorrelated. The initial locations of vehicles in the network are modeled by a two-dimensional Poisson process with node density σ such that, for a network region D with an area A, the probability that D contains k nodes is given by
This is frequently used to model the location distribution of nodes in VANET [27, 28] and it can model the aggregated behavior of nodes in a large network.
Assumptions (3)–(5) characterize both the individual and aggregated behavior of nodes in a large wireless network. Due to the large number of independent nodes operating in an ad hoc fashion, any correlation between nodes can be assumed to be insignificant. Although it is possible that some nodes may have similar intent and may move together, a large enough population of autonomous mobile nodes can be expected in the network so that the composite effect can be modeled by a random process.
4. Analysis of Link Dynamics
In this section, we shall analyze mathematically different performance measures of link dynamics including the expected link lifetime, the distribution of link lifetime, the expected rate of new link arrivals, the new link interarrival time distribution, the expected link breakage, and the link breakage interarrival time distribution. The mathematical expressions can be used for the modeling of link dynamics that are very important in designing good protocols in high mobility VANET environment.
4.1. Expected Link Lifetime
Figure 2 shows the transmission range of a node (say node
Transmission range of node
To obtain the expected link lifetime, we create a Cartesian coordinate system with orthogonal unit vectors
Hence, the relative velocity of node

Let α be the angle of the point of entry E of node
Line


Let the joint probability density function of α, v, and φ for nodes that enter the transmission range be

Let the width of the highway be
The direction of node

Intersection of a vehicle trajectory with the transmission range of another vehicle.
Since α is the random variable representing the angle defining the point of entry of node


According to assumption (3),
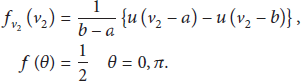
Using
From (10) and (11), we can obtain
Hence, the joint density of α and v can be expressed as


Equation (16) describes the expected link lifetime for a node as a function of its transmission range, velocity, and the width of road, which can characterize the size of the effective coverage region when the transmission range R is fixed.
Figure 4 plots the expected link lifetime for a node with increasing velocity and different values of m, while fixing other parameters at

Expected link lifetime for different
4.2. Link Lifetime Distribution
Link lifetime distribution is a very important property of link. The CDF (cumulative distribution function) of link lifetime can not only demonstrate the basic link property, but also be used to analyze other properties.
For a particular vehicle moving with a velocity

Obviously,


Figure 5 plots the link lifetime CDF for different vehicular velocity and road width. The CDF increases quickly to approach probability 1 in a short time interval. For example, as shown in Figure 5(a), for

The CDF of link lifetime (
For example, when fixing
Similar observation can be made in Figure 5(b) for link lifetime CDF for different road widths m while fixing the speed
4.3. Expected Rate of New Link Arrival
To analyze the rate of new link arrivals, we show again in Figure 6 the transmission range of node

Analysis of the expected rate of new link arrivals.
From the geometry of Figure 6, one can show easily that the area of the shaded region
Thus, the expected number of nodes entering the transmission region per second, or equivalently the rate of new link arrivals, is given by

An important point to observe from (22) is that the expected rate of new link arrivals for a node is directly proportional to the average density σ of nodes in the network. It is also directly proportional to the road width. These results are shown in Figure 7 as a function of the node moving velocity
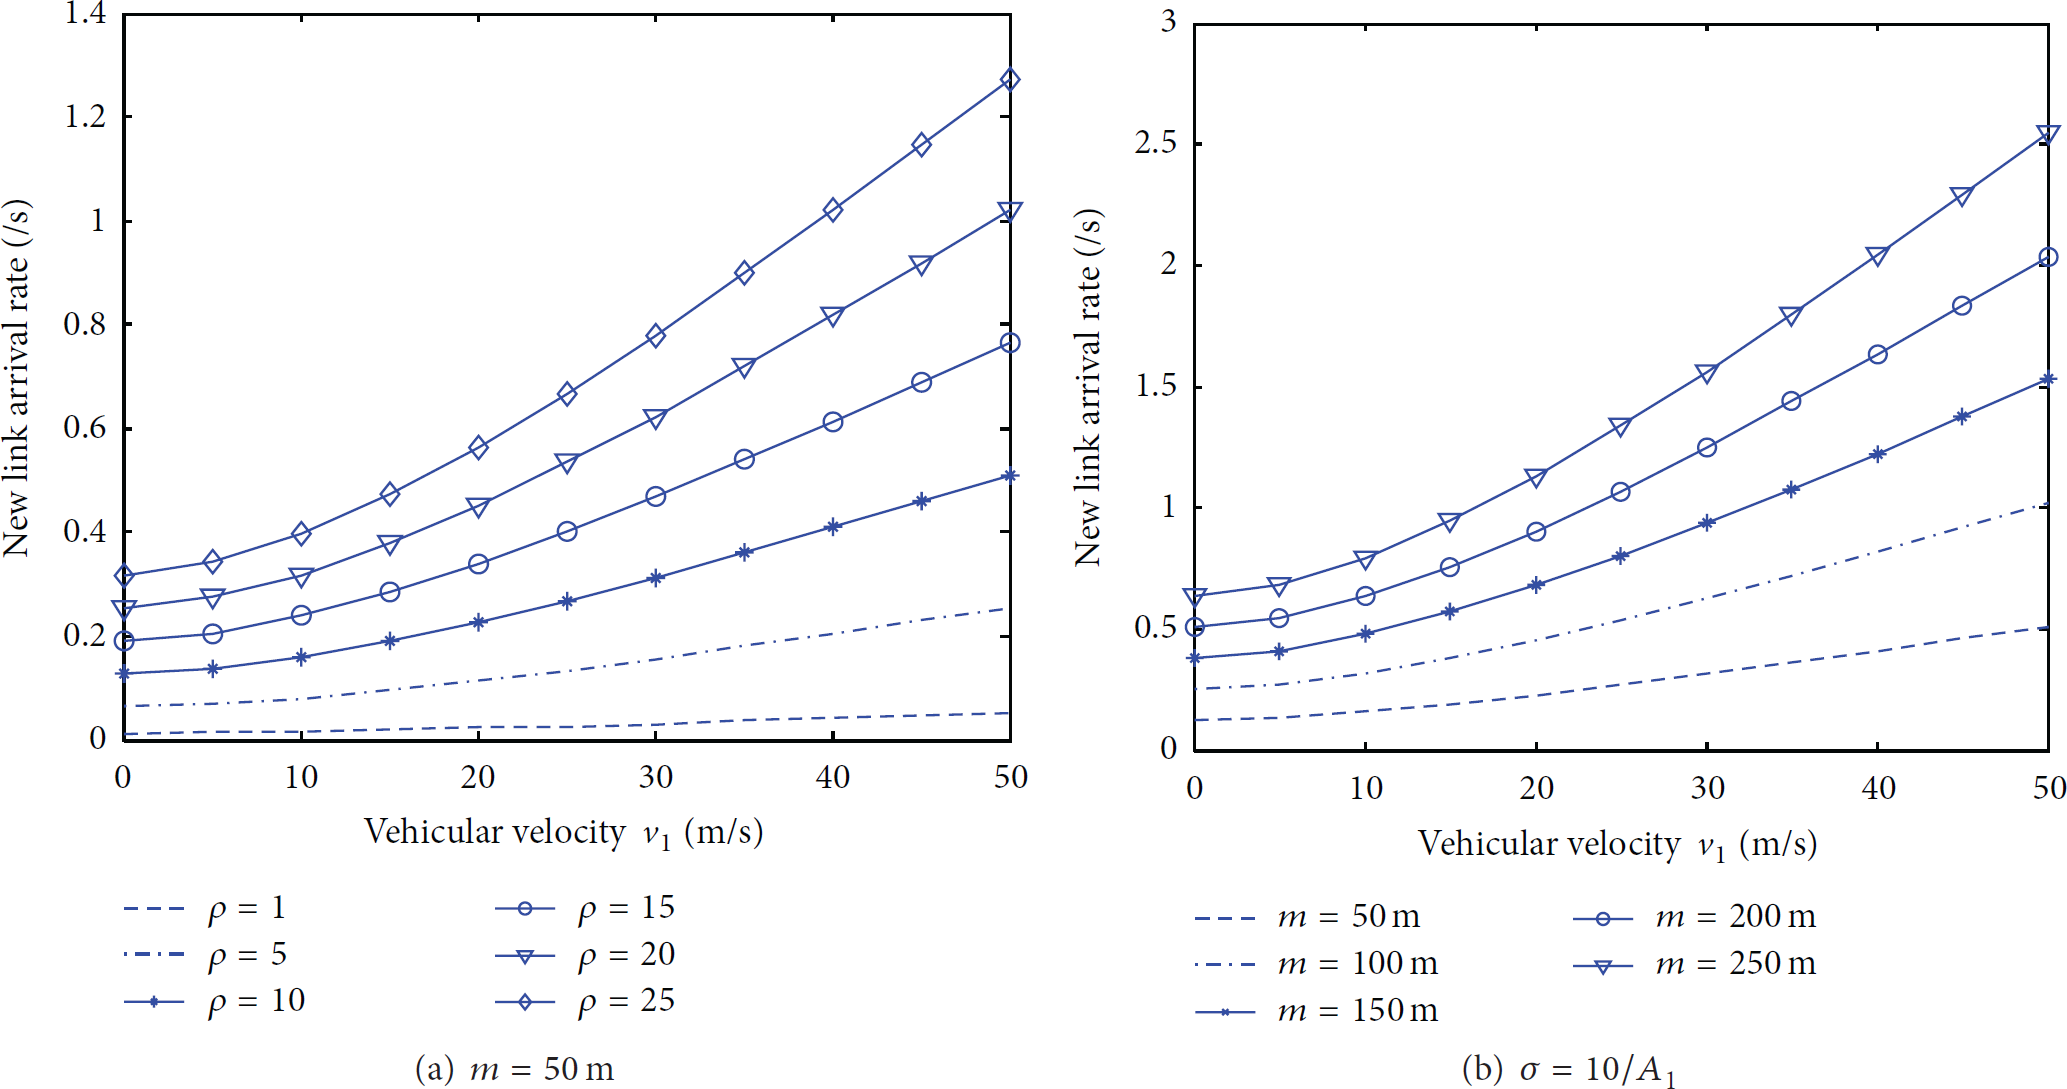
Performance of the expected new link arrival rate.
4.4. New Link Interarrival Time Distribution
The cumulative distribution function of new link interarrival time is defined as

As seen in Section 4.3, a mobile node with relative velocity
Hence, the CDF of new link interarrival time can be expressed as

Figure 8 illustrates the new link interarrival time distribution for a node moving with velocity

New link interarrival time distribution with
4.5. Expected Link Breakage Rate and Link Change Rates
Expected link breakage rate is also a very important metric to reflect the link dynamics, which is defined as the expected number of link breakages per second observed by a single node. Any change in the set of links of a node may be due to either a new link arrival or a currently active link breakage. Thus, the expected link change rate for a node is equal to the sum of expected new link arrival rate and the expected link breakage rate. The expected arrival of new link is expressed in (22).
To determine the expected link breakage rate, suppose that the network is formed at time 0. Let the total number of new link arrivals for a node between

The expected link change arrival rate as a function of the node velocity
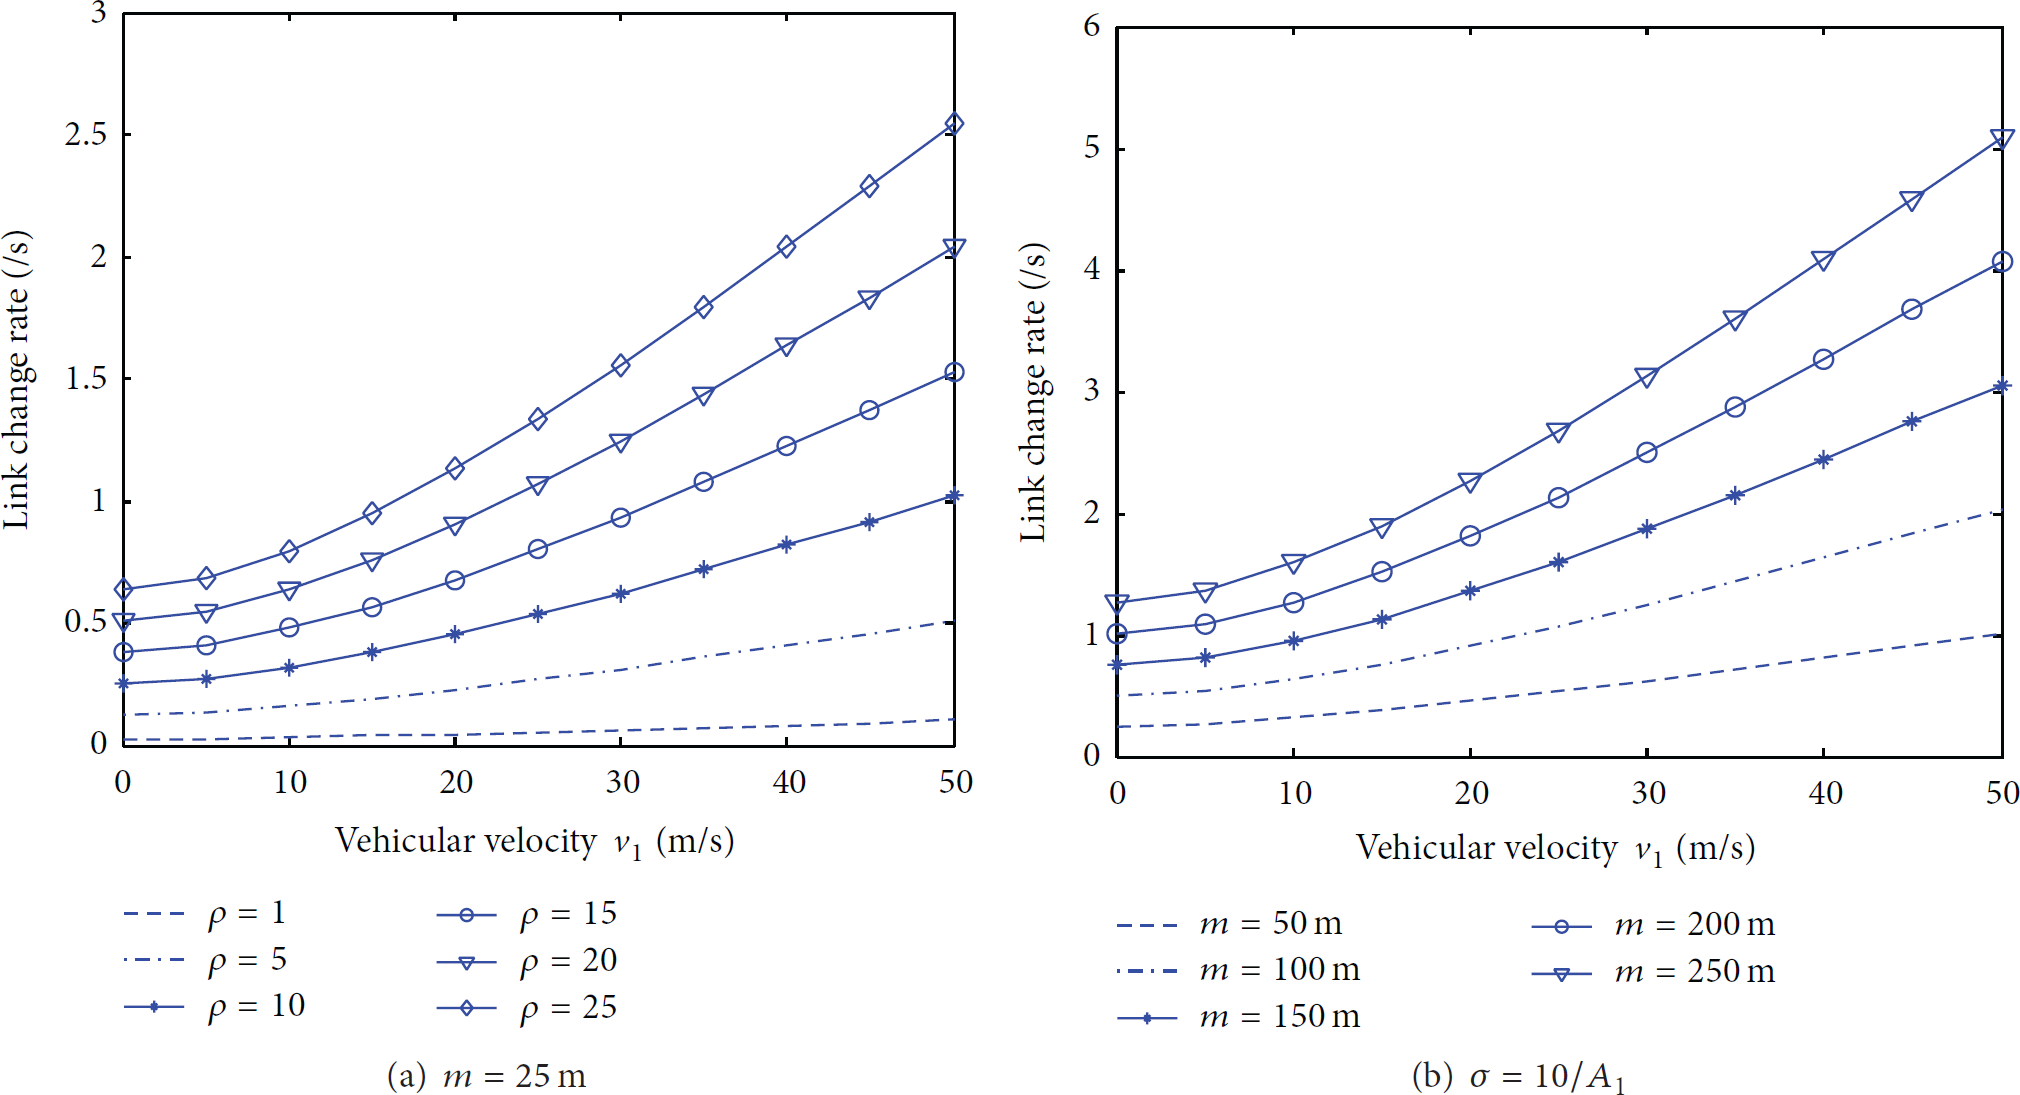
Expected link change arrival rate.
4.6. Link Breakage Interarrival Time Distribution
To derive the link breakage interarrival time distribution, we proceed in a manner similar to Section 4.4. With respect to Figure 10, the shaded region


Analysis of the link breakage interarrival time.
Hence, the CDF of link breakage interarrival time is given by

The right-hand sides of (25) and (29) are the same, implying that the distributions of the link breakage interarrival time and the new link interarrival time are the same. It is consistent with the results in Section 4.5 that the expected rate of link breakages is equal to the expected rate of new link arrivals.
5. Verification
We use SUMO [32] simulations to generate exponential mobility model of a VANET for comparisons. SUMO is open source, microscopic, space-continuous, and time discrete vehicular traffic generator that can generate the movements of the vehicle nodes. In our simulations, vehicles speed is uniformly distributed between
Figure 11 shows the expected link lifetime and normalized frequency of link lifetime obtained by simulations and the proposed analytical analyses, respectively, where

Simulation verifications. (a) Expected link lifetime and (b) normalized frequency of link lifetime.
Figure 12 gives the comparison between simulation and our earlier analysis for the link arrival rates with
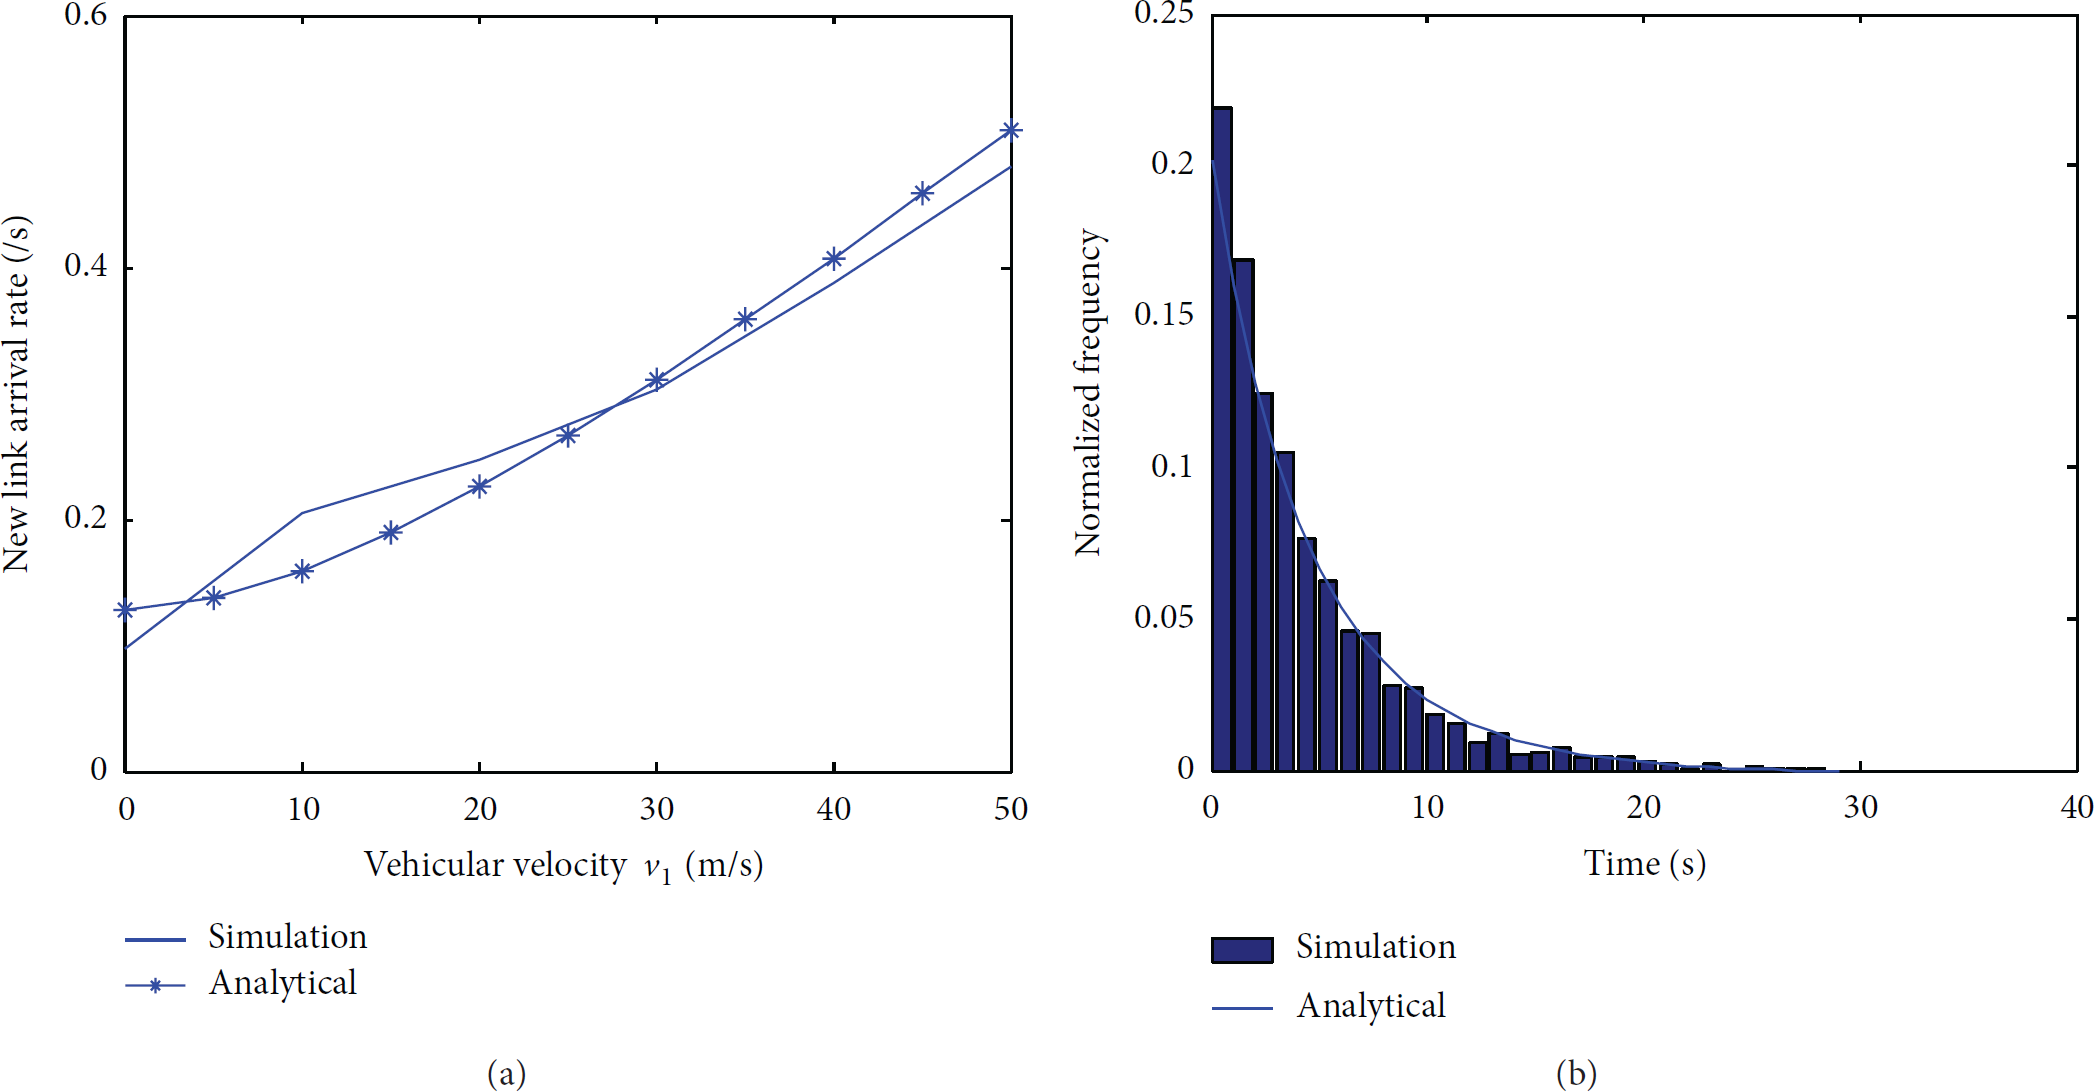
Simulation verifications. (a) New arrival rate and (b) interarrival time frequency.
6. Analysis of Network Connectivity Based on Link Dynamics
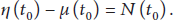
The characterization of link dynamics gives us a formal understanding of their dynamic behavior of VANET in highway scenario. For example, expected link lifetime and expected link change rate are two important metrics to reflect the topology dynamic and network connectivity. Here, we use the knowledge of expected link lifetime

From (30),
Each node in

Figure 13 illustrates the relationship among

Upper bound of connectivity of a VANET.
7. Conclusions
Effective transmission coverage area and mobility are both significant factors affecting the performance of VANET, in which the communication links pass into and out of existence as the nodes move toward and from one another. In this paper, we mainly considered the effective coverage and vehicular mobility to explore the behavior of communication links in a systematic manner in VANET. An analytical model is proposed to address the general problem of mobility based on the effective coverage area in VANETs, which can analyze the dynamic statistics for link lifetime, new link interarrival time, link breakage interarrival time, and so forth. The formal expressions for the above link dynamic properties have been obtained. Furthermore, the analytical results are verified by extensive simulations and finally we applied two main metrics of the link dynamics metrics, expected link lifetime
Our study focused on the effective transmission coverage area in this paper is especially helpful on mobility related research issues of VANETs. Our further work will explore a number of applications of our analytic framework, including the design of protocols for routing, neighbor discovery, and topology control and data dissemination.
Footnotes
Conflict of Interests
The authors declare that there is no conflict of interests regarding the publication of this paper.
Acknowledgment
This research is supported by the National Natural Science Foundation of China (nos. 61402327, 61363081, and 61172063).