
Abstract
People immediately want to access the required data in vehicular ad hoc networks (VANETs). They provide the requests to road side unit (RSU) while travelling. The job of RSU is to handle various requests in such a way so that the service ratio and the quality of service (QoS) is optimized. In this paper we present a mechanism to achieve this goal. Our proposed algorithm considers both data size and deadline and optimizes uploading/downloading based on number of requests to be handled. It also deals with the impact of missed upload operations to achieve maximum optimization. The proposed scheme categorizes data into two classes to assign weight according to their effect on QoS and assigns priorities to upload and download requests while maintaining common queue for both upload and download requests. Simulation results corroborate that the proposed algorithm provides better service ratio and QoS than existing techniques.
1. Introduction
Vehicular ad hoc network (VANET) is emerging as very crucial technology due to rapid traffic increase and recent advances in wireless technology. People in vehicles may get security support, local news and advertisement, music, radio, video, and so forth [1–4]. Vehicles can obtain these data items from road side unit (RSU). Recently research is devoted to provide efficient access of data from RSU to vehicle or vice versa [5–8]. Federal Communications Commission (FCC) has allocated 5.850–5.925 GHz portion of the spectrum for intervehicle communication (IVC) and vehicle to roadside communication (VRC) [9, 10] in USA. Applications of VANET can be broadly classified into following categories:
safety related applications: accident related alerts, red light warning, and so forth. nonsafety related applications: downloading as well as uploading/surfing audio/video programs, digital maps, internet access, traffic information, weather reports, and other communication applications.
Few of the major concerns for vehicular communication are high mobility, dynamically changing topology, sparsely located nodes, and critical communication duration [11–13]. So, data dissemination with good service ratio and quality of service is a major challenge. In this paper we performed the following tasks.
Categorized data into two classes in order to assign weights such that it assigns highest priority to most urgent update request. Proposed a method to assign uniform priorities to upload and download requests. Proposed a new algorithm to increase service ratio and quality of download up to an optimum level. Performed simulations which show that the proposed algorithm is better in terms of service ratio and quality of service than earlier existing approaches.
Rest of the paper is organized as follows. Section 2 discusses related work. Section 3 describes system model. Section 4 proposes a new scheduling scheme. Section 5 elaborates performance metrics to be used for evaluation of proposed system, simulation environment and results. Finally Section 6 is devoted to concluding remarks.
2. Related Work
Major research challenges in VANETs are introduced in [11–13]. High mobility of vehicles is the main challenge in VANETs which leads to short deadline to access data from RSU and causes highly dynamic topology. In case of vehicle-roadside data access there is more than one vehicle under coverage of one RSU. So multiple vehicles can send data upload and download requests to RSU. RSU needs to schedule these requests in such a way so as to improve service ratio and quality of service. Many broadcasting algorithms have been proposed to reduce the waiting time [14–16].
In [17] Acharya and Muthukrishnan proposed a data scheduling algorithm called longest total stretched first (LTSF) which is based on a new metric called stretch, that is, service ratio of the response time of a request to its service time. LTSF optimizes stretch and maintains balance between worst case and average case but implementation of LTSF for large system is not practical because server needs to recalculate stretch for every pending request to find next data to be broadcasted. In [18] Xu et al. proposed online scheduling algorithm for time critical on demand data broadcast, but they assumed that data can only be updated by server; that is, vehicles can only download and it does not allow vehicles to update urgent data. Jiang and Vaidya [19] proposed periodic push based broadcast, which is not well suited to VANET applications.
In [20] Zhang et al. first proposed
In [21] Fridman et al. have proposed a model which allocates resources based on input constraints and maximize the communication performance for MANET.
In contrast to existing strategies, the proposed scheduling scheme maintains single queue for both upload and download requests. It gives more weightage to most urgent updates than downloads to improve quality of service, and more weightage to number of downloads than less urgent updates to improve service ratio, in dynamic fashion.
3. System Model
In VANETs, there are two communication entities: vehicles and road side unit (RSU). RSU acts as data manager or service provider while vehicles act as consumer/modifier of data.
Each vehicle in VANET is equipped with on board unit (OBU) which is transceiver with computational power and omni directional antenna. RSU has transceiver, antenna, processor, and sensors. RSUs are generally placed at intersections to improve traffic at that intersection to reduce accidents. RSU manages all data and requests. Vehicles can request the desired data and can update the data. Upload and download compete for same bandwidth. In our model RSU maintains a single queue for upload/download requests. A typical scenario will look like as shown in Figure 1.

Typical VANET scenario.
As shown in Figure 1, many vehicles can send their request to RSU at a time. Let each request be submitted as
<vehicle_id, data_id, current_position, average_speed, operation> vehicle_id: uniquely identifies the requesting vehicle, data_id: identification code of requested data on which operation is to be applied, current_position: each vehicle is assumed to have global positioning system (GPS) so it knows its current location, average_speed: average speed of vehicle, operation: either upload or download.
Operation sequence of VANETs is summarized in Figure 2.

Steps involved in VANETs operation.
4. Proposed Scheme
The objective of the proposed method is to achieve maximum possible service ratio with optimum data quality. Based on the CPU scheduling criteria the requests can be scheduled in the following ways.
FCFS (First Come First Serve). According to this sequence, requests are scheduled according to the sequence of their arrival. This approach is inappropriate for VANETs because it does not consider deadline constraint of requests. SDF (Smallest Data size First). This scheme schedules the requests according to their size; that is, smallest data size request will be scheduled first. EDF (Earliest Deadline First). This scheme schedules the requests according to their deadlines; that is, earliest deadline request will be processed first.
Authors in [20] have proposed
Further Zhang et al. proposed
Our proposed method modifies
4.1. Parameters Used to Assign Priorities
The proposed method uses following parameters to assign priorities to various requests (see Table 1).
Data Size (S). It is size of data requested for upload or download. It can be in kilobytes (KBs) or megabytes (MBs). Deadline (D). Each vehicle sends its current location and average speed along with request to RSU. RSU knows its coverage area so it can calculate how much time the vehicle will remain in its coverage area. Let it is denoted by Weight (W). This parameter is used to measure relative importance of various data items, for example, updates related to security must have more weightage than update requests related to nonsecurity data items.
Simulation parameters.

4.2. Assigning Weight to Various Data Items
RSU maintains various types of data items such as safety related data, for example, traffic congestion related data and traffic light alert; nonsafety related data, for example, advertisement of local hotels, tourist places, digital maps, and audio/video files. Safety related data must be updated within deadline even when there is no download request for this data item in current window. We call these data items highest update priority data (HUPD). Since missed update of audio/video does not significantly deteriorate the quality of data, we call these data items least update priority data (LUPD). We assign different weights to these data items belonging to these two categories. Let there be k data items
//Algorithm to assign weight
N = total number of requests in window for
do if
else
4.3. Assigning Priorities to Various Requests
Priority assigning algorithm uses following notations:
//Algorithm for assigning priorities
for
do if
then else if
if download request also exists for same data item
then else
The smaller the value of
Above algorithm steps are shown in Figure 3.

Priority Assigning Algorithm.
Theorem 1.
The proposed priority assigning algorithm assigns highest priority to update requests of HUPD data items.
Proof.
Let 
Let 
In worst case there would be no download request for 


Even for nominal window size 5,
4.4. Algorithm to Process Requests from Service Queue
This algorithm uses the following notations.
N: Number of requests in current window.
//Algorithm to process requests
for
if (
then if (
then broadcast else
else if (
then allocate channel to upload else
for
do if ((
then if ((
then if (
then for
do if ( if ( Exit
Step 1 marks each request as unsuccessful and unprocessed. Step 2 selects unprocessed highest priority request from queue, this step can be implemented by using min priority queue. If selected process is of download type then steps 3 and 4 process it; if its deadline is less than transfer time, then broadcast it and mark it as processed and successful else mark it as unsuccessful and processed. If selected process of step 2 is upload request then step 5 allocates channel to upload data requested if deadline is less than transfer time of requested data and mark it as processed and successful, if deadline cannot be met then mark it as unsuccessful and finished. If processed request was successful then step 6 marks request of same data and same operation with achievable deadline (i.e.,
5. Simulation Environment and Results
We validate the performance analysis of proposed QoS aware service Scheduling (QASS) scheme by performing simulation experiments.
5.1. Performance Metrics
We use the following metrics for performance evaluation.
Service Ratio (in Percent). Ratio of number of requests served by road side unit successfully to total number of requests submitted by vehicles to RSU. A better scheduling algorithm is characterized by high service ratio. Data Quality. If upload request of some data item say
5.2. Experimental Setup
The experiment is based on a
We used ns-3 [22] network simulation platform to evaluate performance of the proposed algorithms. Although currently ns-3 does not support detailed VANETs simulation but it has excellent implementation of Wifi Models and is accurately capable to test diverse protocols at application layer.
We implement two applications, namely, ServerApp and ClientApp by extending Application class of ns-3 built-in API. The ClientApp requests various data items to the ServerApp. It composes the request in form of packets by using data size, deadline, operation and data ID. Data size is the size of the packet. The deadline is calculated by current location, average speed and the coverage area of the RSU. The operation can by upload or download. The data ID is used to distinguish various data items. The deadline, operation and data ID values are added to the packet by using tagging facility of ns-3. Three classes, namely, DeadlineTag, OperationTag, and DataIdTag, where defined by extending Tag base class for deadline, operation and data ID parameters, respectively. The node of ns-3 is considered as the vehicle (client) with mobility capabilities. The clientApp is installed on all client nodes.
The ServerApp performs all scheduling operations. It reads various parameters of incoming requests from clients and assigns weight and priority accordingly to each request. After user defined simulation time, it schedule all received requests according to the scheduling algorithm and responds to all clients. A stationary node is taken as RSU and the ServerApp is installed on it.
We define two helper classes, namely, ServerAppHelper and ClientAppHelper, to facilitate easy configuration of the server application and the client application, respectively.
The RSU node and the client nodes contain respective NICs (network interface cards) by using NetDevice implementation of ns-3. Also, all nodes (RSU/server node, vehicles/client nodes) are configured with real IP addresses using IPv4 API of ns-3. The Attribute facility of ns-3 is used to configure various components of the simulation. Such as, SetDeviceAttribute, SetChannelAttribute are used to configure DataRate of the devices and Delay of the channel, respectively. And, SetPropagationDelay, AddPropagationLoss methods are used to configure the wifi channel similar to real VANETs environment. At the physical layer, OfdmRate6Mbps and WIFI_PHY_STANDARD_80211_10MHZ is used to comply with IEEE 802.11 p/WAVE Standard. The SetAttribute of ClientAppHelper is used to set various elements such as MaxPackets, Interval and PacketSize.
The highway is created by using GridPositionAllocator of ns-3 mobility component. The vehicles maintain distance of ten meters with each other and can move between user-defined initial and maximum range. The RSU is fixed at the specific location at the highway and it has fixed coverage area to serve the clients/vehicles.
The ns-3 tracing facility with callbacks is used to calculate deadline and add various tags to packets by defining trace sources and trace sinks. Also, the logging facility is used to test and evaluate various results.
We also implemented FCFS, EDF, SDF, and
We measure performance of proposed algorithm under various scenarios based on a new metric called Impact Factor (IF) defined as:
Impact Factor (IF) = Number of HUPD data items/total number of data items (NOD).
Based upon value of impact factor there can be three possible cases. For evaluation of each scenario we used service ratio and data quality as metrics. We have taken Case 1, where
5.3. Effect of Arrival Rate on Service Ratio
Case 1 (when IF is 0.8).
In this case most of the requested data items belong to HUPD. This case reflects the scenario where almost all requests are coming for high priority items that is, in such scenario, most of the requested data items belong to HUPD. We evaluated each of above mentioned algorithm in this scenario by taking

Effect of arrival rate (λ) on service ratio in (a) Case 1, (b) Case 2, and (c) Case 3.
Case 2 (when IF is 0.6).
This case reflects normal scenario where HUPD data is not referred so frequently that is, traffic density is normal and requests for safety or critical data are normal. We tested this case by taking
Case 3 (when IF is 0.2).
This case reflects the scenario where number of requests for critical or safety related data is least. We have simulated this case by taking
5.4. Effect of Arrival Rate on Data Quality
Case 1 (when IF is 0.8).
Quality of data is equally important as service ratio. Data quality is measured by number of missed updates for items. Lower the number of missed updates better is quality of data. In this case most of requests are for HUPD data and algorithm is optimized for high priority requests so numbers of missed updates are least in case of QASS. Figure 5(a) illustrates that quality of data delivered in this case is significantly better than all other algorithms and also service ratio is better than FCFS, SDF, and EDF, and as good as DSN.
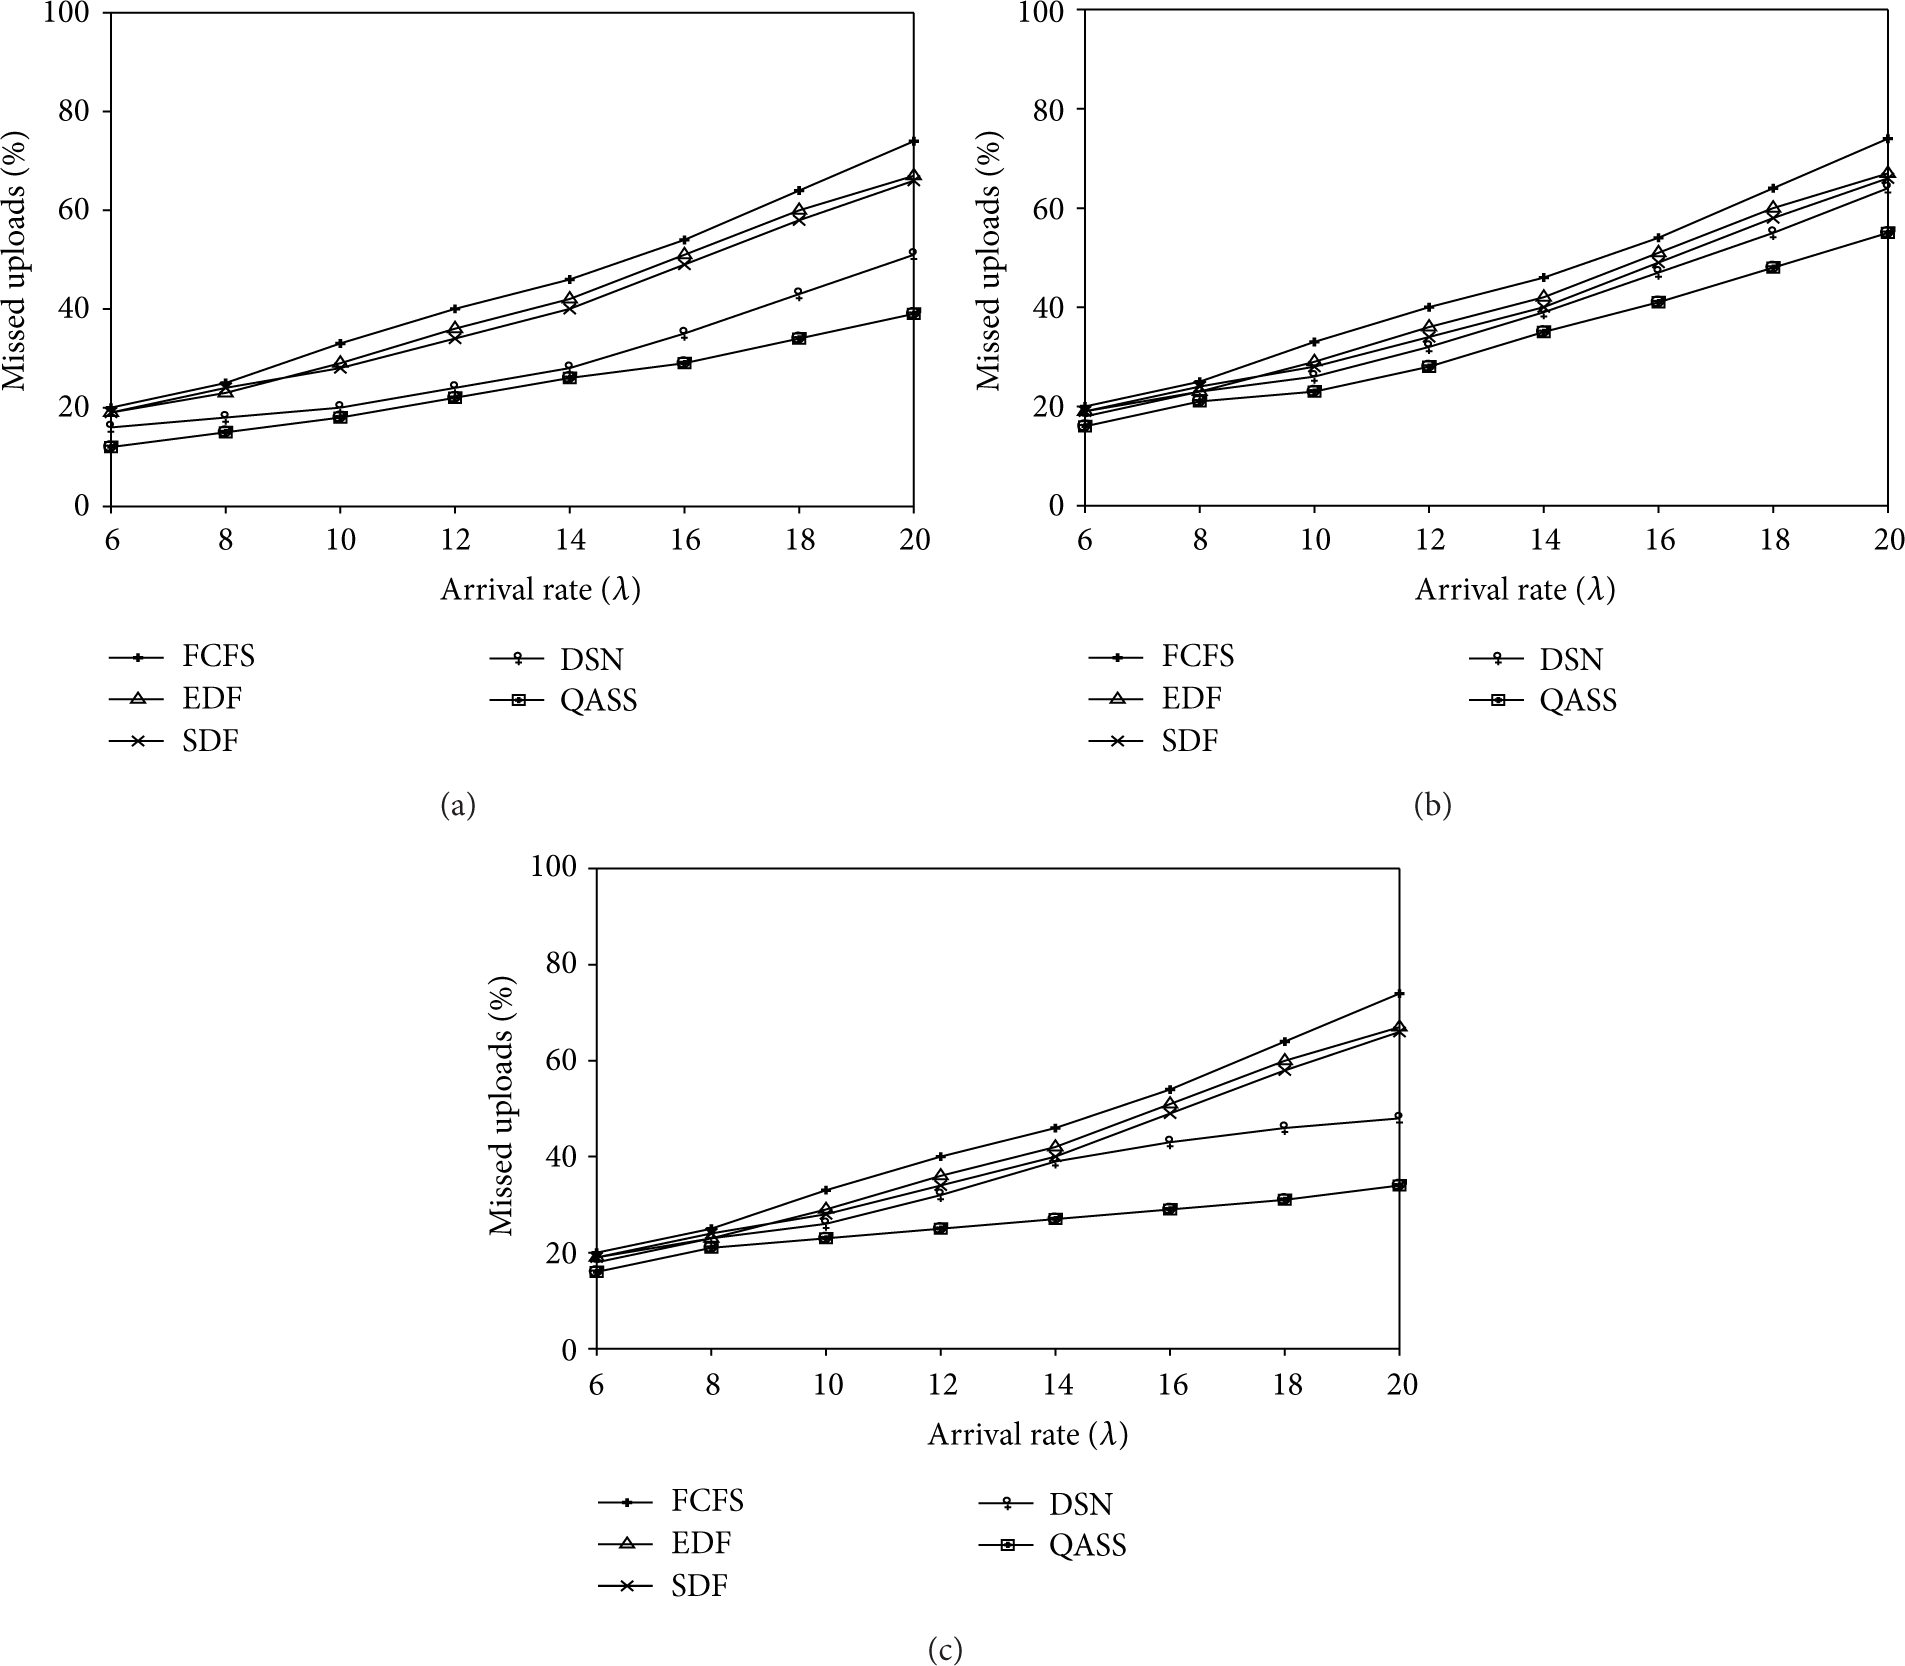
Effect of arrival rate (λ) on data quality in (a) Case 1, (b) Case 2, and (c) Case 3.
Case 2 (when IF is 0.6).
Figure 5(b) shows that proposed algorithm provides better service ratio than FCFS, SDF and EDF and slightly better than DSN. Here also arrival rate λ is varied between 6 and 20 and θ is set to 0.6. Numbers of missed updates are again least in QASS and it increases as arrival rate increases.
Case 3 (when IF is 0.2).
In this case most of requests are for non HUPD data items. But QASS does distinguish between upload and download requests and accordingly readjusts which is not the case in other algorithms, so numbers of missed updates are least in case of QASS. Figure 5(c) illustrates that quality of data delivered in this case is significantly better than all other algorithms and also service ratio is better than FCFS, SDF, EDF, and DSN.
5.5. Effect of Data Set Size on Service Ratio
Case 1 (when IF is 0.8).
The data set size value is varied between 10 and 50. The corresponding service ratio is shown in Figure 6(a). Maximum requests in this case belong to HUPD. The number requests increases in proportion to the increase number of items. We evaluated each of above mentioned algorithm in this scenario by taking

Effect of data set size (N) on service ratio in (a) Case 1, (b) Case 2, and (c) Case 3.
Case 2 (when IF is 0.6).
This case reflects normal scenario where HUPD data is not referred so frequently that is, traffic density is normal and requests for safety or critical data are normal. We tested this case by taking
Case 3 (when IF is 0.2).
Here in this case only 20% of the total requests are assumed to be for HUPD data and 80% for nonsafety data. Service ratio against different values of data set size is observed. Figure 6(c) shows the service ratio of proposed algorithm along with others for Case 3. Service ratio of QASS is better than basic scheduling algorithms and similar to DSN. This is because it uses all parameters such deadline, size and number of outstanding requests for scheduling information as is the case in DSN algorithm. Other methods that is, FCFS, EDF, and SDF do not combine these parameters so do not perform as well as QASS and DSN.
5.6. Effect of Data Set Size on Data Quality
Case 1 (when IF is 0.8).
Figure 7(a) shows the quality of data as we increase data set size from 10 to 50. Arrival rate is set to 10 and access pattern value is taken 0.6. QASS has least number of missed updates so it performs significantly better than all other algorithms. When IF is taken as 0.8, concentration of HUPD requests is maximum and QASS prioritize these requests. So with increase in number of data set size, missed updates increase marginally.
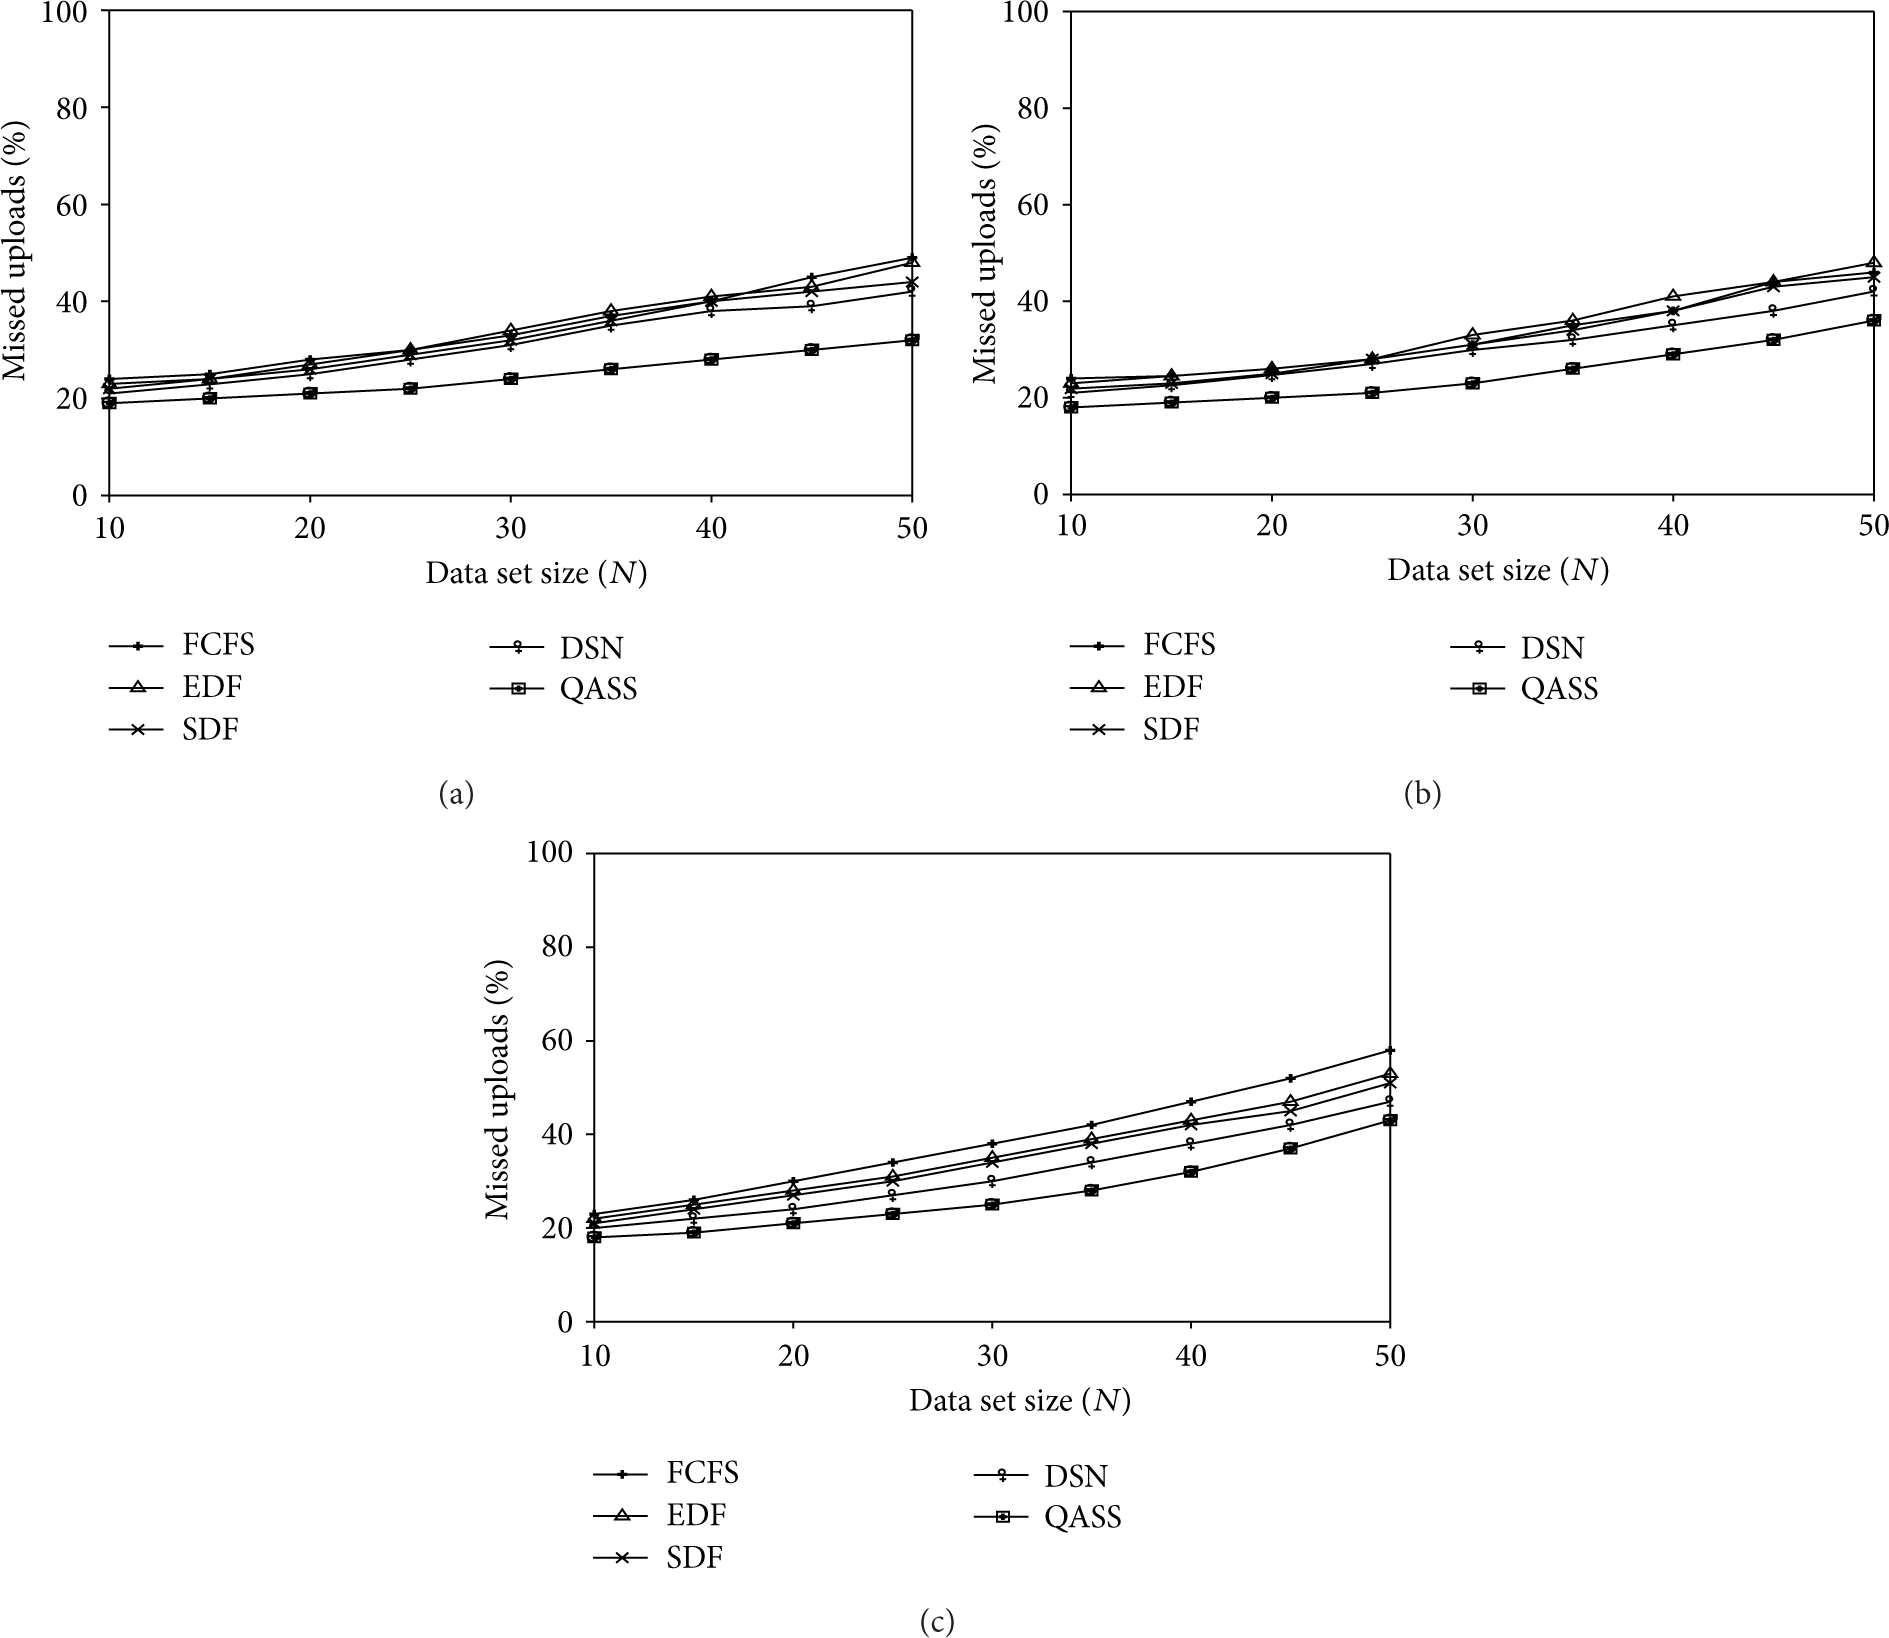
Effect of data size (N) on data quality in (a) Case 1, (b) Case 2, and (c) Case 3.
Case 2 (when IF is 0.6).
When IF is taken 0.6 then HUPD requests presence is almost half of total requests. Accordingly QASS prioritizes only that much requests so number of missed updates in this case is more with increase in data set size. QASS performs better than its counterparts. Results are shown in Figure 7(b).
Case 3 (when IF is 0.2).
Figure 7(c) shows the data quality of proposed algorithm along with others for Case 3. Requests for HUPD items in this case are only 20%. Most items are in LUPD group so algorithm very much works like DSN. Data quality of QASS is better than basic scheduling algorithms and similar to DSN. This is because QASS uses all parameters such deadline, size, and number of outstanding requests for scheduling information as is the case in DSN algorithm. Other methods, that is, FCFS, EDF, and SDF, do not combine these parameters and so do not perform as well as QASS and DSN.
6. Conclusion
In this paper we proposed a new data scheduling scheme for vehicular ad hoc networks. The proposed scheme first categorizes data items into two classes, that is, high update priority data and low update priority data. Different weights are assigned to these two classes such that more weightage is given to data items of class high update priority data. Both update and download requests are maintained in common queue. Priority assigning algorithm assigns priorities to upload requests by using formula
Footnotes
Conflict of Interests
The authors declare that there is no conflict of interests regarding the publication of this paper.