
Abstract
Invasive white leadtrees (Leucaena leucocephala (Lam.) de Wit) are contributing to the destruction of coastal ecosystems and biodiversity in humid subtropical and tropical regions. Sudden clearcutting of invasive tress can lead to substantial soil loss, which subsequently reduces the efficiency when indigenous vegetation is restored. Soil samples (
1. Introduction
According to the Invasive Species Specialist Group, the species of white leadtrees (Leucaena leucocephala (Lam.) de Wit), among the top 100 most invasive trees species worldwide, have invaded coastal forests in subtropical and tropical regions [1]. The invasive white leadtrees have been regarded as a serious threat to coastal ecosystems and a contributing factor to reducing native biodiversity [2]. Clearcutting of white leadtrees and indigenous plant restoration are therefore crucial concerns because of the rapid decline in biodiversity in coastal areas.
However, clearcutting and deforestation have increased the extent of soil loss in forestlands, particularly during harvest periods and when sites are undergoing preparation for the next stand of plants [3, 4]. Edeso et al. [5] indicated that forest logging activities markedly accelerate soil loss because of erosion, particularly during the period immediately before the vegetation is restored. Additionally, a rich diversity of low-herb species and groundcover plants is common in forests invaded by exotic shrubs [6, 7]. After clearcutting, the incomplete canopy cover and groundcover can more than double the rate of soil erosion compared to areas with sloping land where natural forests are intact, such as in Southern Italy [4], and an obvious increase in soil loss after clearcutting has been observed in forest catchments with moderate slopes [8].
Coastal areas in humid subtropical and tropical regions are usually characterized by shallow soils because of the low soil formation rate in such areas [9]. High levels of soil loss immediately following deforestation deplete the soil depth in such areas, resulting in nutrient leaching, which limited the growth of plants. To successfully restore such areas, quantifying the extent of soil loss is vital for preserving coastal areas after clearcutting to remove invasive trees, particularly in areas with relatively thin soil depth and poor soil quality. The spatial heterogeneity of the soil erosion in a given area is usually determined by assessing certain soil properties, including the soil texture, organic matter content, permeability, and structural stability. Integrating variables related to soil erodibility into a geographic information system (GIS) is an effective method for elucidating the soil erosion potential of a given area, particularly in areas subjected to such disturbances as clearcutting or site preparation. Therefore, clarifying the spatial distribution of soil properties and determining they are related to soil erodibility is crucial. Previous studies have identified soil texture (i.e., primarily the proportion of sand and silt in the soil) and soil aggregate stability as key parameters in determining the soil erodibility in agricultural lands and mountain slopes [10–14]. However, few studies evaluating soil erosion and the relationship between soil erodibility and soil characteristics have been conducted in coastal areas. Determining the spatial distribution of soil erodibility and soil properties is therefore crucial in restoring native forests in coastal areas.
In Southern Taiwan, white leadtrees have invaded approximately 9,000 ha of Kenting National Park (KNP), which accounts for approximately half of the park area [15]. Before 1970, most land areas in the coastal terraces of KNP were sisal hemp plantations (Agave sisalana), which were used for producing twine. However, these coastal lands were fallowed since 1970 and then gradually invaded by white leadtrees, which are a thornless species of long-lived tree that is difficult to eradicate. White leadtree invasion interrupts regeneration processes in neighboring plantations of indigenous species by releasing various chemicals, residues, and oils [16]. Generally, forests invaded by white leadtrees typically have a partially open canopy. The white leadtrees can aggressively invade abandoned farms and become a pure stand of leadtrees within 5 years. More than 48% of tropical rainforests in Southern Taiwan, including coastal forests, have been predominantly invaded by white leadtrees [15, 17]. For biodiversity and land sustainability purposes, clearcutting of these invasive trees and the subsequent restoration of native forests have been advocated by Taiwan Forestry Research Institute [18].
The total area of the KNP where the level of invasion by white leadtrees is considered to be severe (i.e., >75%) is approximately 1,000 ha, which includes approximately 190 ha of general protected areas. To enhance biodiversity in some of the protected coastal areas of the KNP, clearcutting of white leadtrees and the subsequent restoration of native forests have been ongoing since 2008. However, quantitative estimation of soil loss and spatial distribution has seldom been conducted during this period. Moreover, clarifying the spatial variation of soil loss and the properties of soil prior to restoration is critical. Therefore, this study evaluated the soil erosion in these coastal forests immediately after clearcutting was completed.
2. Materials and Method
2.1. Environmental Setting
This study was conducted on a raised coral reef terrace (near 120°42.0′E; 21°59.9′N) covered with fluvial sediment in the KNP in Southwestern Taiwan (Figure 1). The area of the study site is approximately 2.2 ha (80 × 280 m). The terraces along the coastal areas of Southern Taiwan are approximately 5–20 m above sea level and are surrounded mainly by modern coral reefs (early Holocene) and fluvial sediment. On average, these terraces have a homogenous slope gradient of 5%. The climate is characterized by high temperatures and humidity levels. The mean annual temperature is 26°C, with average temperatures ranging from 27°C in July to 18°C in January. The annual rainfall, which ranges from 1,800 to 2,400 mm, predominantly precipitates from May to September. The northeastern monsoon winds that follow prevail until the following March [19]. Soils in the area have a udic moisture regime and hyperthermic soil temperature regime. Erosion of the overlying fluvial sediment by heavy rainfall has created a shallow soil depth and outcropping of the coral reefs in the coastal terraces. The soils in the studied area have been classified as Udipsamment and Dystrudepts according to the United States Soil Taxonomy [20].

Map of Taiwan indicating the location of the studied area.
2.2. Investigation of Vegetation Properties before Clearcutting
In the study site, before clear felling of the white leadtrees, the stand density of the diameter of breast height (DBH) exceeding 1 cm was 7,645 trees ha−1 and the basal area was 18.4 m2 ha−1. For the unfelling stand, the stand density of the white leadtrees was 5,504 trees ha−1 (approximately 75% of the unfelling stand), and the basal area was 8.6 m2 ha−1. In addition to the white leadtrees, the stand was also dominated by Broussonetia papyrifera (L.) L’ Herit. ex Vent., Melanolepis multiglandulosa (Reinw.) Reich. f. & Zoll., Macaranga tanarius (L.) Muell.-Arg., Ehretia dicksonii Hance, and E. resinosa Hance.
2.3. Measurements and Soil Sampling in the Field
The soils were sampled between clearcutting the white leadtrees and establishing the next stand of trees (during May and June, 2008). Soil samples were systematically collected by adopting a grid method in a 15 × 15 m grid; subsequently, 142 surface soil samples were collected for physical and chemical analyses. Soil depth was network-determined by using a spiral auger to drill to the parent materials at each sampling site. The auger has 38 mm dia. × 102 mm long auger bit and total length of auger was 915 mm. Nearby the drilled hole of soil depth determining, two stainless steel cores (50 mm inner dia. × 60 mm height) were used to determine bulk density of surface soil [29]. Soil water contents in dry season and wet season were estimated by time domain reflectometer, TDR (TRIME-PICO64, IMOK, Germany) in situ. Approximately 200 g of soil (0–15 cm) was also collected for further soil analysis of such characteristics as pH level, soil water content, texture, and soil organic carbon (SOC) content. Soil water content was determined by adopting a gravimetric method, and particle size distribution was determined using the pipette method [30]. The pH values of air-dried samples (<2 mm) were determined by placing a glass electrode in a mixture of soil and deionized water [31]. Finally, the SOC content was determined using the Walkley–Black wet oxidation method [32].
2.4. Clearcutting of White Leadtrees and Restoration of Indigenous Vegetation
Clear felling of the invasive white leadtrees was conducted in May, 2008. The selected logging method was artificial felling by using electric saws, and the logging residues of the white leadtrees were removed from the studied forest by hand (Figure 1). The studied area was divided into four subblocks (Blocks A–D), and the mortality ratio of each tree species and growing conditions were investigated in each block. In the study site, 26 rows of the white leadtrees were reserved to provide shade for growing seedlings. The seedlings of indigenous species were planted in June and July 2008, and the planted density was approximately 1,530 trees ha−1. An investigation of the canopy cover, ground cover, and growing conditions of the planted indigenous trees was conducted 4 and 16 months after the seedlings were planted.
After clearcutting the white leadtrees, the forest cover was reduced from 85% to 55%, and the cover of the understory was reduced from 50% to 30%. The aforementioned residual native trees accounted for 55% of the forest cover. Lantana camara, Bidens pilosa, Maytenus diversifolia (Maxim.) Ding Hou, Zehneria mucronata (Blume) Miq., and Passiflora foetida L. dominated the residual understory. A permanent line-intercept transect method was adopted to evaluate the vegetation and ground cover [33]. Ten 80 m lines were arranged across the experimental site to determine the percentage of vegetation cover, and another ten lines were arranged to determine the percentage of ground cover.
2.5. Soil Erosion Rate and Eroded Soil Depth
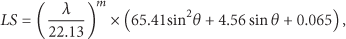
The soil erosion rate was calculated using the universal soil loss equation (USLE), which is a model derived empirically from approximately 10,000 plot-years of data [34], and can be used to predict erosion at any location in a watershed. The USLE is expressed as follows:

The value of R was estimated using a method employed in [35], in which the estimation was based on data sets from 200 meteorological stations in Taiwan. The length and slope steepness factor (
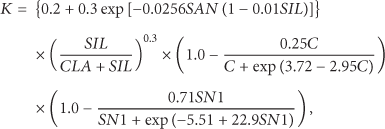
The soil erodibility factor K was calculated using the erosion-productivity impact calculator (EPIC), which is a crop model for quantifying the effects of wind and water erosion on soil productivity [36]. The EPIC model has matured into a terrestrial ecosystem model that can apply in simulating soil erosion for over 20 years [14, 37, 38]. The values for K were obtained using the following equation:
2.6. Statistical Analysis
All data were analyzed using SPSS Version 12.0 for Windows (SPSS Inc., USA). One-way ANOVA and post hoc comparison tests were performed to compare the soil properties (soil depth, bulk density, water content, SOC content, and pH level, as well as the proportion of sand, silt, and clay content) in each subblock. Differences between the mean values were identified using Duncan's multiple range test.
3. Results and Discussion
3.1. Soil Properties
Table 1 lists the soil properties. The studied soils were shallow, and the mean low bulk density was approximately 1.0 Mg m−3. The soil water content was lower in the dry season (from October to March) than in the wet season (from April to September) (2.3%–23% versus 11%–49%, resp.). The soil pH was ranged from neutral to slightly alkaline. The mean SOC content was approximately 3.6%. Regarding the soil particle size distribution, various textures were observed, ranging from sandy loam to silt clay. On average, the proportion of sand, silt, and clay in the soil was 44%, 29%, and 27%, respectively. All soil properties show spatial structure according to their semivariograms (Figure 2). In addition, Figure 3 shows the spatial distribution of the soil properties in the studied area. The soil depth, bulk density, and proportion of sand in the soil gradually decreased from north to south in the studied area. By contrast, the soil pH, water content, SOC content, and proportion of silt and clay increased from north to south, indicating that the soil properties were spatially heterogeneous in the studied area.
Soil characteristics and indigenous plants in the four subblocks in the studied area.

bThe wet season is from May to September.
The values followed by different letters in the same row mean significantly different from each other (P < 0.05).

Semivariograms of the individual soil properties in the studied area: (a) depth, (b) bulk density, (c) water content, (d) pH, (e) organic carbon content, (f) sand, (g) silt, and (h) clay.

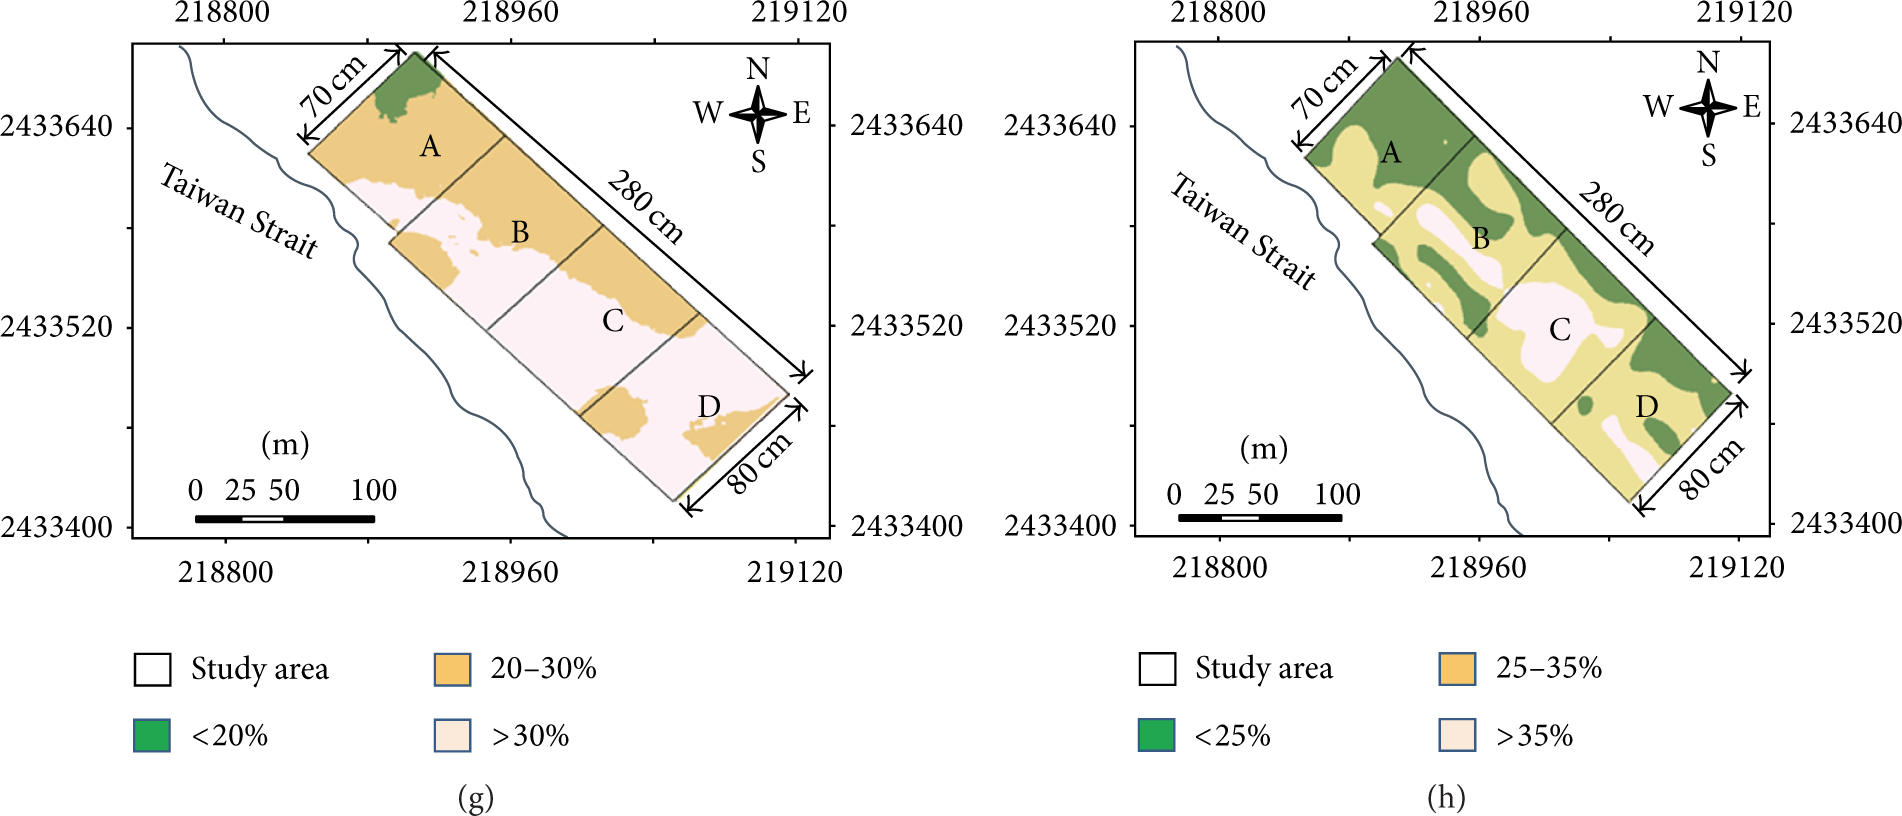
Spatial distribution of (a) depth, (b) bulk density, (c) pH, (d) water content, (e) organic carbon contents, (f) sand, (g) silt, and (h) clay.
3.2. Soil Erosion Potential after Clearcutting of Invasive Trees
Although the soil erosion rates were not determined directly, the estimated soil erosion rate was considered to be valid because it was calculated using the USLE, which has been adopted in many countries [22, 24], including Taiwan [39, 40].
The soil erodibility factor (K factor) ranged from 0.0358 to 0.0394, which was slightly higher than the estimated values for soils with similar texture in nearby areas [39]. The estimated soil erosion rate ranged from 21 to 249 tons ha−1 yr−1 with mean values of
Environmental setting and soil erosion rate in various countries with dissimilar climates.

Regarding the soil erosion rates in the studied area, rainfall erosivity (R) was high in the studied site (23,441 MJ mm ha−1 hr−1 yr−1), indicating that rainfall erosivity is a major contributor to severe soil loss [35]. Furthermore, the slope gradients in the studied area are ranged from 3% to 10% (Figure 4), which is sufficient to cause soil erosion during the wet season, particularly in Block A (Figure 3). Apart from the high rainfall and slope gradient, high soil erosion rates might be attributable to poor plant cover after the clearcutting of invasive trees, at which point the forest cover was reduced from 85% to 55% in the studied site. Our assertion that the increased erosion rate was dependent on the amount of plant cover is in agreement with a report by Nunes et al. [44] on undercropped, afforested, shrub, and pastured lands in Portugal. Zhou et al. [45] also demonstrated a strong negative linear correlation between soil erosion and vegetation coverage (

Spatial distribution of (a) slope gradient, (b) soil erodibility factor, and (c) soil erosion rate.
3.3. Correlation between Erosion Rate and Soil Properties
Figures 3 and 4 depict the spatial heterogeneity of the soil properties and soil erosion potential in the studied area. The spatial distribution of the estimated soil erosion rate appears to correspond with the distribution of soil texture. Table 1 further indicates that the mean soil erosion rate is positively associated with the bulk density and proportion of sand in the soil. However, correlations between the soil erosion rate and SOC content, silt content, clay content, and gravel content were negative (Table 1; Figure 5). Our results contradict those reported by Duiker et al. [47] and Parysow et al. [10], who proposed that a high proportion of the sand in the soil might be macroporous, thus increasing the water conductivity and infiltration rate, which could reduce runoff and prevent soil erosion. The gravel content observed in this study might explain why the results in this study are in contrast to those reported by Duiker et al. [47], Parysow et al. [10], and Pérez-Rodríguez et al. [13]. The presence of coral gravel in the soil in the studied area might reduce the contact area between the soil surface and rainfall, which would further reduce water runoff rate. Furthermore, the soil erosion rates were considerably lower in the blocks with higher gravel content (Table 1).
Distribution of soil erosion rate, bulk density, SOC content, proportion of sand, silt, clay in the soil, and gravel content in the four subblocks.
The soil erosion rate negatively correlated with SOC content and the proportion of silt and clay in the soil (Table 1; Figure 5). The negative correlation between the SOC content and soil erosion rate is in agreement with the results reported in previous studies, indicating that the SOC could facilitate soil aggregative stability and reduce soil erodibility [14]. The statistical results of the present study suggest that soil erodibility is subject to soil texture, particularly to the proportion of sand and silt in the soil. This finding is in agreement with Parysow et al. [10], who suggested that sand, very fine sand, and silt can account for more than 60% of the variance of the soil erodibility factor K. The negative correlation between soil erosion rate and silt and clay contents might have resulted from the higher water-holding capacity of the soil samples with higher silt and clay content. The presence of fine silt and clay might have enhanced the water-holding capacity in the soil samples, thereby reducing the amount of runoff that would otherwise cause soil erosion [12].
3.4. Implications of Soil Erosion in Coastal Areas with Restored Vegetation
Based on our measurement of the soil properties and estimation of the spatial distribution of soil erosion potential in the studied area, the sites with a relatively high soil erosion rate and poor soil quality might have a considerable effect in reducing the efficiency with which indigenous plants are restored after clearcutting, particularly while the plants are seedlings. The current study involved conducting a network survey of the restored indigenous plants after 4 and 16 months of growth; the seedlings grew 0.2- to 1.7-fold (approximately 30 to 80 cm) after the 12-month study period, indicating that the closed canopy cover could not form within 1-2 years, which is in agreement with Paul et al. [48], who indicated that a closed canopy generally takes approximately 3–5 years to form after reforestation. Therefore, the influence of soil loss on vegetation growth might persist for at least 5 years.
After clearcutting, large soil loss resulting from heavy or extreme rainfall events impairs plant growth [49]. In this study, the highest annual eroded soil depth was 3.4 cm, and the mean annual eroded soil depth was 1.0 cm in Block A, 0.49 cm in Block B, 0.42 cm in Block C, and 0.44 cm in Block D (Table 1). Additionally, high soil erosion rates (>200 tons ha−1 yr−1) were observed in the relatively shallow soil areas in Block A (Figures 3 and 4), indicating that the 10 to 15 cm of surface soil might be eroded within 3–5 years in the studies site if the restored vegetation does not develop rapidly after clearcutting.
The investigated mortality ratio of each planted vegetation species is also shown in Table 3, which could reflect suitable species in areas with different soil erosion potential and soil properties. In Block A, which had the highest soil erosion rate among the 4 blocks, the higher mortality ratios of Ficus benjamina L., M. tanarius, and Scaevola taccada (Gaertner) Roxb were found compared to those in the C and D blocks. These plants also seem not to survive in the B Block, where the soils were characterized by low SOC contents. Regarding other indigenous plant species, Wang et al. [50] had indicated that Pongamia pinnata (L.) Pierre ex Merr., Pittosporum pentandrum (Blanco) Merr., Premna serratifolia L., Hibiscus tiliaceus, and Planchonella obovata (R. Br.) Pierre were sensitive to soil texture and moisture stress in the same studied area in this study.
Mortality rate of indigenous seedlings in the four subblocks in the studied area.

Values higher than 0.6 are marked in bold.
Values in parentheses represent the number of planted trees.
As a whole, a high soil erosion rate and low SOC contents likely limit the growth of planted indigenous plants in this study. Additionally, the soils with high amounts of silt or clay fractions also required a special attention because these soils might limit available water obtainment from the soils for the restored plants [50]. Therefore, selecting indigenous species with rapid growing rate to quickly increase canopy cover in the areas with high soil erosion rates and plant drought-resistant species in the areas with high contents of silt and clay fractions might be the feasible practices to greatly increase the efficiency of restoration in the future.
4. Conclusion
High soil erosion potential (21 to 249 tons ha−1 yr−1) was estimated using the USLE, and the spatial heterogeneity of the soil properties in the coastal areas after clearcutting was confirmed using the network data set. After clearcutting, inadequate plant cover, including both the canopy and ground cover, accelerated the soil erosion in the studied area. The results indicate that soil erosion, low SOC content, and soil texture contributed to reducing the efficiency of indigenous plant restoration in the coastal areas. Therefore, the measurement of the soil properties and the spatial distribution of soil erosion potential could increase efficiency and reduce the cost of future restoration of native plants in coastal landscapes near coral reefs.
Footnotes
Conflict of Interests
The authors declare that there is no conflict of interests regarding the publication of this paper.
Acknowledgments
The authors thank the KNP Headquarters of Taiwan for financially supporting this research (Contract no. 124-99-01). The authors also express their appreciation to the Taiwan Forestry Research Institute for supporting this research.