
Abstract
Compressive sensing (CS) is a sub-Nyquist sampling way while still enabling exact reconstruction, which is applicable to WMSN. In this paper, based on the characteristic of CS video in WMSN, we proposed a hierarchical objective CS video quality assessment (HOCSVQA) approach to get CS video quality index (CSVQI) from three levels, measurement level, stream level, and packet level, respectively. This approach cannot only keep the convenience and real-time characteristic of objective video assessment, but also reflect the QoE to a certain extent due to the coefficients regressed from subjective video assessment experiments. A set of experiments on subjective CS video quality assessment and another set of verification experiments are designed and settled. The CS video quality index, CSVQI, assessed by the model we proposed maintained a high correlation with data from verification experiments under statistical correlation measure.
1. Introduction
Compressive sensing (CS), as an emerging way of data acquisition, has already aroused the concern of the signal processing circles. In the framework of CS theory [1–4], sparse signal, also known as compressible signal with respect to sparse transform, can be sampled at sub-Nyquist rates while still enabling exact reconstruction of the original signal. Compared with local sampling way of classic Nyquist sampling theorem, the entire extent of signal is observed via linear random projection called sensing matrix as a small set of measurements, which can be viewed as a global sampling way to acquire and compress data. Moreover, CS fits low-consumption and low-complexity image/video acquisition systems, especially for WMSN (wireless multimedia sensor network), because of the breaking of the Nyquist rate limitation and combination of sampling and compression. CS-based video processing, which is called CS video in this paper, has been studied [5–10] in recent years with dramatic prospects.
For sensor network, wireless channel transmission performance index is very important to transmission quality assurance. For video content network, video quality index can be used as network performance to optimize the network. There still exists a long distance between the CS theory and video application service in sensor network. How to evaluate the CS video quality in sensor network is a special issue to be solved. In conventional video signal processing system, many practical video quality assessment (VQA) algorithms [11–13] can be used to evaluate, control, and improve the perceptual quality of video signal, which is also an important part of the CS video processing. The CS video codec scheme is different from the conventional scheme essentially, and current reconstruction algorithms [14, 15] for CS video employed Peak Signal-to-Noise Ratio (PSNR) as video recovery quality metric generally which is only signal fidelity measure and not correlated with human perception of quality [16]. Therefore, to solve the CS video quality evaluation problem, an effective and practical metric is needed, which focuses no longer on measurable physical distorted quantities but rather on how the video quality experienced subjectively, that is, the Quality of Experience (QoE), in other words, in contrast to the Quality of Service (QoS). More importantly, this metric must meet the characteristic of the CS video signal. A CS video quality evaluation approach based on redundant measurements was proposed in our previous work [17]. And a parity-based error control method for CS video quality improvement was also proposed [18].
In this paper, we proposed a hierarchical objective CS video quality assessment (HOCSVQA) approach to get CS video quality index (CSVQI) for WMSN. The first step in defining our video quality assessment model is to determine the principal components from three levels, measurement level, stream level, and packet level, respectively. And then, to obtain the coefficients in the video quality assessment model by means of regression analysis, a set of experiments on subjective CS video quality and another set of verification experiments are designed and settled. Finally, the CS video quality index, CSVQI, assessed by the model we proposed maintains a high correlation with data from verification experiments under statistical correlation measure. The video quality index of different levels has different application; stream level index can be used for rate control, packet level for error-resistance, and measurement level for CS-based video coding, respectively. At the same time, they also can be used together to acquire video quality information.
The remainder of this paper is organized as follows. Section 2 gives brief overviews of the CS theory, CS video framework, and video quality assessment. Section 3 presents the proposed HOCSVQA approach and hierarchical video quality assessment model. And Section 4 presents preparation and procedure of the subjective CS quality assessment experiments. Experimental results are illustrated in Section 5. Section 6 concludes and provides some further discussion.
2. Related Work
2.1. Compressive Sensing Theory
The CS theory [1–4] as a new research focus gives a novel set of theoretical framework about signal representation, sampling, and reconstruction. It points out that if the signal


Compressive sampling framework.
Sparsification, measurement matrix, and reconstruction algorithm in the above steps are three key parts of CS theory.
2.2. The CS Video
In addition to the benefits of sampling rate and consumption, unstructured presentation of signal as another advantage for CS applied to video signal reflects in measurements so that video can withstand a certain packet loss. The CS video was first proposed in [5], called as compressive video sampling, where each video block is divided into either sparse or nonsparse. A series of studies on block-based CS video were conducted by Fowler et al. [6, 7]. On the other side, distributed CS video [9, 10], combining CS theory and distributed source coding (DSC), shifts the complicated motion estimation from encoder to decoder, which leads to consumption reduction further at encoder. The research contents in these literatures are called as CS video in this paper, differentiated from the conventional video.
As applied to video, however, the CS still faces several challenges including not good enough reconstruction quality with computationally expensive process and huge memory required to store the random measurement matrix.
2.3. Video Quality Assessment
Video quality assessment methods are basically classified into two categories: subjective quality assessment and objective quality assessment. The essential factor of subjective quality assessment is rating the perceived video quality by a group of subjects with certain environmental requirements, and most of these methods are based on Absolute Category Rating (ACR) recommended by ITU-T P.910 [20]. High accuracy of quality in terms of human perception, also regarded as QoE, is provided in subjective quality assessment but with high cost and non-real-time limitation. Objective quality assessment evaluates the video streaming quality by the function related to some parameter which is measurable. Objective quality assessment methods are classified into three categories based on existence of reference video information: Full Reference (FR), Reduced Reference (RR), and No Reference (NR). Mean Square Error (MSE) and Peak Signal-to-Noise Ratio (PSNR) taken as examples compare pixel-to-pixel with reference. Commonly, objective methods are convenient and real time but not correlated with QoE. Video Quality Metrics (VQM) and Video Structural Similarity (VSSIM) [11, 12] are active objective quality assessment methods.
From the perspective of practical value, what we need most for VQA is NR or RR objective quality assessment method in reality. The HOCSVQA we proposed agrees well with this characteristic. Meanwhile, coefficients in the model are obtained by regression analysis from subjective experiments, so the quality index, CSVQI, assessed by our model meets QoE requirement.
3. The Hierarchical Objective CS Video Quality Assessment Model
There are many factors affecting the perceived quality of video, including bit rate, frame rate, network service quality, resolution, video format, delay, and jitter. From the perspective of practical experience, data volume per second video bearing is the most important factor of influence on the quality of video. Meanwhile, it can also be described as the amount of information received at video viewing end. Thus what we focused on in the paper is this type of degradation factors used as CS video quality assessment model parameters. The quality assessment model we proposed is instructive and appropriate for other degradation factors like delay and jitter under condition of degradation quantities and simulation of distortion.
For the purpose of low-consumption and low-complexity of CS video at encoder, which is our study emphasis, video quality assessment model should be objective and straightforward (without reference). And parameters selected in the model should be also supported by low-complexity.
In view of the difference from conventional video encoding, measurement parameters of CS video would be selected as primary elements. The CS video is also a form of media stream so that parameters in stream level would be taken into account. Then, with the concerning of impact on quality of network service, packet loss, as packet level parameter, should be got involved in our model. In summary, we established appropriate empirical model of CS video quality degradation as the hierarchical objective CS video quality assessment (HOCSVQA) model from above three levels, measurement level, streaming level, and packet level, respectively.
The hierarchical model we proposed is based on subjective CS video quality assessment experiments. Subjects were organized to assess the Mean Opinion Score (MOS) of each CS video sequence sample quality. The specific coefficients of this model were acquired from multivariate nonlinear regression analysis afterwards. The CSVQI, reached from the model, was objectively verified by corresponding verification experiments. The model and experiments are shown in Figure 2.

The HOCSVQA model and design of experiments.
3.1. Measurement Level
At measurement level, we selected measurement rate per each frame and measurement quantization step, which is bit number per each measurement, as parameters. These two parameters are special in CS video and exhibit the different features from conventional video as well. Linearity between measurement rate and quality can be seen clearly from the Figure 3, which describes relationship between reconstruction quality of 30th frame of “coastguard” video sequence and measurement rate. Figure 4 describes the probability distribution of measurements value of 30th frame of “coastguard” with 10000 measurements. From this we can see that measurements value exists between −204 and 246 and basically fits the Gaussian distribution. Accordingly, initial empirical model at measurement level was assumed as


Reconstruction quality of 30th frame of “coastguard” with different measurement rate.
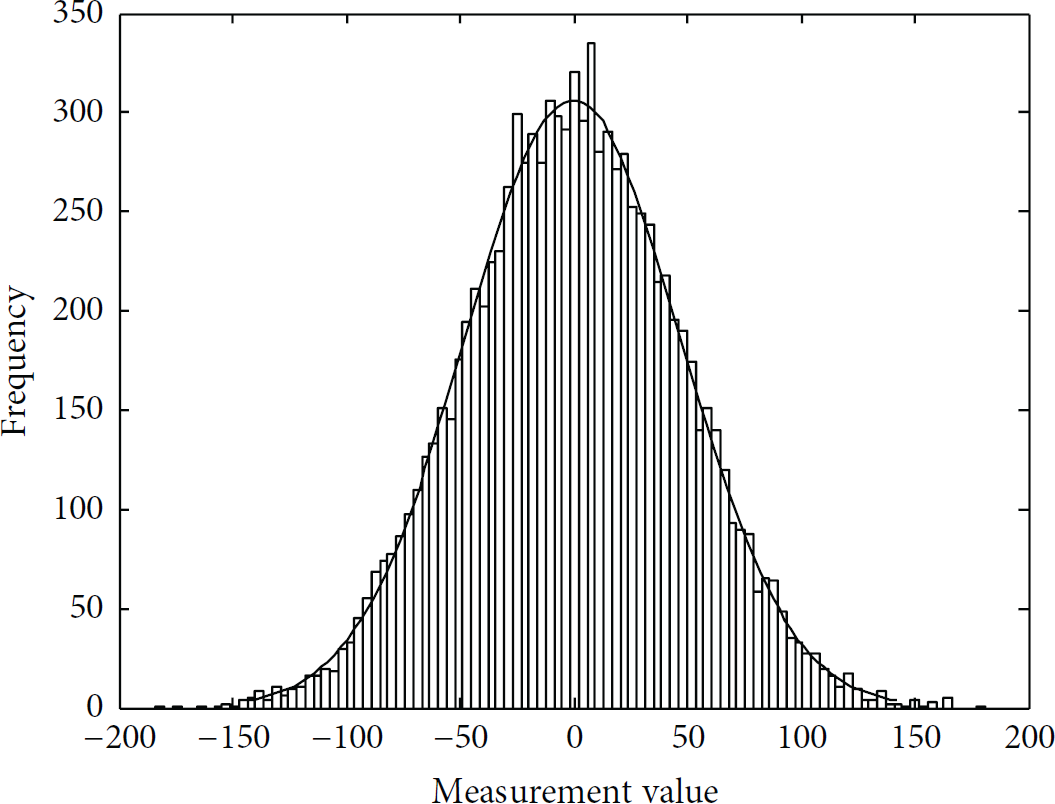
Probability distribution of measurements value of 30th frame of “coastguard.”
3.2. Stream Level
As mentioned previously, bit rate and frame rate impact the quality in stream level and are easy to get in the video system, which is consistent with the traditional video stream. They are added to communication protocols at the beginning of video stream and are the knowledge of sending end and receiving end. Empirical model at stream level was assumed as

3.3. Packet Level
In packet level, the main parameter affecting quality is certainly packet loss rate. Empirical model at packet level was assumed as

How to packet the video data for production of gradual degradation video materials depends on specific communication protocol, which is not our main issue to consider. We employed full block line packet form for CS video, shown in Figure 5.

Full block line packet form for CS video.
From the data analysis in next section, it is observed that the model possesses high correlation between video material in experiments and practical utility due to the close similarity with the verification experiment results.
The hierarchical model can be applied as a single level model in special applications, such as rate control, error-resistance, or CS-based video coding, and also can be applied as a whole, as shown in following expression:

4. Design of the Experiments
Two sets of experiments were designed in total. One is for acquiring the coefficients of model proposed by regression analysis with experimental data; the other is verification experiments. They are referred to as experiment A and experiment B for short. In the following, experiment environment, material, methodology, and subjects are given in detail, respectively.
4.1. Experiment Environment
Experiments were performed in a quiet room without any noises and view conditions were according to ITU standards [21]. Surface RT is employed for degraded CS video view test, with 10.6′′ IPS screen size, 1366 × 768 resolution, and 148 PPI. Data statistics and analysis proceeded in MATLAB R2012a.
4.2. Experiment Material
Experiment materials were collected from http://xiph.org/ video test media [22]. The video sequences “Akiyo,” “Claire,” “Deadline,” “Grandma,” “Silent,” and “Suzie” were adopted, shown in Figure 6. All of these “head and shoulder” sequences are on the basis that it is representative of low motion and low complexity. Main content in video is one speaker situated at some kind background, and therefore the focus of attention is primarily on the speaker. The main reason for that is different perceptual sensitivity for different video content viewed by subjects. For instance, fast-motion content video, like soccer, has more than one focus, such as moving ball, feature of athletes, and location of athletes. If these focuses have degraded slightly, the overall perceptual quality of video will degrade greatly. In addition, fast-motion content video quality is lower than head and shoulder video at the same rate. Hence, these video sequences which have unified content were adopted in our experiments.

(a)–(f) are original 1st frame in video sequences “Akiyo,” “Claire,” “Deadline,” “Grandma,” “Silent,” and “Suzie,” respectively.
Each test sample was clipped from these video sequences described as above. Duration of each was set as 10 seconds, and QCIF (Quarter Common Intermediate Format) is determined as resolution format, in consideration of computing speed and massive computing tasks for degraded video production. 10 seconds is sufficient enough for subjects to arrive at reliable quality rating [23]. In order to eliminate the video colors interference for subjective quality, each test sample was turned into gray scale.
In CS procedure of degraded video production, scrambled block Hadamard ensemble (SBHE) [24] and smooth projected Landweber (SPL) [25] were selected as measurement operator and reconstruction algorithm. Block size in each frame of video is set as 8 × 8.
Based on the empirical quality model proposed above, different degraded videos possessing different parameters were constructed in measurement, stream, and packet level. 0.2, 0.25, 0.3, 0.35, 0.4, 0.45, 0.5, 0.55, and 0.6 were taken as measurement rate per each frame and 6, 7, 8, 9, 10, and 11 as quantization steps; two main parameters combined and produced a total of 54 samples. Meanwhile, frame rate is set as 25 fps in measurement level for experiment A. 0.25, 0.35, 0.45, and 0.55 were taken as variation range of measurement rate per each frame and produced a total of 24 samples in measurement level for experiment B. 0.9, 1.15, 1.4, 1.65, 1.9, 2.15, 2.4, 2.65, 2.9, and 3.15 Mbps were taken as bit rate per each test sample and 10, 15, 20, 25, and 30 fps as frame rate; two main parameters combined and produced a total of 50 samples. Meanwhile, quantization step was set as 9, and measurement rate per each frame was set as 0.4 in stream level for experiment A. 1.15, 1.65, 2.15, and 2.65 were taken as variation range of bit rate per each sample and produced a total of 20 samples in stream level for experiment B. 0.056, 0.111, 0.167, 0.222, 0.278, 0.333, 0.389, and 0.444 were taken as packet loss rate per each frame and produced a total of 8 samples in packet level for both experiment A and experiment B; meanwhile, quantization step was set as 9, measurement rate per each frame was set as 0.4, and frame rate was set as 25 fps. Specific experiment data was shown in Tables 1–5. Some degraded samples were shown in Figure 7.
CS video subjective rating scores with different measurement rate and Q-step in experiment A.

CS video subjective rating scores with different measurement rate and Q-step in experiment B.

CS video subjective rating scores with different bit rate and frame rate in experiment A.

CS video subjective rating scores with different bit rate and frame rate in experiment B.

CS video subjective rating scores with different packet loss rate in experiments A and B.


(a) The degraded 30th frame in “Akiyo” with
4.3. Experiment Methodology
The double stimulus continuous quality scale (DSCQS) methodology was used throughout experiment A. This methodology is a standardized subjective quality assessment technique. The reference signal is needed for quality assessment. Each test consists of two video presentations, one is the reference (undegraded source material), and the other is the typical degraded material for quality rating. Both presentations are identical in content. Quality ratings of both of them were provided by subjects. Subjects did not know which is reference or the degraded one, and that is to say, the order of presentation in one test was randomized.
Continuous rating scale was employed in quality rating, shown in Figure 8. This scale was electronically presented in monitor after subjects finished test viewing, and subjects moved the pointer to provide the rating. The range of this scale is from 0 to 100. The pointer is relocated in the middle of scale at each time test prepared.

Continuous rating scale for subjective experiments.
The single stimulus 5-grade quality scale methodology (SSQS) was used throughout experiment B. Each test has one typical degraded sample for quality rating by subjects. 5-grade category rating scale (excellent, good, fair, poor, and bad) was employed in rating. This scale is the same as described above, presented in monitor, and pointer was moved to rate. The difference is that subjects can only see the rough scale, 5 termed excellent and 1 termed bad. But they were informed that the pointer can be moved at the position between two grades, so we can read more accurate rating with two decimals which was hidden to subjects.
Summarizing above, in experiment A, DSCQS is kind of delicate quality rating method with reference; the rating scores were used to model regression analysis. Reference existence is to distinguish the degree of degradation more carefully. While, in experiment B, rating scores from SSQS were used to prove the validity of the model, no reference is to meet the normal viewing conditions. Here, the difference score of two presentations in experiment A was needed to be calculated, and the larger value means the poorer perceptual quality. In order to unify the results of two experiments, data in experiment A was converted into 5-grade scale in experiment B by the following formula:

For all experiments, subjects were introduced to the experiment procedure and declared to understand the goal of experiments. The order of degraded video sample for each test was randomly assigned. Each test in both experiment A and experiment B was repeated 5 times by different 5 subjects; the average score by 5 subjects was taken as this test final score. Each test began with two practice trials for subjects to become familiar with the experiments, and, at the end of each test, we documented the scores.
4.4. Subjects
All subjects in experiment were author's undergraduate schoolmates, with college-educated experience, while being without professional knowledge of image or multimedia. None of them were working in the field of image or multimedia. It is because subjective experience would have corresponding interference with the results if they were familiar with pattern of video error. All of them were male so that subjective gender difference interference would be eliminated. And the age range of them was between 24 and 30.
5. Experimental Data and Analysis
Data in Tables 1–5 is CS video subjective rating scores with different parameters acquired from subjective quality assessment experiments A and B. Based on the data in experiment A and quality model proposed previously, coefficients in model were regressed by data analysis at measurement level, stream level, and packet level, respectively. Then, models at three levels regressed are shown as follows:


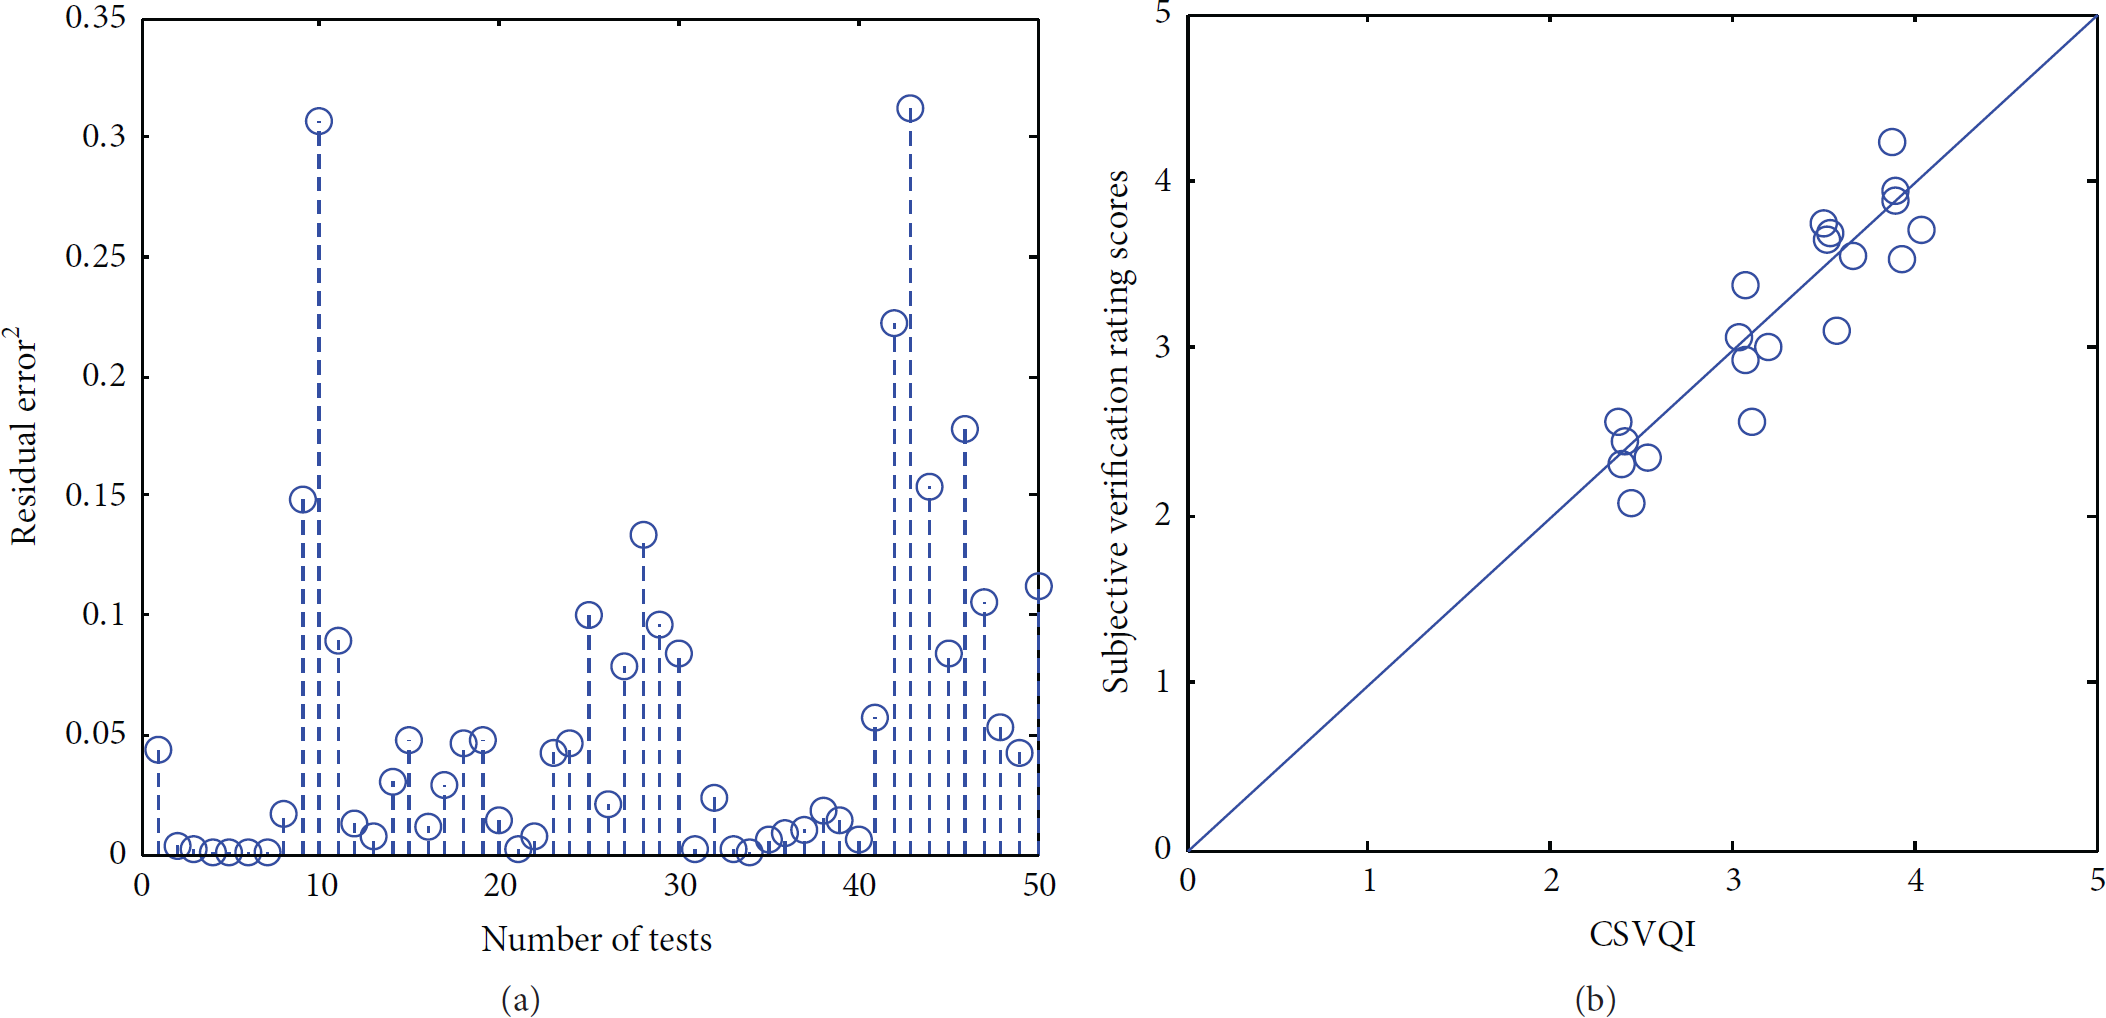
(a) Figures 9–11 show the square residuals of regression at three levels to indicate the accuracy of regression. At stream level, parts of square residuals are numerically large because of binary and nonlinearity of regression at this level. At packet level, square residuals keep being small, which presents a good regression effect. That is because number of samples used to regress at this level is less. (b) Figures 9–11 show the comparison between subjective verification rating scores and CSVQI achieved by the CS quality model we proposed. The distance of the circles to the diagonal line in picture indicates the approximation between two sets of data. It can be seen that the CSVQI assessed by the model we proposed maintains a high correlation with data from verification experiments in the picture. And validity of the model has also been verified.

(a) Square residuals of regression at measurement level; (b) subjective verification rating scores comparing with CSVQI at measurement level.
(a) Square residuals of regression at stream level; (b) subjective verification rating scores comparing with CSVQI at stream level.

(a) Square residuals of regression at packet level; (b) subjective verification rating scores comparing with CSVQI at packet level.
From the perspective of statistics, we also employed Pearson correlation coefficient (10) and spearman rank correlation coefficient (11) to prove correlation between CSVQI and data from verification experiments, shown in Table 6. The more close to 1 the coefficient is, the more correlated the two sets of data are. Consider
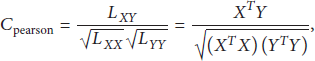

Pearson correlation coefficient and Spearman rank correlation coefficient at three levels.

6. Conclusion
In this paper, we proposed a hierarchical objective CS video quality assessment (HOCSVQA) approach to get CS video quality index (CSVQI). CS video quality model chose measurement rate, quantization step, bit rate, frame rate, and packet loss rate as principal parameters from three levels, measurement level, stream level, and packet level, respectively. The coefficients in the model were obtained by regression analysis of data from subjective CS video quality assessment experiments. The CS video quality index, CSVQI, assessed by the model we proposed maintained a high correlation with data from verification experiments under statistical correlation measure and was illustrated in Figures 9–11. This approach not only can keep the convenience and real-time characteristic of objective video assessment, but also reflects the QoE to a certain extent due to the coefficients regressed from subjective video assessment experiments.
Nowadays CS is on its growing stage, and a lot of achievements have been made on the theoretical part. However, on account of difference of information form between CS system and traditional system, there still exists a mass of technical issues to be solved. And device realization of CS data acquisition is the very problem attaching much attention. There is a long way to go before putting it into practice. How to evaluate and guarantee the quality of information transmission in CS system is the key point in this paper and also the focus in our future research work.
Footnotes
Conflict of Interests
The authors, Shouning Chen, Baoyu Zheng, and Yujuan Zhao, declare that there is no conflict of interests regarding the publication of this paper.
Acknowledgments
This research was supported by the National Science Foundation of China (61271240); Innovation Project of Sci & Tech for College Graduates of Jiangsu Province (CXLX12 0475); A Project Funded by the Priority Academic Program Development of Jiangsu Higher Education Institutions; Specialized Research Fund for the Doctoral Program of Higher Education (20113223120002); and University Natural Science Research Project of Jiangsu Province (11KJB510016). The authors express their thanks to participants and organizer in the experiments.