
Abstract
The effect of climate change and human activities leads to a series of dangerous phenomena, such as landslides and flood. In such a context, building a system to monitor environmental hazards is seriously needed. Some studies propose to use wireless sensor network (WSN) technique for landslide monitoring systems. Two important factors for these systems are the flexibility and the energy management. This paper focuses on the development of a flexible and efficient WSN for detecting rainfall-induced landslides. A flexible switching between star and tree topologies is used to adapt to weather conditions in order to maximize the reliability of the transmission. Moreover, the power management is designed concurrently with the weather condition to improve both the operation reliability and the power efficiency. The performance of our designed WSN is evaluated by both simulation and outdoor experiment. Detailed calculation of the power budget is presented thoughtfully to confirm the effectiveness of the proposed scheme.
1. Introduction
The landslide is one of serious hazards in many countries [1]. There were some landslide monitoring systems built to monitor and predict this hazard. These systems can split into two groups: long term and short term monitoring. For short term monitoring systems, wireless sensor networks (WSNs) have proved their advantages such as real-time monitoring of different geographical regions, remote monitoring, and the system being easily extended [1–3]. There are methods proposed to monitor and/or predict landslides. For example, in [2], the authors use the slip surface localization method for detecting landslide. Their proposed sensor network uses instruments to detect the slope movements and then estimate the displacements of sensor nodes embedded in the slope. In [4], the authors propose an analysis of seepage and instability mechanisms to evaluate the potential for slope failure. The reconstruction of pore water pressure changes within the analyzed sections allows an accurate analysis of slope stability conditions. In [5], the saturated hydraulic conductivity is considered as a random field and once coupled with Monte-Carlo simulations, it is possible to determine the failure probability and then deduce the landslide risk. The rainfall-induced landslide risks of some slopes having different triggering mechanism are studied. In our work, we are rather focusing on designing networks that can deliver all necessary physical parameters to be used in all detection and prediction algorithms. Implementing any algorithm for predicting landslide events will be presented in a sequel paper.
The lifetime of the WSN is very important for the landslide monitoring system, because we need that data collection and data transferring would not be interrupted during a warranted operating time. This lifetime is almost decided by the energy consumption of WSN communication nodes. ZigBee standard, which is based on the IEEE 102.14.4 [6], has attracted researchers to use WSN due to its advantages such as power saving, reliability, short time delay, large network capacity, safety, and low cost of components. In terms of power saving, some studies have tried to optimize the power consumption of ZigBee based WSN [7, 8]. The work in [7] proposes a design and implementation of a wireless digital water meter with low power consumption. The selection of low power devices and the sleep mode offer a life time of 8 years. Some studies are proposed to improve the power consumption by modifying the routing protocol for ZigBee based WSN [9–11]. In [9], a new distributed clustering multihop protocol, namely, the Clustering and Multihop Protocol (CAMP), is proposed; in this protocol, the cluster heads are selected with sufficient amount of energy; these heads are dynamically changed and well connected. In [10], the authors are interested in the congestion problem; they use the simulation technique to study the performance of an AODV-based ZigBee routing protocol through pivots which aim to reduce the traffic congestion. In [11], the authors introduce a routing algorithm which combines Ad hoc On-Demand Distance Vector Routing Junior (AODVjr) with Cluster-Tree to reduce energy consumption. However, all these proposed systems [9–11] have not been embedded in commercial devices for practical implementation. Other studies focused on the deployment without paying attention to power saving aspect and/or to the change of the environment [2, 3]. It is quite natural to save power by reducing the rate of data sent to the data logger. However, in the bad weather (i.e., during the rain and 1-2 days after the rain), the data should be updated more frequently in order to track the situation at the field site. Thus, in this study, we propose a flexible and efficient configuration for networks designed for detecting rainfall-induced landslides. This configuration would enhance not only the power saving, but also the reliability of our WSN.
Our WSN system consists of sensor nodes that are capable of data acquisition, data storage, data processing, and wireless data transmission. The proposed WSN provides method to collect data on soil pore water pressure, moisture content, vibration of earth, soil movement, and temperature of the environment. The collection of data would be done in real time and transmitted continuously over long distance. There are two important factors affecting the developing of a WSN for landslide application: the flexibility and the energy management. Rainfall-induced landslides often occur in bad weather (e.g., rain, storm). Thus, a suitable switching technique should be established to adapt to the weather condition. Therefore, in the bad weather, the data should be sensed and transmitted more frequently to ensure that the system can track the site's status very well. In the normal condition, the data rate can be reduced to save the power. Obviously, the energy efficiency is always a problem for any WSN. In this paper, the power plan is designed concurrently with the weather condition to improve both the operational reliability and power efficiency of our system.
2. Working Principles
At each sensor node of the WSN, several geotechnical sensors would be integrated to form a sensor column. The sensor column will be buried underneath the earth for monitoring various parameters like soil pore water pressure, earth movements, and in situ stresses and strains. Generally, WSNs utilize spatially distributed autonomous sensors to monitor physical or environmental conditions, such as temperature, sound, and pressure. A WSN commonly has three levels of nodes: low level nodes (i.e., sensor columns), cluster heads, and gateway nodes (or sink nodes). The low level nodes work under each cluster head. Their data will then be forwarded to the cluster head. There is no processing step performed in any of the cluster heads. All of the higher level nodes will be receiving the data from the lower nodes and transmitting it to the successive higher level nodes. The cluster heads transmit the data to the sink node. In this paper, the sink node is connected to a data logger. Data would be preprocessed at the data logger and then further forwarded to a processing center. In [6], the authors design a low power consumption wireless digital water meter using ZigBee. With ZigBee nodes transmitting the collected data to the gateway, their hardware can last 8 years with dual batteries 3 V, 3000 mAh. However, they did not describe their specific protocol. In WSNs, communication protocols and network topologies have a strong impact on the network power consumption. In [9], the authors propose to use ZigBee technology based on IEEE 802.15.4 standard. With the tree topology, they affirm that their structure can operate up to 10 years by using low-cost batteries. Their system got a perfect result when it was deployed in the Cartuja Island in Seville [9]. Thus, the ZigBee technology is also chosen in this research. Based on the ZigBee technology, we refer to the hardware and software system as follows.
2.1. System Design
2.1.1. The Proposed WSN for Detecting Rainfall-Induced Landslides
The proposed WSN is shown in Figure 1 which consists of six wireless sensor nodes to measure parameters of the environment for landslide monitoring. For this kind of application, the WSN can be designed as star [8, 12] or tree network models [13]. The data will be sent to a data logger through a gateway from each node via XBee standard. The data received from the data logger is preprocessed and uploaded to a database on a web server over the Internet and/or GSM/GPRS. A real-time program would analyze the data to monitor and give an alert (if needed) to the designate persons about the probability of landslides.

Illustration of the system connection in our proposed WSN.
The data sent to the data logger is not only from sensor columns, but also from the rainfall intensity from a weather station. Rainfall is the most important factor for slope failures. There are several researches that have been performed to investigate the infiltration of rainwater into slopes and thus the dependence of slope stability on the water infiltration [5, 14]. In these works, the numerical modeling using Geo-Slope software is utilized to evaluate the slope stability under the rainfall condition [4]. In this paper, the model is also built with Geo-Slope employing the field survey data, and it is updated with real time data acquired from sensor nodes.
In our work, for detecting rainfall-induced landslides we propose a flexible and efficient configuration as illustrated in Figure 2. As our main concern here is rainfall-induced landslide detection, the rainfall intensity (
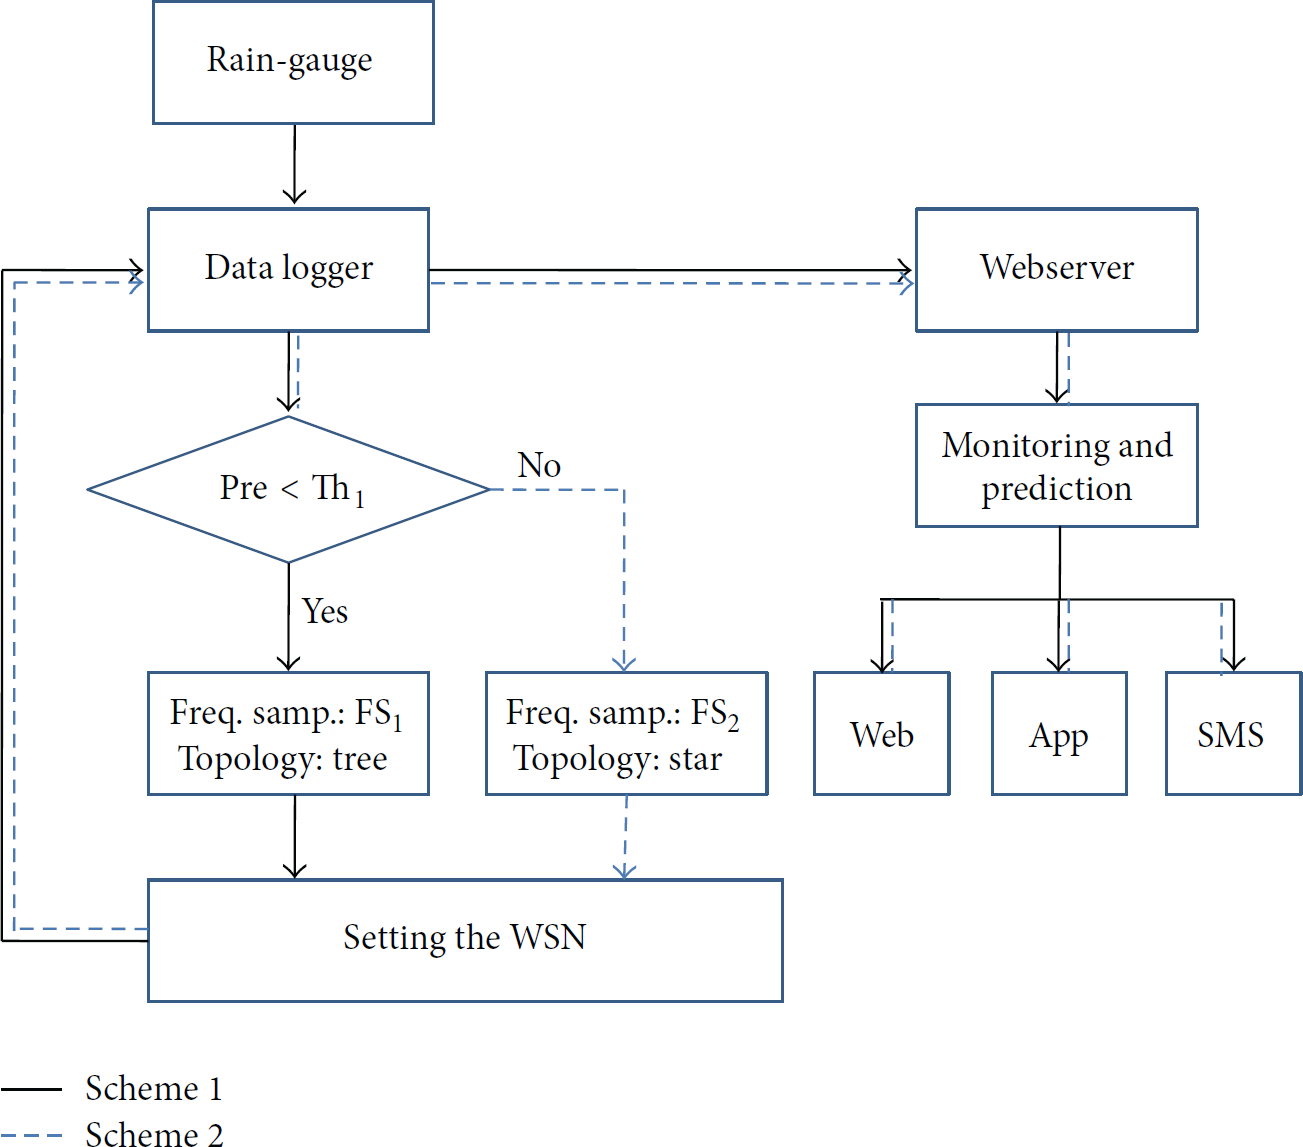
The working principle of the proposed WSN that shows the flexible configuration to the weather condition.

The illustration of placing sensor columns, the weather station, and the data logger in the proposed WSN.
2.1.2. Hardware Design of a Sensor Column
A sensor column consists of Waspmote board, battery, and gates to connect external sensors as shown in Figure 4. Figure 5 shows the photos of the complete sensor column. The sensors have been tested and calibrated carefully in order to remove the deterministic errors and reduce the stochastic errors [15].

Block diagram of a sensor column.
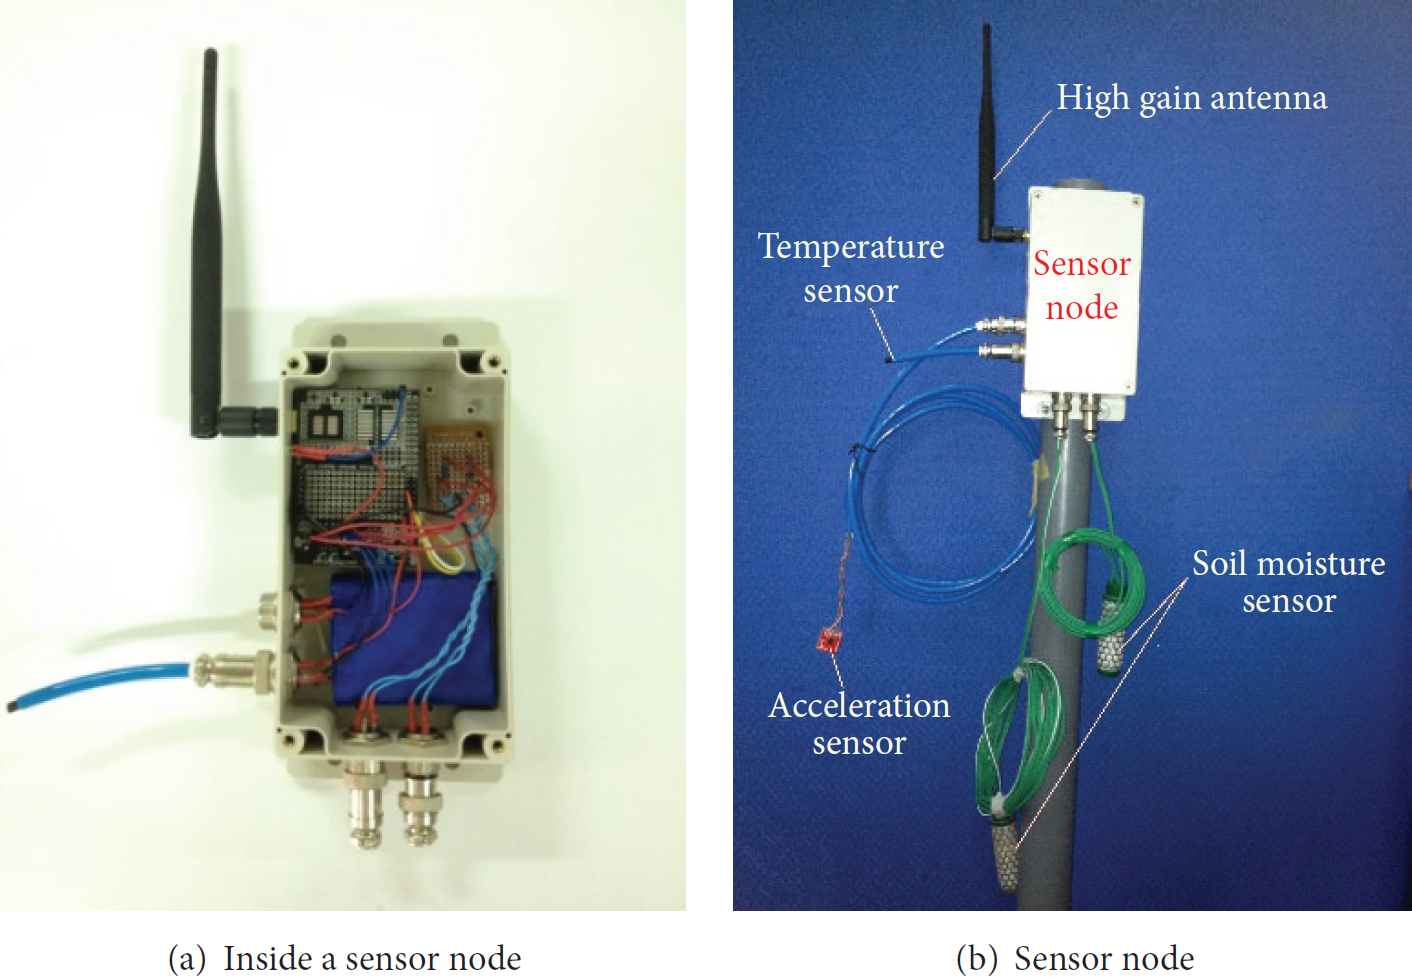
Photos of a sensor column.
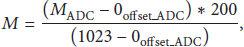
(1) Accelerometer. Geophones are commonly used to detect the motion for many years; they have many advantages such as no requirement of electrical power to operate and ability to detect extremely small ground displacements [16]. Recently, due to the strong grow of Micro-Electro-Mechanical-Systems (MEMS) technology, MEMS based sensors offer low cost, small size, and good quality. Consequently, MEMS based accelerometers can be used as a tilt meter and adequately replace the geophones [17]. In this research, the ADXL-335 accelerometer is used to measure the tilt, soil movement, and analysis vibration in the ground. ADXL-335 is small, low power, 3-axis accelerometer with the conditioned voltage output. Bandwidths of this accelerometer can be configured within a range of 0.5 Hz to 1600 Hz for x- and y-axes, and a range of 0.5 Hz to 550 Hz for the z-axes [18]. The formula for calculating acceleration following one axis is

(2) Soil Moisture Sensor. The dielectric permittivity of the soil is a function of the water content. Thus, the soil moisture sensor can use the resistance changing to measure the water content of soil. By inserting the rugged sensor into the soil, the volumetric water content of the soil is acquired. Figure 4 also shows the soil moisture sensor used in this study [19]. Soil moisture is calculated as follows:
(3) Temperature Sensor. The temperature sensor is used to measure changes in environment's temperature. The physical properties of soil and water change with temperature. Thus, the LM35 is integrated to the sensor column to measure the temperature of environment (see Figure 4). The LM35 is a high precision integrate-circuit temperature sensor, whose output voltage is linearly proportional to the temperature. The LM35 does not require any external calibration or trimming. It provides typical accuracies of ±1/4°C at room temperature and ±3/4°C over a full −55°C to +150°C temperature range [20]. The temperature is calculated as

(4) Wireless Communication: XBee. XBee is a wireless RF module using the wireless communication standard 802.15.4. It has longer range than Bluetooth but lower power consumption than WiFi (802.11). It has a 250 kbps radio frequency (RF) data rate and operates at 2.4 GHz [21, 22]. The XBee modules support the sleep modes for extending battery life.
(5) Microprocessor. The Atmega328 microprocessor is a member of the high-performance Atmel 8-bit AVR RISC-based microcontrollers [23]. It is used to receive and process observed data from sensors. The Atmega328 offers many special features suitable for building a WSN, such as high performance, low power AVR microcontroller, advanced RISC architecture up to 20 MIPS throughput at 20 MHz and 23 programmable
2.1.3. Weather Station WS-3000
Weather station WS-3000 consists of an anemometer, a wind vane, and a pluviometer [24]. All sensor columns are buried underneath the earth, but WS-3000 will be placed above ground. The pluviometer provides a digital signal whose frequency is proportional to the intensity of rainfall. In Figure 1, WS-3000 is connected directly to the data logger and will allow us to correlate rainfall rates and values with geotechnical sensors in the earth by the sensor columns. Particularly, in this paper, the rainfall intensity is utilized to control the operation of the WSN.
2.1.4. Wireless Software Architecture
The software modules implemented in WSN include three main modules.
(1) Data Acquisition Module. This module is developed to provide the capability of collecting data from both digital and analog sensors. The digital signal obtained from the accelerometer is collected using the digital drivers. The analog data are collected from soil moisture and temperature sensors.
(2) Data Processing Module. Monitoring applications require scheduling the events and managing each node's buffer to avoid the loss of events and data. The data processing module is a core component for processing all the incoming data from sensors and outgoing data to the gateway. The scheduler module implements three following submodules.
(a) Sensor Sampling. This module provides an efficient connection between sensors and the sensor column. It has the capability to sample and collect sensor data in the user defined intersampling rate. After that, the data are sent to buffer manager module.
(b) Health Monitoring. This module is designed and implemented to monitor the battery time remaining in a sensor column.
(c) Power Saving. This module is designed to provide a power saving mechanism for the sensor column. It is implemented by integrating the sensor column's state transition, such as “sleep” and “active” modes.
(3) Data Communication Module. This module provides the routing algorithms and time synchronization methods in the WSN [25].
where
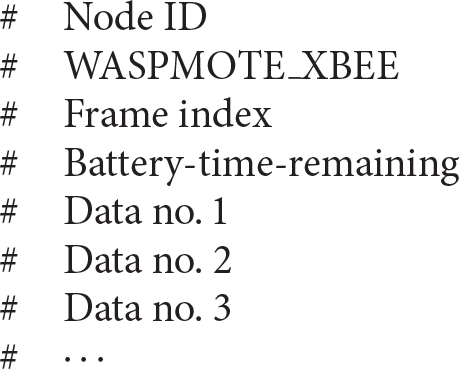
Node ID is an ID address that has 9 numbers Frame index will be increased after each post Data no. i is data of the ith sensor that is divided into two fields: name of the sensor and the data value. An example of a data frame received from sensor column is #382537687 #Reserved#3 #TCA: 22 #HUMI1: 200.5 #HUMI2: 0.0 #BAT: 23 #ACC1: 4.0 #DATE: 13-1-11 #TIME: 12-30-11#. Note that the information of the battery-time-remaining and the reading time index is also attached into this frame. The gateway receives the data frame at every
2.2. Flexible Configuration and Energy Efficiency Plan
In landslide monitoring systems, the low power consumption is a very important factor that decides lifetime of the network. So the choice of low power physical components helps improve the energy consumption of the overall network. Besides, the choice of low power sensors and microprocessor and the choice of network standard are important. There are some network standards such as WiFi, Bluetooth, ultrawideband, and IEEE 802.15.4. The ZigBee, which is based on IEEE 802.15.4, is the lowest power consumption and it provides self-organized, multihop, reliable network with long battery lifetime [26]. In our work, the ZigBee is chosen to reduce the power consumption. Furthermore, based on the choice of low power components, we implement the power scheme to extend the network lifetime.
In our network, each sensor column consists of a Waspmote board, a battery, a XBee module, a soil moisture sensor, a temperature sensor, and a 3-DOF (degree of freedom) acceleration sensor as shown in Figure 5. Table 1 shows the power consumption of these components. From this table, the total average power of a sensor column in the active mode is given by
Power consumption of a sensor column.

The battery for a sensor column is of Lithium type with the capacity of 6600 mAh and the voltage of 3.7 V. The power is determined as

In this kind of application, we tried to utilize the natural properties of the environmental data to propose an energy efficiency scheme. The landslide often occurs during and after the rain. Thus, a suitable switching technique should be established to adapt to the weather condition. In the bad weather condition, the data should be sensed and transmitted more frequently (at every Ts2) to ensure that the system can track very well the site's status. In the normal condition, the data rate can be reduced to Ts1 to save the power.
For Scheme 1 (i.e., the update cycle is Ts1), after 10 minutes we carry out reading and transferring data each time of 3 seconds. Between these 2 actions, the sensor node switches to sleep mode and consumes much less power. The total of the energy consumption during 3 seconds for reading and transferring data is 0.08 mWh. During sleeping, the energy consumption is 0.18 mW × 10 min = 0.03 mWh.
The total number of times sensor nodes reading and transferring data is 24420 mWh/(0.08 mWh + 0.03 mWh) = 222000.
The sensor node can live about 222000 times × (10 min + 3 seconds) × 75% = 1162 days (or 3.18 years).
For Scheme 2 (i.e., the update cycle is Ts2), after every 1 minute, the microcontroller reads and transfers data within 3 seconds. The total of the energy consumption during 3 seconds for reading and transferring data is 100.255 mW × 3 seconds = 0.08 mWh. During sleeping, energy consumption is 0.18 mW × 1 min = 0.003 mWh.
The total of times sensor nodes reading and transferring data is 24420 mWh/(0.08 mWh + 0.003 mWh) = 294216.
A sensor node can then live about 294216 times × (1 minute + 3 seconds) × 75% = 161 days (or 0.44 years).
It can be seen that using Scheme 1 with updated cycle Ts1 would offer 7.2 times lifetime higher than Scheme 2 (using Ts2). In practice, the lifetime of the sensor columns will vary from 161 to 1162 days (depending on the weather in this year). In the case of tropical countries such as Vietnam, the average lifetime would be around 1.8 years, which is larger than our maintenance cycle (i.e., 1.5 years). It means that we do not need an extended power plan (e.g., solar cell, wired electric) for the WSN system. All sensor columns would be recharged on each maintenance period.
In this section, the transmitting power of both schemes is assumed to be constant (i.e., 10 mW). Advantage of tree topology in our proposed switching configuration will be further exploited in the next section when we deal with the transmitting power of the whole network.
The main program flow charts of the gateway node and sensor nodes are shown in Figures 6 and 7.

Flowchart of the gateway node.
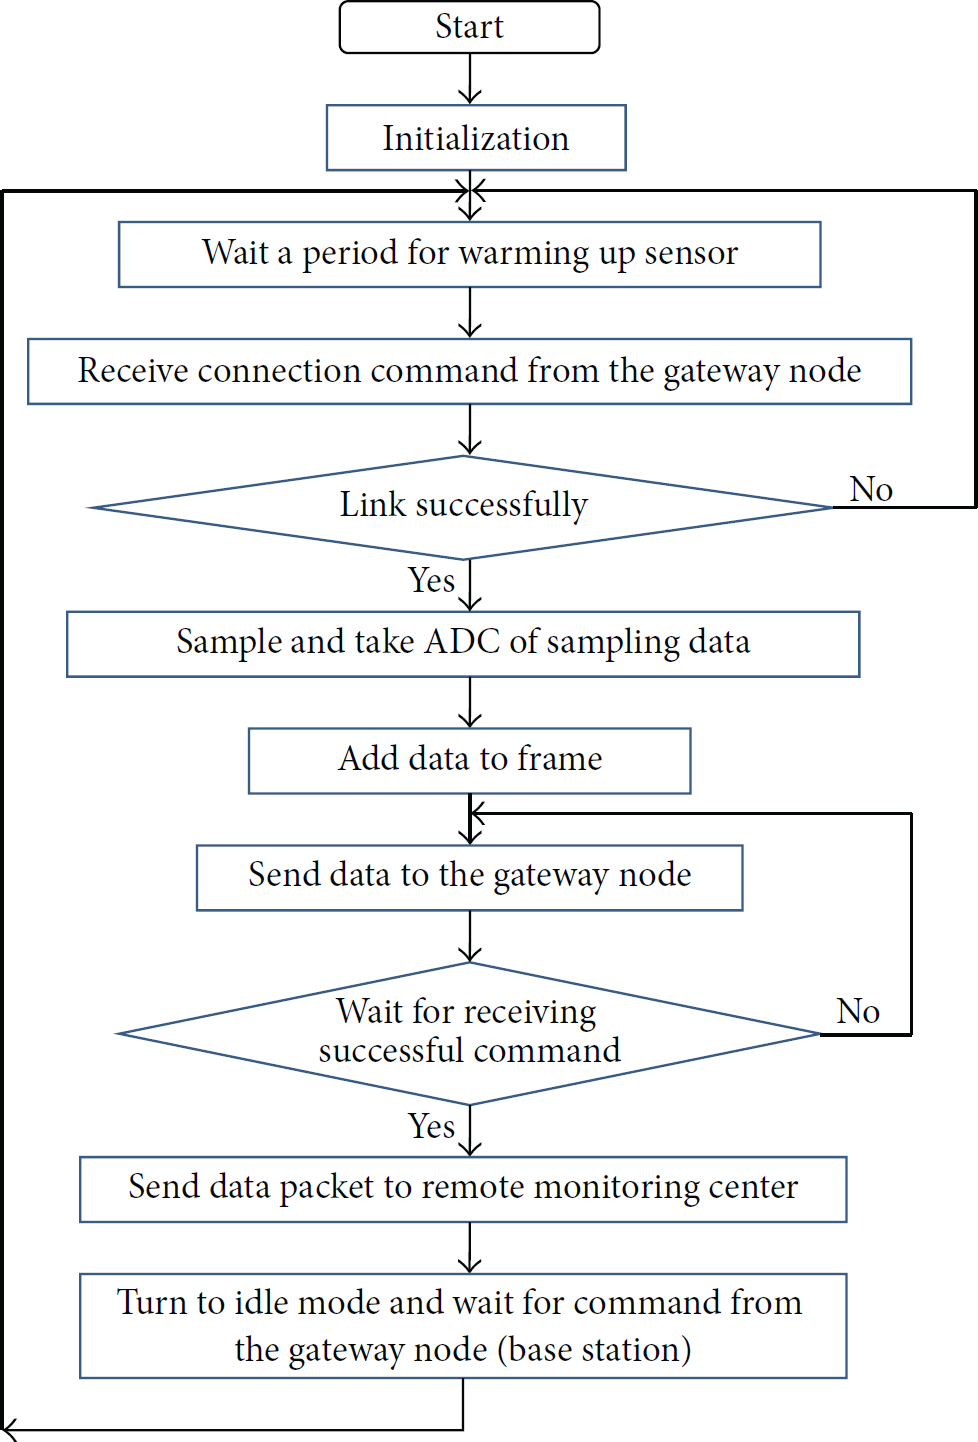
Flowchart of the sensor node.
3. Simulation and Experiments Results
3.1. Performance Evaluation of the Proposed WSN
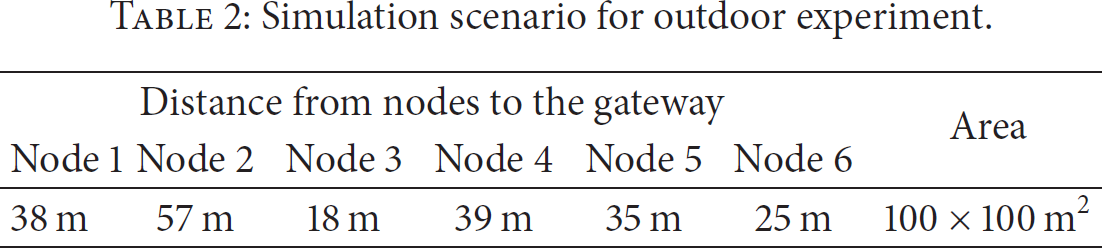
In this research, the WSN is simulated and tested in outdoor environments with the influence of the vegetable cover. This scenario is closed to real condition that we will deploy in HaGiang province. Firstly, a study area is built to simulate the wave propagation using Wireless InSite software [27]. The spatial location of sensor columns is shown in Table 2. Secondly, the network simulation is performed using OMNeT++ software [28].
Simulation scenario for outdoor experiment.
The model of the simulation is shown in Figure 8. Based on OMNeT++, this network is simulated including network topology (e.g., star), network protocol, and parameters of hardware. Some simulation parameters in the physical layer are shown as follows: the output power level is 10 dB, the received sensitivity is −100 dBm, the system operating margin is 99.9%, the gain of the antenna is 6 dBi, and the range of frequency is 2.405–2.465 GHz.

Simulation model of the WSN system in outdoor experiment.
Through simulation, we can estimate the packet delivery ratio (PDR) base on the number of messages, which is computed by the ratio between the transmitted and received packets (see Figures 9 and 10).

Number of messages sent in the simulation.

Number of messages received in the simulation.
The number of messages sent by 6 nodes are 140, 103, 127, 109, 133, and 118, respectively. Thus, the total number of messages sent in the simulation process is 730 messages. From Figure 10, the total number of messages received is 730 messages. Consequently, the PDR from simulation is 100%. Other evaluated parameters of our model such as the latency, the packet delay, and the packet collision can also be acquired by using this simulation program.
In our preliminary outdoor experiment testing (see Figure 11), we would like to check the robustness and the flexibility of our proposed network; we set up the scenario closed to the field site in the same condition with simulation to evaluate the real performance of the system. The measured PDR is 100%, presenting a perfect accordance between simulation and experimental results. Using a rain-gauge to measure the threshold that would change the network topology, our experimental network behaves exactly as designed during the experimental tests. The preliminary experimental results give a strong indication to the reliability and flexibility of our WSN. This flexibility for the network to change its topology would help forecast the landslide with higher precision. Furthermore, the flexible configuration of the proposed WSN would increase about 7.2 times of the lifetime of sensor columns.

Sensor columns and gateway locations in outdoor experiment.
Figure 12 shows the monitoring interface at the data logger. After that, the received data would be uploaded to a database on the web server. Responsible people can access this kind of data anywhere the Internet is available. Furthermore, a specific program would be designed to process and provide the monitored information or real-time alert (if needed). In case of alert for landslide, alert services will be executed. One of alert services is the Short Message Service (SMS), which is implemented to send an alert message to the phone of responsible people about the level of the warning (see Figure 1).

Real-time monitoring of the sensed data.
3.2. Flexible Switching between Two Schemes
Landslide WSN is set up at a specific slope. The geometry of slope is naturally fitted to both star and tree topologies (see Figure 3). Note that both star and tree topologies are also very popular in ZigBee standard. Figures 13 and 14 also show the distribution of sensor columns and the gateway (the data logger) based on these topologies. This distribution would also be deployed at the field site. The gateway and the data logger are always placed in the higher location and out of landslide potential slope. The sensors columns are placed on designed positions after the field survey. Despite the difference in topology, the locations of sensor columns and the gateway in Figures 13 and 14 are the same, that is, at the highest level.

Star topology used in Scheme 2, along with the data rate Fs2. In this topology, the lowest level sensor nodes are 1–6, there is not cluster head, and the sink node is on the top.

Tree topology used in Scheme 1, along with the data rate Fs1. In this topology, the lowest level sensor nodes are 3–6, the cluster heads are 1 and 2, and the sink node is on the top.
Only the data logger is fed by electrical wire. All sensor columns are fed from the battery. Thus, the power plan should be designed carefully to maximize the lifetime of the system. For the hardware XBee-PRO from Libelium [29], there are only five options for the transmitter: 10, 12, 16, 16, and 18 dB, respectively. The received sensitivity (RS) is −100 dBm, the system operating margin is 99.9%, the gain of transmitter and receiver antenna 
The energy parameter is designed carefully to meet the requirement of transmitting the data and save the power. Table 3 shows the link budget, which is specified for our hardware. Three first columns are provided by the factory [29]. Two last columns are computed using the theory of the link budget [30]. For placing the sensor columns' location at the field site, we should focus on the output power levels (the 4th column) and the corresponding distances (the 5th column).
Calculating the link budget.

The network architecture is designed with a star or a tree topology. Besides offering a good performance, the star architecture has some practical advantageous. In fact, in star topology, new nodes can be added easily without affecting the rest of the network; similarly, components can also be added or removed easily. Particularly, the failure of one node or link does not affect the rest of the network. Thus, in bad weather condition, the probability of node failure increases; the network must be consequently configured in the star topology. Also, the data must be sensed and transmitted more frequently in order to ensure that the system can rapidly and correctly track the site's status. However, in the normal condition (i.e., Scheme 1), the network will be configured in the tree topology and the data rate can be reduced to save the power. It can be seen that the power plan must be designed concurrently with the weather condition to improve both the operational reliability and the power consumption efficiency for our system.
The power used by the network with star topology is determined by the following equation:


The power of network transmitters using tree topology is given by
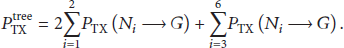
In (8), node 1 needs two sessions to transmit data from nodes 3 and 4 to the gateway; node 2 also needs two sessions to transmit data from nodes 5 and 6 to the gateway. Because the distance of node-node and node-gateway is smaller than 600 m and higher than 497 m, we choose δ = 1 for this network. Therefore, the required network transmitting power is

Equations (8) and (9) show that, in Scheme 1, the transmitting power of the whole network is 1.9 times less than in Scheme 2. In the normal condition, Scheme 1 would be enabled to save power for the whole WSN. The WSN can switch to Scheme 2 (during the rain) to obtain higher data rate and increase the reliability of the network.
4. Conclusions
We have successfully built a flexible and efficient wireless sensor network for detecting rainfall-induced landslides. The performance of our proposed system is analyzed by simulation and by testing on a suitable outdoor experiment. A flexible switching between star and tree topologies is used to adapt to the weather condition in order to maximize the reliability of the transmission. Moreover, the power management is designed concurrently with the weather condition to improve both the operational reliability and the power efficiency. By using this proposed configuration, the average lifetime of the system would reach 1.8 years, which is larger than the required cycle of maintenance (i.e., 1.5 years). Therefore, we do not need an extended or back-up power plan for this WSN system. Our designed WSN will be soon deployed in the real field site at Ha-Giang Province, where landslides occur very often.
Footnotes
Conflict of Interests
The authors declare that there is no conflict of interests regarding the publication of this paper.
Acknowledgments
This work has been supported by Vietnam National University, Hanoi (VNU), under Project no. QG. 14. 05. The authors would like to warmly thank Dr. Ton That Long from International University VNU-HCM for his taking time to improve our writing style.