
Abstract
Link duration prediction is one of the most fundamental problems in vehicular ad hoc networks (VANETs) as it determines the network performance of many vehicular applications. Existing analytical analysis about link duration in both mobile ad hoc network (MANETs) and VANETs is too complicated to be applied in a practical setting. Assuming vehicle's velocity follows the normal distribution, we propose a practical model which considers the distribution of relative velocity, intervehicle distance, and impact of traffic lights to estimate the expected link duration between any pair of connected vehicles. Such model is implemented on each vehicle along with (1) a relative velocity estimation approach and (2) an exponential moving average- (EMA-) based data processing procedure. Furthermore, the proposed model assumes that the events of two consecutive vehicles encountering traffic lights combination are dependent, which make the model more practical. Simulation results show that the link duration model predicts link duration with the average accuracy of 10% and 20% in highway and city scenarios, respectively.
1. Introduction
Vehicular ad hoc networks (VANETs) [1] are considered as an important type of delay tolerant networks (DTN) [2] where vehicles share safety or entertainment-related information between each others via vehicle-to-vehicle (V2V) and vehicle-to-infrastructure (V2I) communications [3]. To support this vision, the Federal Communication Commission (FCC) in U.S. has approved 75 MHz of spectrum from 5.85 GHz to 5.925 GHz for dedicated short range communications (DSRC) to enhance safety and productivity of transportation systems.
Potential applications of VANETs include road safety [4], traffic monitoring [5], entertainment, and advertisements [6], delivering non-real-time Internet connectivity [7]. To enable these applications, a few important questions need to be answered: Is it possible to predict the link duration between any two connected vehicles? What information are needed on each vehicle to make such prediction? Is is feasible for vehicles to obtain these information in real-time?
The importance of link duration on the network performance in mobile ad hoc networks (MANET) and DTN was intensively studied in the literature [8–10]. Similarly, from simulation results [11], link duration is considered one of the most important QoS metrics in VANET routing. Link duration between two vehicles could significantly affect the stability of a multihop path constructed by a routing protocol, so there has been several works focusing on reliable routing by considering link duration [12, 13].
To model link duration in VANETs, a few analytical works are proposed [14, 15]. However, link duration in VANETs is very complicated and affected by many factors including intervehicle distance, vehicle speed, turning ratios at intersections, influence traffic lights, and signal decay caused by the roadside buildings. Our analysis reveals that the distribution of a vehicle's velocity follows closely the normal distribution; therefore, it is possible to use the distribution of relative speeds, instead of instantaneous velocity, to estimate the expected link duration between vehicles.
We design a practical solution that allows each vehicles to practically estimate the link duration between itself and any other connected vehicles. The main instrument of this work is to approximate the distribution of vehicles’ relative speeds and estimate expected link duration by considering initial intervehicle distance and the impact of traffic light. In addition, we applied the exponential moving average (EMA) method on velocity samples to filter the sudden changes occurring in vehicle velocities. It turns out that each vehicle only needs to collect 10 samples to achieve a relatively accurate link duration estimation.
There are four major contributions of this paper. First, we propose a novel link duration predication (LDP) model for highly dynamic and distributed VANETs so that each vehicle is able to predict link duration in real time. Second, based on LDP model, a practical solution is designed to automatically collect velocity samples on vehicles and accurately estimate the distribution of velocities. Third, LDP does not assume the events of meeting traffic lights for two consecutive vehicles are independent, which is a common assumption in previous works. Fourth, we validate LDP and evaluate its performance in simulations and results show that LDP can accurate predict link duration for VANETs in both highway and city scenarios.
The rest of the paper is organized as follows. Section 2 summarizes the related works. The LDP model and how to estimate the distribution of relative velocities are described in Section 3. In Section 4, we validate the LDP model and evaluate its performance in highway and city scenarios. Finally, we draw conclusions in Section 5.
2. Related Work
There have been some works studying the link duration problem in mobile ad hoc networks. Link duration is defined as the time interval in which two nodes stay within transmission range of each others [16]. It was also discovered in [16] that link duration is determined by the relative speed and active distance between two nodes given the assumption that node movement follows the random way point model.
It was proved in [17] that the random way point model could not provide a steady state where the average speed of nodes consistently decreases over time, and therefore should not be used directly in simulations. In addition, it was shown in [18] that different mobility models had different impacts on link stability in ad hoc networks. Because of the above-mentioned reasons, the authors of [16] extend their work by considering both random way point and random walk models and further investigate the behavior of multihop links in mobile ad hoc networks.
In mobile ad hoc networks, the statistic of multihop path duration was studied in detail [8], that is, how probability density functions vary with parameters including mobility model, relative speeds, number of hops, and communication range. Exponential distribution was found to be a good approximation of path duration distribution for nodes moving at moderate and high velocities. This result suggested an exponential distribution of link duration to be expected in vehicular networks as vehicles are moving with relatively high velocities, which was validated by the experimental results in [19].
In [19], extensive experiments were conducted on thousands of operational taxies in Shanghai, China. It was observed that the distribution of link duration exhibits a light tail such as one of an exponential distribution over a large range of timescales. In fact, before this experimental study, there were some other theoretical works suggesting intercontact time between nodes in ad hoc networks is light tailed through numerical simulations based on the random way point model [20–22].
Conclusions drawn from mobile ad hoc network might not be applied to vehicular network (as vehicle's movement does not follow random way point model), so researchers recently started to investigate link duration in VANETs. Nekovee first studied the probability of link duration in VANET by assuming active distances between vehicles are constant and ignoring mobility models of vehicles [23]. Then, he extended the work by assuming vehicles’ velocities follows normal distribution in [24]. In [14], the probability distribution of link duration in VANETs was theoretically studied under the assumptions of a realistic radio transmission model and probability distribution model of intervehicle headway distance.
Assuming free flow traffic state and normal distribution of vehicle's velocity, the impact of vehicle mobility, vehicle density, and transmission range on link duration in VANET is studied in [15]. It was also found from [15] that exponential distribution is a good approximation of link duration pdf. In [25], a discrete Markov process-based model is proposed for link duration by considering the intervehicle distance, vehicle speed, turning ratios in intersections, and traffic lights.
Above-mentioned analytical models for link duration in both MANET and VANET pave the way for predicting link duration in real-time within VANET. To the best of our knowledge, none of existing works proposed a practical design to allow vehicles to dynamically predict the link duration between itself and other connected vehicles. Unlike previous works, we only assume vehicles velocities follow normal distribution and release the assumptions about knowing the distributions of intervehicle distance, traffic flow state, and so forth.
3. Link Duration Predication Model
To accurately predict how long two vehicles are connected, a link duration model must overcome two challenges.
3.1. Distribution of Relative Velocity
Since vehicles move with various speeds on road, we first investigate the distribution a vehicle's velocity. As shown in Figure 1, the velocity of a randomly selected vehicle from our simulations closely follows the normal distribution. While looking at the relative velocity of two randomly picked vehicles, we found it also follows normal distribution, as shown in Figure 2.

Mean absolute and relative velocities of two nodes in highway scenarios.
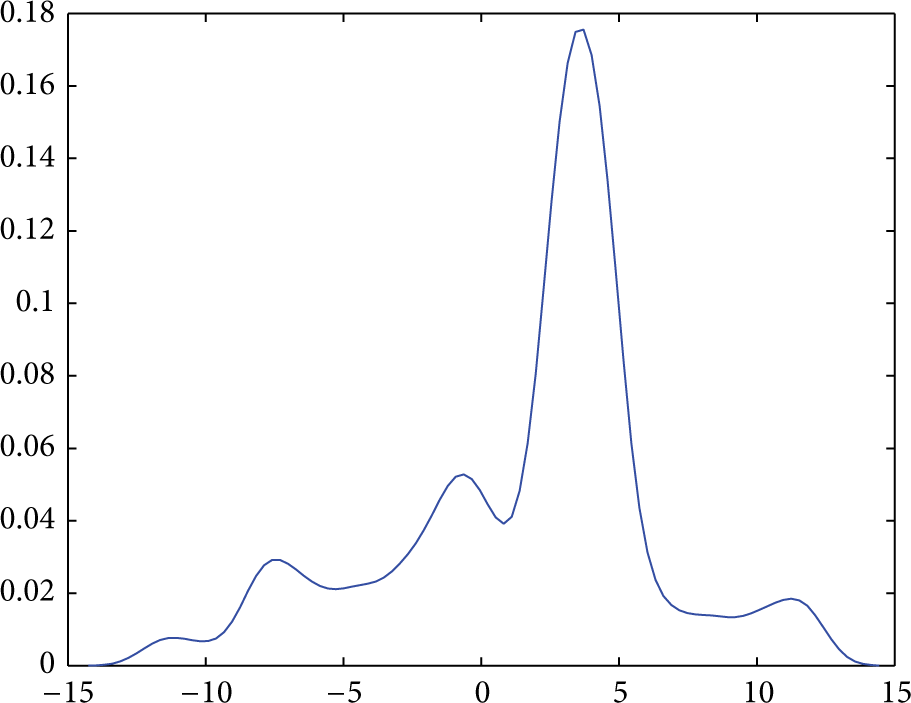
Relative velocity of two randomley picked nodes.
Assume a vehicle's velocity v is a random variable which follows the normal distribution

If vehicles’ velocities are independent random variables, then the relative velocity of any two vehicles still follows the normal distribution. Suppose the velocity PDFs of two vehicles are
We assume

where ρ is the correlation between two random variables
The population correlation coefficient ρ between two random variables

where E is the expected value operator, cov means the covariance between
As independent scenarios are special cases of the dependent ones, we could conclude that given the velocity PDFs of two vehicles,

where
3.2. Estimation of Relative Velocity
To estimate the distribution of relative velocity of any two cars, we first need to know the velocity distribution parameters (
Given a set of velocity samples (
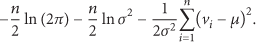
Taking derivatives with respect to μ and

where
To estimate the

where
To avoid buffer overflow, only a certain amount of samples are recorded on each vehicle. In fact, a sliding window scheme is adopted on each vehicle so that only the most recent ten samples are considered in estimating parameters μ and σ.
3.3. Principle of Link Duration Prediction
Assume both absolute and relative velocities follow normal distribution, the link duration between any two connected vehicles could be computed from the expected relative traveling distance between them. We first introduce the prediction model without considering traffic lights, how to compute link duration with traffic lights will be provided in the next section.
We consider the link duration between any two vehicles a random variable T. The distribution of this random variable highly depends on
To determine T's distribution, we first introduce the concept of relative traveling distance L. Suppose two vehicles move in the same direction, if the following vehicle's speed is greater than the front one, L become
Now we are ready to define the CDF of T as follows:
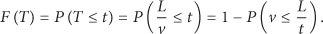
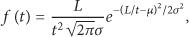
Differentiate the above equation by t, the probability distribution function of T is

As relative velocity v follows normal distribution, the equation can be rewritten as
where μ and σ are the mean and standard deviation of relative speed. Therefore, expected link duration could be computed as follows:

Because relative velocity v follows normal distribution, we know almost 99% of v fall within the range [

3.4. Impact of Traffic Light on Link Duration Prediction
In the previous section, we assume vehicles are moving freely on road, that is, the impact of traffic light is not considered. Since it is impossible to know exactly whether a vehicle will be proceeding in its original directions or preparing to stop, we model the chance that a vehicle facing red or green signals by probability.
Although some existing works considered the impact of traffic light, they simply assume the events of two consecutive vehicles encountering traffic lights combination are independent, which is different from the real situations [25]. Instead, in our LDP model, we assume these events are not independent and thus makes our model more practical.
It is true that the movings of two vehicles are independent at the traffic lights considering the independent driving behavior in practice; however, the events of two consecutive vehicles encountering traffic lights combination are dependent [25]. In other words, what traffic signal the second car faces is highly dependent upon the traffic signal that the first car encounters. This phenomenon has been observed and modeled in [25]. The probability that two cars

where the conditional probability

where L is the intervehicle distance when
This probability is not a constant and it depends on the time when
When vehicles

Illustration of the impact of traffic light on vehicles’ movements.
Fortunately, we find the times (
As shown in Figure 4, given the arriving time difference between

Illustration of the waiting times of vehicles in front of traffic lights.
We assume vehicles
In the second case Figure 3(b), only
For the third case shown in Figure 3(c) where only
The fourth case shown in Figure 3(d) is more complicated than other cases. As both of these two vehicles are stopped by red traffic light, there are five possible periods in which the link between them could break, that is, (
We only discuss the cases where
3.5. Link Duration Prediction Process
Based on the link duration prediction model mentioned in previous sections, each vehicle could predict the link duration between itself and any nearby vehicles within its communication range.
At a certain time, suppose vehicles
A vehicle's speed may drastically decrease due to a sudden break of font cars or increase if it overtakes another car. Such sudden changes in relative velocity could trigger a large change in link duration prediction results. To avoid such issue, we preprocess a vehicle's velocity by adopting the EMA (Exponential Moving Average) method. Consider

where
The process of predicting link duration between vehicles

Flowchart of predicting link duration between vehicles
When vehicle
4. Evaluations of the LDP Model
Because mobility model of vehicles in VANETs is an important factor affecting the accuracy of the LDP model, we generated vehicles’ movements by VanetMobiSim [27] whose mobility patterns have been validated against TSIS-CORSIM, a well-known and validated traffic generator. The VanetMobiSim features new realistic automotive motion models at both macroscopic and microscopic levels and also supports traffic lights, lane changes, and speed regulations.
While predicting the link duration between two connected vehicles, LDP considers two major factors: distribution of relative speed and traffic lights. To evaluate the performance of LDP, we construct two scenarios to reflect the impacts of the above two factors. First, in highway scenarios where vehicles move with relatively stable speeds, we evaluate how distributions of relative speed will affect the model's accuracy. Second, in city scenarios where vehicles frequently change their speeds due to traffic lights, we evaluate how traffic light will affect the model. In both highway and city scenarios, the relative moving direction between two vehicles also significantly affect LDP's performance. When two vehicles move towards (away from) each others, the relative distance between them keeps decreasing (increasing), and thus LDP can accurately predict the link duration between them. However, when two vehicles move in the same direction, the following vehicle may or may not overtake the leading vehicle, resulting in inaccuracy in prediction results.
4.1. Highway Scenarios
In VanetMobiSim, we deployed 100 vehicles on a 5000 m-long four-lane divided highway. The maximum and minimum vehicle velocities are set as 18 m/s and 34 m/s, respectively. The acceleration and deceleration factors are configured as 3 m/s2 and 3 m/s2, respectively. Details of the simulation setup are listed in Table 1. To understand how relative moving direction will affect the LDP model, we group vehicle pairs in two categories:
Simulation setup parameters in highway scenarios.

4.1.1. Same Moving Direction on Highway
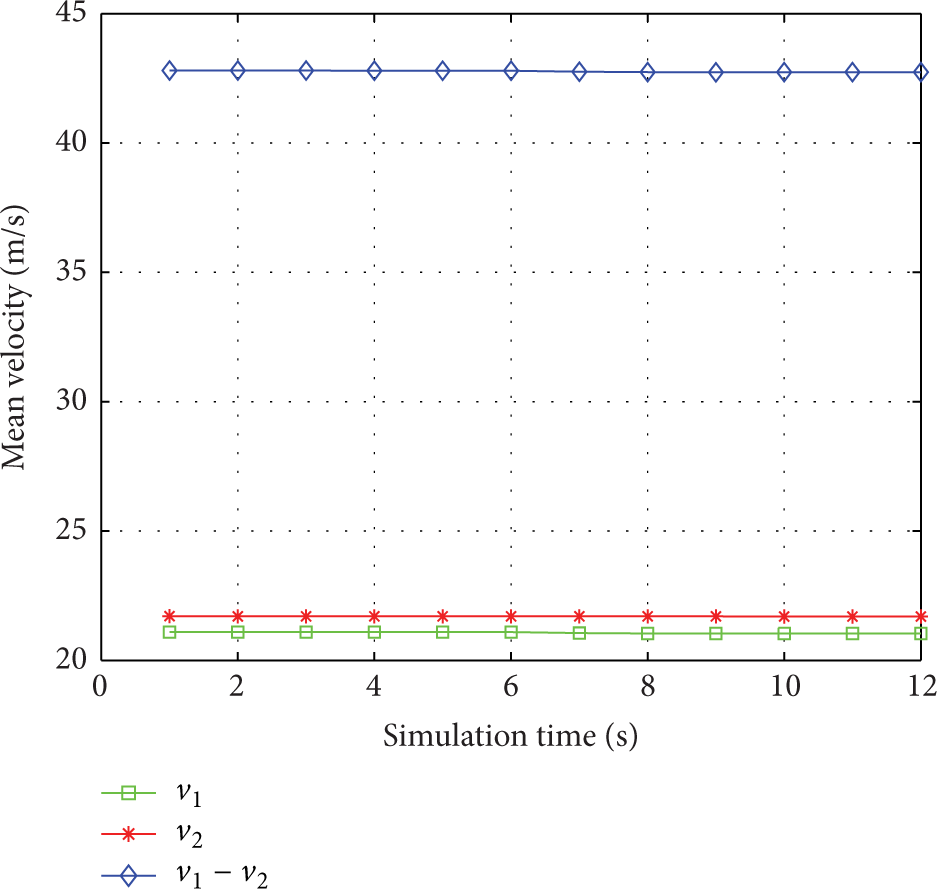
We randomly select two vehicles moving in the same direction and plot their mean velocities over time in Figure 6. From this figure, we can see that the mean velocities of these two vehicles do not change over time, so does mean relative velocity between them. Figure 7 indicates that vehicles in highway scenarios move with stable velocities.

Mean absolute and relative velocities of two nodes in highway scenarios.

Standard deviation of absolute and relative velocities of two nodes in highway scenarios.
Since there is no traffic light on highway, LDP can accurately predict the link duration between these two vehicles. As shown in Figure 8, these two vehicles connect to each others at the
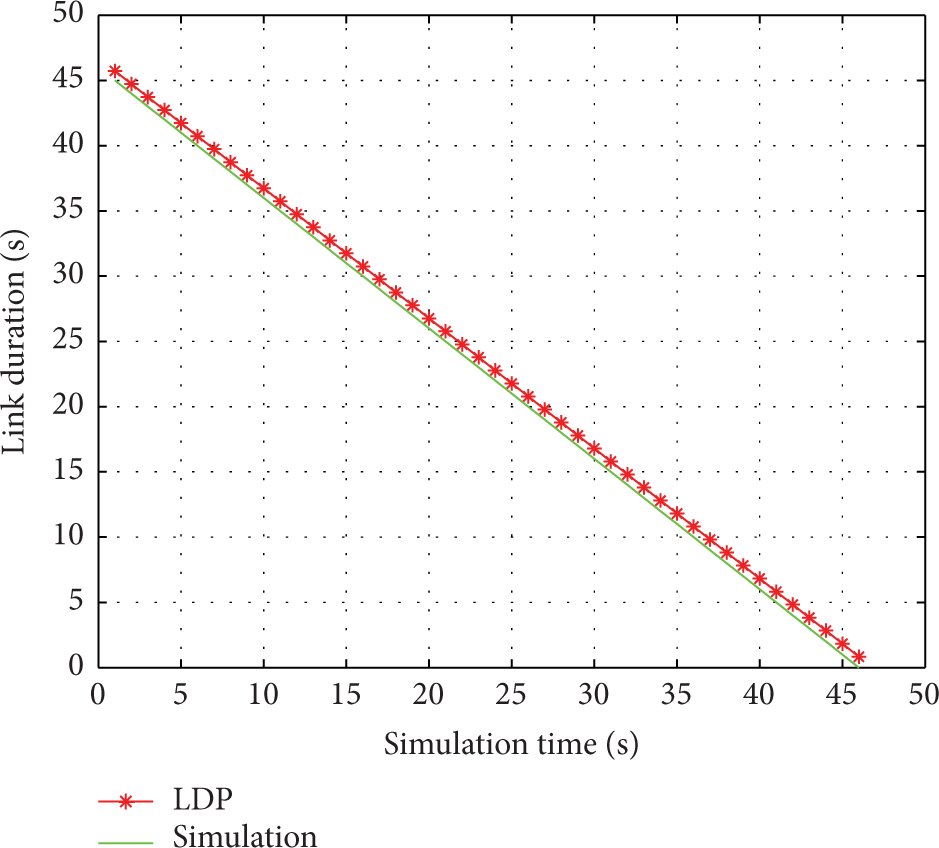
Link duration of two randomly selected nodes in highway scenarios.

CDF of predication errors in highway scenarios.
Furthermore, we randomly select 10 pairs of vehicles moving in the same direction and plot the average prediction error of LDP for these 10 pairs in Figure 10. As we can see, most average prediction errors are around 10%, which are accurate enough to support most applications.
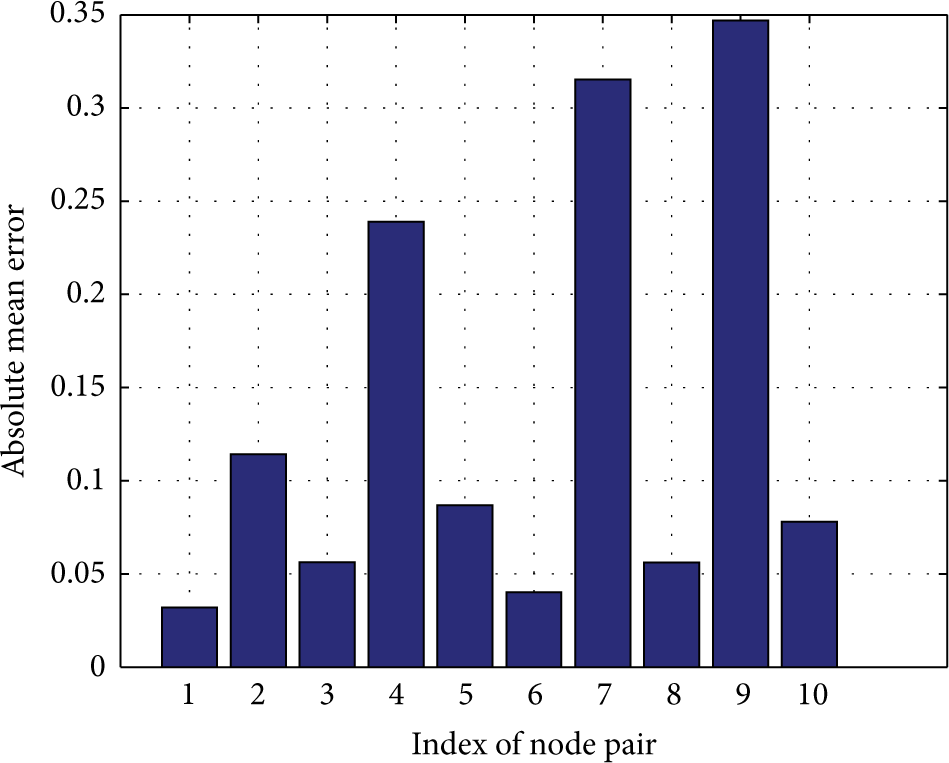
Mean predication errors of 10 randomly selected nodes in highway scenarios.
4.1.2. Opposite Moving Directions on Highway
If two vehicles move in the same direction, their relative distance might increase or decrease depending on their relative speed, that is, the larger the relative speed, the longer the relative distance. However, in cases where vehicles are moving (away from each others) on different directions, their relative distance will keep increasing, which makes the link duration prediction model more accurate. When they are moving towards each others, their relative speed will keep reducing till zero and start increasing continuously.
To validate the predication accuracy of LDP, two vehicles moving in opposite directions are randomly selected from the simulations. The mean and standard deviation of their absolute and relative velocities are plotted in Figures 11 and 12. From these figures, we could see that the second car's velocity significantly changes after 6 s but the first car moves with a relatively constant speed.
Mean absolute and relative velocities of two nodes moving in different directions in highway scenarios.

Standard deviation of absolute and relative velocities of two nodes moving in different direction in highway scenarios.
As these two vehicles move away from each other, their relative distance keeps increasing. As shown in Figure 13, these two vehicles are connected for a shorter period of time comparing to the cases where two cars move in the same direction. This is because their relative distance rapidly increases and quickly they are out of communication range. Because the predicted and real link duration are close to each others, we further plot the CDF of LDP's prediction error in Figure 14. As we can see, the maximum error is only 5% and around 60% of results have errors less than 1%.

Link duration of two nodes moving in different directions in highway scenarios.

CDF of predication errors in highway scenarios.
We randomly select other 9 pairs of vehicles moving in different directions. Together with the above-analyzed pair, we plot the average prediction errors of these 10-pair vehicles in Figure 15. The overall prediction errors of vehicles moving in different directions are less than those moving in the same direction. That also means LDP could more accurately predict link duration for vehicles moving towards or away from each others.

Mean predication errors of 10 pairs of nodes moving in different directions in highway scenarios.
4.2. City Scenario
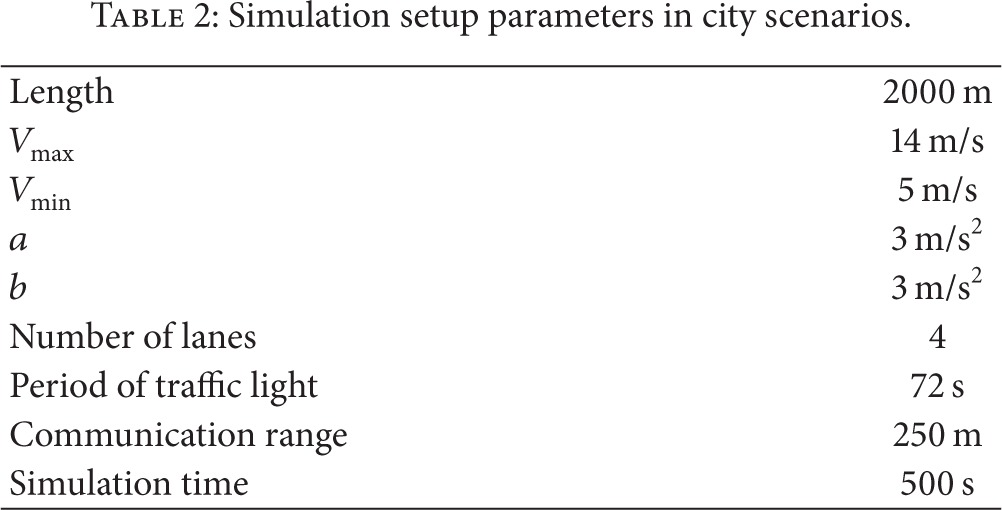
Predicting link duration of two vehicles moving in city scenarios is a challenging problem as it is difficult to predict what type of traffic signal a vehicle will face. To simulate a simplified city scenario, simulation parameters in VanetMobiSim are configure as listed in Table 2. In the simulation, two 1000 m road segments are connected at an interaction with a traffic light of 36 s red signal and 36 s green signal. There is a total of 70 vehicles deployed on these two road segments. Based their moving directions, vehicle pairs are classified into two groups:
Simulation setup parameters in city scenarios.
4.2.1. Same Moving Direction in City Scenario
Figure 16 plots the predicted and real link duration of a randomly chosen pair of vehicles which move in the same direction in the city scenario. From this figure, we can see that the prediction errors become smaller as the simulation time increases. When these two cars are initially connected at the 1st second, the prediction error is around 20%. This is because the relative distance and velocity of these two cars change drastically during the time period [
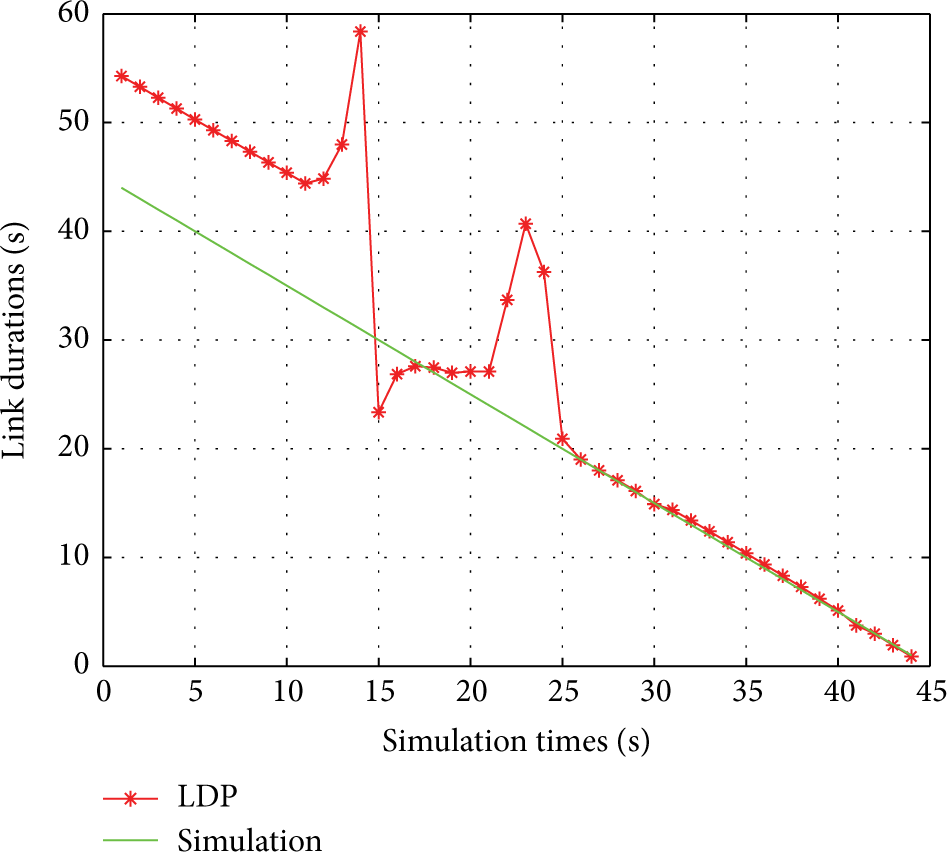
Link duration of two randomly selected nodes in city scenarios.
To understand the fluctuation of data in Figure 16, we further plot the absolute and relative velocities of these two vehicles in Figure 17. While the first vehicle

Mean absolute and relative velocities of two nodes in city scenarios.
From the above analysis, we can see that the stability of vehicle's speed is very important to the accuracy of LDP. As shown in Figure 18, the huge fluctuations of

Standard deviation of absolute and relative velocities of two nodes in city scenarios.
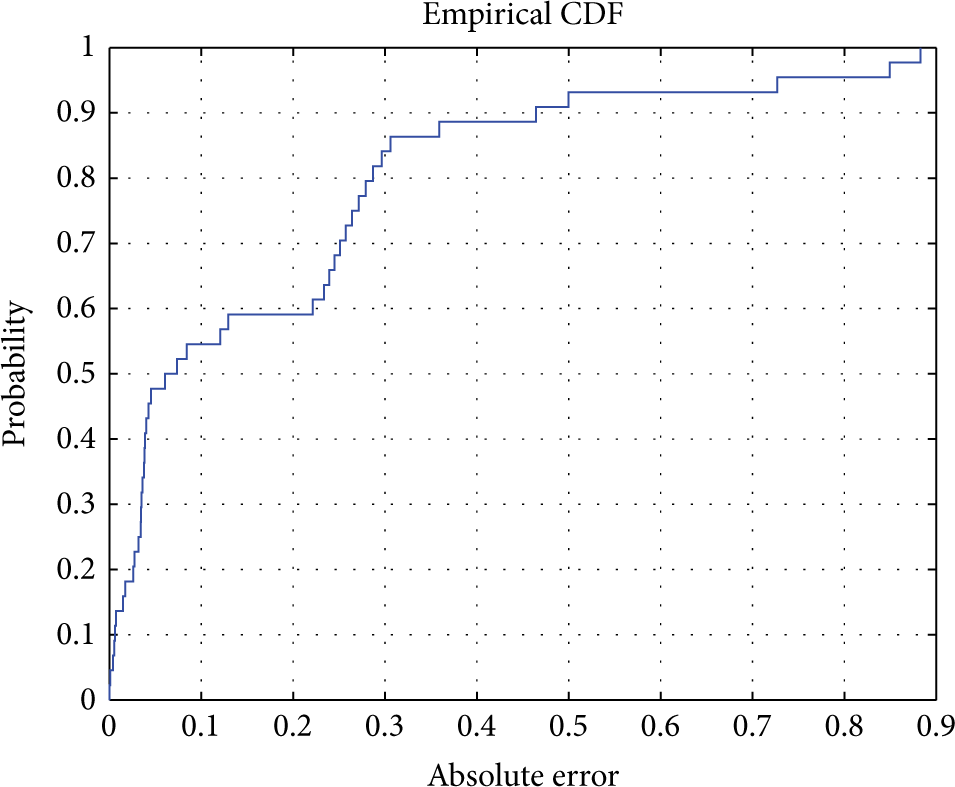
CDF of predication errors in city scenarios.
To evaluate LDP's performance for vehicles moving in the same direction in city scenarios, we pick 9 more pairs of vehicles and plot their prediction errors in Figure 20. As we can see from this figure, most of the average prediction errors are around 20%. There are some results containing errors as large as 80%, which are caused mainly by two reasons:

Mean predication errors of 10 randomly selected nodes in city scenarios.
4.2.2. Different Moving Directions in City Scenario
When two vehicles move in different directions, the link duration is easier to predict compared to those moving in the same direction.
The absolute and relative speeds of two randomly chosen vehicles (moving on different directions) are shown in Figure 21. We also plot the standard deviation of their absolute and relative velocities in Figure 22. As they are moving away from each other, the relative speed is actually the sum of their absolute speeds. After 35 s, the second vehicle's speed becomes zero, that is, it stops in front of the traffic light.

Mean absolute and relative velocities of two nodes moving in different directions in city scenarios.

Standard deviation of absolute and relative velocities of two nodes moving in different directions in city scenarios.
For these two vehicles, we plot the predicted and real link duration values in Figure 23 and the CDF of prediction errors in Figure 24. From Figure 23, we can see that the predicted results closely follow the real ones with little fluctuations. Figure 24 indicates around 75% of predictions have errors less than 20%.

Link duration of two nodes moving in different directions in city scenarios.

CDF of predication errors in city scenarios.
Besides this pair of vehicles, we randomly select 9 more pair of vehicles, of which each pair moves in different directions. The overall prediction errors of these 10 pairs of vehicles are plotted in Figure 25. As we expected, the average errors in Figure 25 are smaller than those in Figure 20. These results again support our conclusion that LDP can more accurately predict link duration for vehicles moving in different directions.

Mean predication errors of 10 pairs of nodes moving in different directions in city scenarios.
4.3. Numerical Analysis of LDP
To understand how the LDP model performs with different parameters, we plot predicated link duration with different μ, σ, and L in Figure 26. In the figure,

Impacts of μ, σ, and L on the link duration predictions.
5. Conclusion
A novel link duration prediction model is proposed for VANETs leveraging the distribution of relative speed instead of instantaneous velocity. Besides relative speed, the model considers intervehicle distance and the impact of traffic light in predicting link duration. Based on the model, a practical solution is designed so that a vehicle can dynamically estimate the link lifetimes between itself and any connected vehicles. Among all parameters, average relative speed is the most important factor affecting link duration; therefore, accurately estimating this parameter becomes extremely important. To avoid the influence of sudden velocity changes, we applied EMA on collected velocity samples to filter outliers.
Simulation results show that the LDP model is suitable and practical for accurately predicting link duration in VANETs. Particularly, more accurate predictions are achieved in highway scenarios where vehicles moving in different directions. Because each vehicle only needs to collect and share 10 latest velocity samples to its neighbors, the overhead of the proposed work is small. We plan to further validate the LDP model by real-world dataset and extend the model by considering vehicles turning at intersections.
Footnotes
Conflict of Interests
The authors declare that there is no conflict of interests regarding the publication of this article.