
Abstract
The erosivity factor in the universal soil loss equation (USLE) provides an effective means of evaluating the erosivity power of rainfall. The present study proposes three regression models for estimating the erosivity factor based on daily, monthly, and annual precipitation data of rainfall station network, respectively. The validity of the proposed models is investigated using a dataset consisting of 16,560 storm events monitored by 55 rainfall stations in southern Taiwan. The results show that, for 49 of the 55 stations, a strong positive correlation
1. Introduction
Water erosion is one of the most important worldwide environmental concerns, particularly in tropical and subtropical regions of the world such as Taiwan. One of the most important active agents of soil erosion is rain due to its potential for producing soil disaggregation and subsequent removal. The effects of raindrop impact and surface runoff on soil erosion are generally estimated using the universal soil loss equation (USLE) [1]; namely,

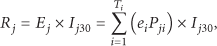
The rainfall erosivity index, R, describes the erosive impact of rainfall and runoff on both the detachment and the entrainment of soil and is given as [1]


The rainfall erosivity index, R, has been widely tested and applied in many countries and regions around the world whose rainfall intensity is characterized mainly as moderate to high [9–15]. In computing the rainfall erosivity factor, the maximum 30-min rainfall intensities for the storm and heavy storm events are generally computed on the basis of hyetograph data or high-resolution rainfall data (pluviograph data). Generally speaking, pluviograph data for at least 20 yrs are required to compute the rainfall erosivity for a given study area using the (R) USLE formulation [2]. However, such large volumes of data are not available for all regions of the world. Furthermore, even if sufficient pluviograph data are available, computing the rainfall erosivity is a complicated and tedious task. To overcome this problem, various simplified models have been proposed for estimating the rainfall erosivity factor using more readily available precipitation data.
Among such models, those based on annual precipitation data are particularly common since annual rainfall data are available in most regions of the world and tend to be fairly reliable. Furthermore, various studies have shown that a good correlation exists between the annual rainfall erosivity and the annual precipitation amount at many locations around the world [16, 17]. Accordingly, annual precipitation data have been used to obtain simple estimates of the rainfall erosivity in many countries [2, 11, 18–34].
Several researchers have used both annual precipitation data and maximum daily and hourly precipitation data to estimate the rainfall erosivity factor in the Mediterranean region [35, 36]. However, the models used in these studies estimate the mean annual rainfall erosivity over several yrs rather than the rainfall erosivity in a particular yr. Many regression models based on variations in the observed rainfall erosivity or seasonal erosivity have been proposed for predicting the daily rainfall erosivity [15, 33, 37–44] or monthly rainfall erosivity [45, 46]. It has been shown that the use of daily or monthly rainfall records provides a better understanding of the rainfall erosivity of individual storms than annual precipitation data [34]. In constructing daily or monthly prediction models, it is necessary to compute the rainfall erosivity on a daily or monthly basis, respectively. However, calculating the daily and monthly rainfall erosivity is more challenging than computing that for a particular storm. For example, if it rains from May 31 to June 1, the observed rainfall erosivity for this storm has just one value. However, the corresponding data should be divided into two different values (i.e., daily or monthly segments) when constructing daily or monthly models. Thus, the annual sum of the reclassified rainfall erosivity is different from the observed value due to the use of different boundary conditions. Moreover, the daily or monthly rainfall parameters used in daily and monthly models, respectively, provide an inadequate description of the kinetic energy and rainfall intensity terms in the rainfall erosivity index [33, 47].
Although annual regression models are a gross oversimplification of the observed variation in the rainfall erosivity and their estimated values are rough [33, 48], they nevertheless represent a viable alternative to detailed quantitative assessments in providing a long-term assessment of the annual mean rainfall erosivity using the USLE formulation [49]. Thus, as discussed above, numerous researchers have proposed methods for estimating the rainfall erosivity based on annual precipitation data and/or other rainfall parameters. However, such models require careful optimization and calibration for each specific location and include site-specific coefficients. The proposed study is to find out the suitable models among daily, monthly, and annual precipitation data.
The present study proposes three regression models for estimating the rainfall erosivity and finding out the suitable models in southern Taiwan based on daily, monthly, and annual precipitation data of rainfall station network, respectively, even without 30-min rainfall data. The detailed goals of this study can be summarized as follows: (a) to construct new models for the large-scale estimation of the erosivity factor in southern Taiwan and (b) to analyze the spatial distribution of the daily, monthly, and annual rainfall erosivity in southern Taiwan.
2. Materials and Methods
2.1. Study Area
This study considered the regions of Kaohsiung City and Pingtung County in southern Taiwan. The two regions cover areas of 2961 km2 and 2784 km2, respectively, and contain a total of 55 rainfall stations (see Figure 1). Both regions commonly experience extreme rainfall events during the summer months. For example, in August 2009, Typhoon Morakot resulted in catastrophic damage that left 665 people dead, 34 others missing, and roughly US$ 4.4 billion in damages.

Geographic locations of 55 rainfall stations in southern Taiwan.
2.2. Rainfall Data
Table 1 summarizes the basic geographic and rainfall data of the 28 rainfall stations in Kaohsiung City and 27 rainfall stations in Pingtung County over the 10 yr period extending from 2002 to 2011. Traditionally, the high-resolution rainfall data recorded by each station in Table 1 are used to calculate the rainfall erosivity factor in accordance with (2)–(4) [7]. In the present study, the reliability of these data was evaluated using the 10-min rainfall data obtained for the corresponding period from the Central Weather Bureau (CWB) of Taiwan. In the present study, 16,560 storm events were selected from the 550 observed annual rainfall datasets presented in Table 1 (i.e., 55 stations × 10 yrs). The corresponding daily, monthly, and annual rainfall data were then used for analysis purposes and for constructing the estimation models.
Geographic and rainfall data (2002~2011) for 55 rainfall stations in southern Taiwan.

2.3. Validation of Models
The present study developed three regression models based on the daily, monthly, and annual rainfall data, respectively, for estimating the annual rainfall erosivity factor (R) in southern Taiwan. The estimated values of R were then compared with the observed erosivity factors calculated using (2)–(4) [7]. For each model, the differences between the estimated and observed values at each rainfall station were evaluated in terms of the root mean square error (RMSE) and mean absolute percentage error (MAPE) computed as mentioned by Lee and Heo [17] as follows: 
In order to develop an accurate model for estimating the rainfall erosivity, it must first be determined whether or not a significant relationship exists between the rainfall parameters and the rainfall erosivity. In identifying appropriate parameters for predicting the annual rainfall erosivity, the present study considered four different rainfall parameters, namely, the event rainfall amount (
Figure 2 summarizes the methods to develop the regional erosivity models from daily, monthly, and annual precipitation data.

Flowchart of calculation.
3. Results and Discussion
3.1. Relationship between Rainfall Parameters and Rainfall Erosivity
Figures 3(a)~3(d) show the relationships between the event rainfall amount and the event rainfall erosivity, the daily rainfall amount and the daily rainfall erosivity, the monthly rainfall amount and the monthly rainfall erosivity, and the annual rainfall amount and the annual rainfall erosivity, respectively. In general, the results show that the rainfall erosivity varies from one geographic location to another, even under the same annual rainfall conditions. Figure 3(a) is one scatter plot of rainfall (

Scatter plots of (a) rainfall event amount (
Table 2 shows the mean, minimum, maximum, and
Annual rainfall and annual rainfall erosivity data (2002~2011) for 55 rainfall stations in southern Taiwan.

An inspection of Table 2 shows that the correlation coefficients (
GIS (Geographic Information System) was used to interpolate and plot the spatial variability of the annual rainfall erosivity factor (

(a) Annual precipitation and (b) annual rainfall erosivity maps in southern Taiwan. Note that isohyet and isoerodent intervals are 500 mm and 10000 MJ mm ha−1 h−1 yr−1, respectively.
The rainfall erosivity map presented in Figure 4(b) is of great relevance for soil erosion evaluation and control. It has implications not only for agriculture but also for many activities related to land use planning. Furthermore, it can be used as a guide for soil conservation practices and landscape modeling since the R factor is usually an important part of erosion models such as the USLE [16].
The higher erosivity observed in the tropic region is caused by the high amount of precipitation, intensity, and kinetic energy of rain. The main generating mechanism of rainfall is convection effect in most tropical regions. As a result, the regions receive more rain with higher intensities than the temperate regions, dominated by midlatitude cyclones [41].
The regression models to estimate rainfall erosivity for specific locations are unable to accurately predict actual rainfall erosivity for other locations due to site-specific conditions. Therefore, simplified methods based on annual precipitation for estimating rainfall erosivity should be used with caution according to location or time period. Their results deserve careful attention as applying simplified methods to estimating annual rainfall erosivity.
3.2. Applicability of Three Regression Models
The applicability of the daily, monthly, and annual regression models developed in the previous subsection (i.e.,
Comparison of estimated rainfall erosivity factor

**Estimated annual mean R factor using monthly rainfall model. (
***Estimated annual mean R factor using annual rainfall model. (
Figure 5 presents scatter plots showing the relationship between the

Validation results for (a) daily, (b) monthly, and (c) annual regression models based on relationship between estimated
According to Table 3 and Figure 5, the data of estimated annual mean rainfall erosivity was underestimated by daily rainfall models, respectively. Nevertheless, Liu et al. [50] indicated that much precipitation information could be provided by daily rainfall data rather than monthly and annual ones. Different from the results of [50] in China, the rainfall event in southern Taiwan might be consistent for several days, and an underestimate could be therefore produced as daily rainfall data was used to estimate erosivity.
3.3. Spatial Distribution Comparison of Three Regression Models
Figure 6 presents the annual rainfall erosivity (

Rainfall erosivity maps and mean absolute percentage error (MAPE) maps for three estimation models: (a) observed, (b) daily, (c) monthly, and (d) annual models.
4. Conclusions
The rainfall erosivity factor (R) is one of the key factors in the USLE model and has gained increasing importance as the environmental effects of climate change have become more severe. This study has proposed three models for estimating the value of R based on daily, monthly, and annual precipitation data of rainfall station network, respectively. The validity of the three models has been evaluated using the rainfall data collected over a period of ten yrs (2002~2011) at 55 rainfall stations in southern Taiwan. The results have shown that, of the three models, the annual and monthly models yield a better agreement with the observed rainfall erosivity factor than the daily model.
Footnotes
Conflict of Interests
The authors declare that there is no conflict of interests regarding the publication of this paper.
Acknowledgment
The authors would like to thank the financial support provided by the National Science Council in Taiwan (NSC 102-2625-M-020-002).