
Abstract
Subway tunnel cracks directly reflect the structural integrity of a tunnel, and as such the detection of subway tunnel cracks is always an important task in tunnel structure monitoring. This paper presents a convenient, fast, and automated crack detection method based on a wireless multimedia sensor subway tunnel network. This method primarily provides a solution for image acquisition, image detection and identification of cracks. In order to quickly obtain a surface image of the tunnel, we used special train image sensor nodes to provide the high speed and high performance processing capability with a large-capacity battery. The proposed process can significantly reduce the amount of data transmission by compressing the binary image obtained by initial processing of the original image. We transferred the data compressed by the sensor to an appropriate station and uploaded them to a database when the train passes through the station. We also designed a fast, easy to implement fracture identification and detection image processing algorithm that can solve the image identification and detection problem. In real subway field tests, this method provided excellent performance for subway tunnel crack detection, and recognition.
1. Introduction
Subways are an important part of the current urban transportation infrastructure. Cracks, as an important type of damage, can influence the stability of the tunnel structure and require periodic inspection to assess subway line structural integrity and to ensure traffic safety. At present, China primarily conducts crack detection in subway tunnels by manual inspection. Manual inspection is slow and inefficient, and as such the development of automatic test equipment for tunnel crack detection is important.
Using image-processing techniques as the core of a tunnel crack detection device is a popular research path. A device of this type is normally divided into two parts, one for image acquisition and another for image processing. Previously proposed detection devices were installed on a test train. The design was integrated with the train and is conducive to industrial equipment, but there are obvious drawbacks. The testing train gathered all the detection information including for different lines and areas and thus the data can be difficult to track and manage for subsequent crack statistics and management. Additionally, the operator needs to enter the testing train to check the crack information. This increases the difficulty of management by this check method.
As such, we designed and implemented a subway tunnel crack detection management system based on wireless multimedia sensor networks to achieve systematic and informative tunnel crack detection. The system is comprised of three parts, namely, the tunnel detection train, a base station, and a data center. The tunnel detection train was equipped with sensor nodes for image acquisition, storage, and processing. The base station was set up at a subway station. When the detection train passed through the base station, it automatically transferred the image processing results to the base station. The base station then transfers the image processing results to the data center and the data center provides in-depth processing, management, and results.
The system was designed to address two key challenges, sensor node design and development of a crack recognition algorithm. A traditional image sensor node uses a CMOS sensor; however, this is not suitable for high-speed image acquisition. Therefore, we used a high-frequency CCD image sensor to capture the image. The limited sensor network bandwidth is a weakness in this system and creates a challenge in transferring the huge amount of image data collected to the base station in a short period of time. Additionally, the image processing stage requires a high-quality image, and image compression can seriously affect recognition results. As such, we cannot transfer images that have undergone image compression. Therefore, we added a high-speed processing module in the sensor node, where the module preprocesses the image into a binarized image for the crack identification algorithm. The binarized image can be highly compressed and restored by run-length coding without loss. This saves bandwidth and does not affect the recognition results.
Crack feature extraction is a challenging aspect of the crack identification algorithm. In the process of image acquisition, the noise affecting image quality will be produced by uneven illumination, camera shake, and other factors. Additionally, there are many various stains on the surface, pipes cables, and other infrastructures in the tunnel, and the proportion of crack information in the image is low; therefore, these disturbances can seriously affect crack identification. The difference between a crack and these various disturbances is a key consideration when attempting to extract crack information in a complex tunnel image. The proposed algorithm removes most of the noise by median filtering and through change and threshold segmentation in preprocessing and subsequently highlights a crack feature. This algorithm emphasizes three eigenvalues, namely, the connected area, the average width of connected regions, and the linear relationship between connected areas. Thus, the algorithm can automatically recognize a crack through these three eigenvalues.
This paper describes in detail the design of a wireless multimedia sensor network system and automatic crack recognition algorithm. We achieved subway tunnel crack detection and management by combining the design of a wireless multimedia sensor network and an automatic crack recognition algorithm.
2. Related Work
Earlier research on crack recognition systems was mostly concentrated in domains that applied to bridges and highways. Tung et al. designed a bridge crack detection system installed on a truck that consisted of manipulators and CCD cameras. An inspector used manipulators to control CCD cameras and obtains images of a bridge surface structure from the CCD cameras [1]. The crack recognition function in this system was done manually rather than automatically. Later, Pynn et al. proposed a highway crack detection system [2] installing TDI line scan cameras on an inspection van, in order to recognize cracks in images by using image processing technology after image collection. However, the paper gave no details on the recognition algorithm. With the development of tunnel traffic, a considerable amount of infrastructure in the tunnel entered into the curing period and researchers begin to pay attention to the design and development of tunnel crack recognition systems. Many researchers presented various devices suited for tunnel crack recognition. Ukai designed a tunnel crack detection system [3] using line scan cameras and LED light sources. The cameras and light sources were installed around the rectangular steel that covered the entire tunnel. Thus, the detection speed of this system can be up to 10–30 km/h. A tunnel crack detection device designed by Sasama et al. [4] included five line scan cameras and provided storage and illumination to every camera. Yu et al. proposed the use of a moving robot [5] to detect cracks in tunnels. The moving robot includes a linear matrix CCD camera, an automatic focusing device, and lighting device. It collects and stores tunnel images to extract data by using image processing technology. Lee et al. proposed a similar crack detection device [6], which has two parts named as an image collection system and image analysis system. Both of the systems were installed on an inspection van and finished image collection and processing while moving through the tunnel. From the previous studies, the linear matrix scanning camera was the best approach for tunnel image collection.
As part of a complete tunnel crack detection system, a mature algorithm for crack recognition is both essential and difficult challenge for research. Currently, there are many crack recognition algorithms without one that is generally accepted as most useful. Landstrom and Thurley presented a crack recognition algorithm based on mathematic morphology [7], using different structure units to provide an opening-and-closing operation on an image to highlight crack features and finally extract crack information. Liu et al. imported SVM [8] to improve the accuracy of crack recognition. Despite continuous learning, Liu et al.'s process builds a taxonomic relation between types of cracks, such as noncrack and intermediate, thus capturing crack information more accurately. Miwa M. generated a valley line scale space of an image by using a watercourse method to detect tunnel cracks. Fujita and Hamamoto injected a multiscale hessian matrix and probabilistic relaxation model [9] based on image processing and used probability to deduce crack information. Abdel-Qader et al. compared four edge-detection methods (FHT, fast Fourier transform, Sobel, and Canny) and applied them to crack detection [10]. An algorithm proposed by Nishikawa et al. improves the image filter [11], increasing crack recognition accuracy via continuous learning. Rabinovich et al. combined an extended finite element method and genetic algorithm [12] to accomplish and improve crack extraction. Yamaguchi et al. presented an image-based percolation model [13] by extracting the shape of a connected region on the basis of brightness and texture. According to this model, Yamaguchi et al. also proposed a noise reduction algorithm. Amstutz et al. injected topological sensitivity [14] into crack recognition and realized it with topological asymptotic expansion.
3. System Architecture
This paper proposes a new subway tunnel crack detection method and designs a subway tunnel crack detection system based on a wireless multimedia sensor network. This system includes four components: a vehicular wireless multimedia sensor node, a station sink node, a cable transmission access module, and a central server. Figure 1 shows how the system operates.

Diagram of system operation.
Step 1.
A vehicular wireless multimedia sensor captures an image, stores image, and disposes and compresses the image in accordance with default parameters when the train runs through a tunnel. During this phase, data does not need to be transmitted.
Step 2.
When the train arrives at a station, the vehicular wireless multimedia sensor transmits all of the compressed images from the previous tunnel to a station sink node via a wireless network.
Step 3.
After receiving the data, the sink node transmits the received image data to a central server though a cable transmission access module.
Step 4.
The central server processes the received data by using a new subway tunnel crack detection method and analyzes the results. If there is a serious crack detected, the central server can find the original image on the basis of various requirements.
Step 5.
An administrator can check the detection results directly on the central server and can also remotely access data in real time from the central server via an internal company network.
3.1. Vehicle Wireless Multimedia Sensor
As the sensors are constantly moving, image resolution, processing speed, and storage capacity have specialized requirements based on several objective conditions. Therefore, the vehicle wireless multimedia sensors (VWMS) used here are not off-the-shelf sensors normally found in the market. It was necessary to design a set of VWMS.
According to requirements, the structure of the sensors is shown as Figure 2. The VWMS is composed of the following five modules: a CCD camera image-capturing module, a high-speed processing module, a large-capacity storage module, a large-capacity battery, and a wireless communication module.

The structure of sensor node.
The CCD camera image-capturing module is primarily for capturing the surface images of tunnel areas. The high-speed processor is primarily for processing the captured tunnel surface images. The processor can obtain binary image data with a corresponding compression rate by compressing and preprocessing images according to preset parameters. A large-capacity memory is primarily for the storage of captured tunnel surface images and binary image data that is compressed and preprocessed by high-speed processor. The wireless communication module is primarily for compressing and coding the binary image data that is waiting for transmission (e.g., Run Length Coding) and transmitting to collection nodes by radio. A large-capacity battery is primarily for supplying power and maintaining normal operations in the other modules.
VWMS was deployed on a train as shown in Figure 3. The proposed system simply modifies a regular subway train. The CCD camera image-capturing module is fixed to the outside of the train. Speed sensors need to be placed on the pair of wheels to determine capture position. A wireless communication module is mounted on top of the train in order to guarantee a good signal. Lastly, the other modules are placed inside the train.

Diagram of deployment of VWMS on a train.
The CCD camera image-capturing module is composed of a CCD image sensor and a laser source, which is able to shoot a clear tunnel surface image from a high-speed train by using a high sample frequency. The laser source has the advantages of high intensity, slow decay, and avoidance of crack misrecognition as a dark captured image. In order to cover the whole tunnel transverse section, the proposed system utilizes nine image sensors and four laser sources. The size of a tunnel transverse section is 14 m, and the capture range of each image sensor is set to 1.8 m. Therefore, an overlap area exists between adjacent sensors, which can be helpful in creating image mosaics. The laser sources are positioned outside of image sensors, and the light sources shined in the tunnel transverse section as vertical stripe. After the adjustment, lasers from four laser sources are connected into the shape of a circular arc that can cover the whole transverse section. All the devices are placed on a stationary barrier at the end of the train. The devices consisting of image sensors and laser sources can adjust their angles and distances to adapt to different tunnel structures and to achieve the best capture results. The deployment of the CCD camera image capturing module is as shown in Figure 4.

Deployment of CCD camera image capturing module.
3.2. Station Collection Node
The station collection nodes received data from the VWMS passing the station area. Collection nodes are connected with a station server. After the server receives the transmitted image data, the proposed subway tunnel crack recognition algorithm (STCRA) can be applied for further analyses to obtain results on cracks and to provide results for analysis.
3.3. Module of Wired Access and Transmission
Each station server is able to access the Internet by using twisted-pair cable. Therefore, all the tunnel crack data can be gathered. An administrator can check all the crack information in real time from any terminal with Internet access, such as personal computer, laptop, tablet, or cell phone.
4. Crack Detection and Classification Method
The proposed STCRA can be divided into two parts: image preprocess and crack detection. Image preprocess contains median filtering, high cap transformation, and threshold segmentation. Finally, binary image data from the original images can be obtained. This part of the process is completed by the high-speed processing module. Compressed encoded binary image data is transmitted to the base station. The binary image data contains crack information and noncrack information. The base station achieves crack autorecognition by decoding and through crack information extraction from the binary image data according to three crack features. The processing of the proposed algorithm is shown as Figure 5.

The algorithm processing flow.
This paper explains the process of STCRA by using a sample tunnel image as shown in Figure 6.

A sample image of tunnel crack.
4.1. Median Filtering
In the process of capturing images, a great deal of noise exists because of vibrations from the train and the uneven illumination. Without reducing this noise, although the binary image data is able to retain effective crack information after threshold segmentation, crack information extraction suffers negative effects as a result of too much noise.
Median filtering is a nonlinear smoothing technique, which assumes the gray value of each pixel as the median value of all the pixels inside a certain neighborhood window

Images of certain sizes need certain neighborhood windows. As high-resolution images were captured by the system, a 9 by 9 pixels square window was used for median filtering. Figure 7 shows the treated image by median filtering.

The treated image by median filtering.
4.2. High Cap Transformation
Compared with the background area, a crack area has an obviously low gray value. The crack information in an image can be highlighted by this characteristic. The proposed algorithm makes use of high cap transformation, which is an operation of morphological transformation and is calculated by a subtraction between the closed operations of the original images and themselves:

By extracting the less obvious targets of a low contrast area, the transformation can be used to detect the peak value of the gray value of the original images.
In (2), I represents the original image and
4.3. Threshold Segmentation
OTSU is a current and generally used threshold segmentation method, which seeks an appropriate gray value division by maximizing the variance among sections and minimizing the variance inside each section, and divides an image into a target and background according to its gray level.
In this algorithm, the crack area and other low gray value areas are the target areas and the other areas are background areas.
The binary image data is obtained by using big law threshold segmentation for high cap transformed images. There are some circumstances to consider regarding the target areas of binary image data as shown in Figure 8.

The binarization image.
4.4. Crack Extraction
Two problems exist for the target areas of binary image data, which are as follows.
By artificial observation of binary image data, crack areas and noncrack areas can be easily separated. However, for machine recognition, it is necessary to determine some characteristic parameters in order to solve the above problems and realize automatic recognition.
4.4.1. The Area of Connected Areas
First of all, cracks generally have continuous and connected strip areas. However, due to uneven illumination and stains, the connected areas are usually decentralized and distributed, and may not have continuous connectivity. Therefore, some noncrack areas can be roughly eliminated by calculating the area of connected areas.
Here a threshold named
It should be noticed that some effective crack information may be eliminated if the threshold of the area of connected areas is too large. Therefore, the threshold should be as small as possible. Meanwhile, this kind of process results in some noncrack areas being included and the crack information cannot be extracted effectively. As such, further reprocessing is necessary. Figure 9 shows the result of first eliminated image.

The image after first elimination of noncrack areas.
4.4.2. The Average Width of Connected Areas
Large areas with stains exist on the images of the tunnel surfaces, and it is difficult to eliminate them according to the area of connected areas.
By expansion processing of the eliminated images as shown in Figure 10, adjacent connected areas are connected and shaped into large connected areas. And for the dirty parts of the wall, noncrack areas will be connected and shaped into large connected and cluster distributed areas, which have significant differences with slender distributed cracks.

The image after expansion processing.
Hereby, we define the average width of connected areas as the basis for the elimination of noncrack areas. Define

The image after twice elimination of noncrack areas.
4.4.3. Linear Relationship of Connected Areas
When there are few surface stains, the method mentioned above cannot be efficient because the average width of the connected areas may not be greater than the threshold
The intervals connecting noncrack areas are generally dispersed and it is hardly possible to find a straight line on which all centroids are made approximately. Fractures may appear in crack areas after binarization, and fractured areas connect together after expansion process. Then the centroids of fractured areas are approximately regarded as being on a straight line. According to this characteristic, crack areas can be separated from noncrack areas. The correlation coefficient R among data points of least squares can be utilized to describe the characteristic.
In the elimination of noncrack areas, the connected areas after the expansion process are used as test data, while each centroid of connect areas act as a data point. According to the equation of the correlation coefficient R of least squares, the linear correlation of data points is calculated. Given the threshold
According to the recognition results, as shown in Figure 12, all the crack areas were recognized. Although misjudgments exist, the results were acceptable.

The image after a third elimination of noncrack areas.
4.4.4. The Calculation of Length and Width of Cracks
Calculate the area S of recognized crack areas. By refining the recognized crack areas, the length of cracks is the sum of all the white pixels of the areas. And the width of cracks is calculated by the equation
5. Experimental Results
In this section, we introduce an experimental simulation of the proposed system. We took images from two runs through tunnels in an interval in a real subway as a sample. The sink nodes and servers were located at two corresponding stations. The length of each tunnel interval was about 1,000 m. A train was converted to act as an experimental vehicle. The CCD camera image acquisition module consisted of nine sets of cameras with 6,144 pixels and the line rate was 20 K. The light source adopted four infrared laser light sources. A wheel pulse sensor was selected as the speed sensor. The speed of the experimental vehicle was about 18 km/h. Each original image was 6,144 × 1,024 pixels, requiring approximately 6 MB for storage.
The original images were compressed in the high-speed processors via median filtering, top-hat transform, binarization, JBIG, and run-length coding. The median filtering, top-hat transform, binarization, and JBIG had variable parameters. We chose appropriate parameters and the images were compressed to 100 K each.
5.1. Performance Analysis of Crack Identification
We selected several images in the experiment for performance analysis of the proposed system.
(1) Breadthwise Crack. The original image obtained by the CCD camera image acquisition module is shown as Figure 13. We can find a breadthwise crack on the right side of the image. And Figure 14 shows the image, which is the version proposed by the in-vehicle wireless multimedia sensors. It was sent to the sink nodes at a station.

An original image with breadthwise crack.
The image proposed by in-vehicle wireless multimedia sensors.
The sink nodes send the images received to the servers. The proposed system is installed on the servers. The image of Figure 15 is the result of software analysis by our system. We can clearly find the extracted shape of the crack in the image.
Analysis result of the image with breadthwise crack.
(2) Endwise Crack. The original image obtained by the CCD camera image acquisition module is shown as Figure 16. We can find an endwise crack on the right side of the image. The image in Figure 17 is the version proposed by the in-vehicle wireless multimedia sensors. It was then sent to the sink nodes at a station. The sink nodes send the images received to the servers. The proposed system is installed on the servers. Figure 18 shows the result of software analysis by our system. We can clearly find the extracted shape of the crack in the image.

An original image with endwise crack.

The image proposed by in-vehicle wireless multimedia sensors.

Analysis result of the image with endwise crack.
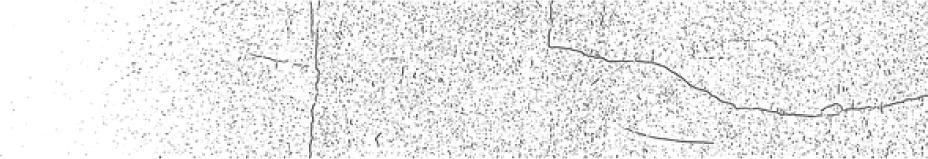
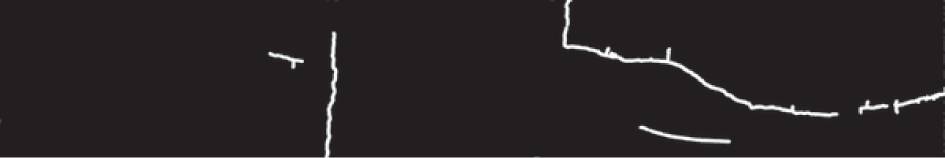
(3) Inhomogeneous Illumination. The original image obtained by the CCD camera image acquisition module is shown as Figure 19. There is a line of demarcation in the middle with inhomogeneous illumination. We can find a breadthwise crack on the image. The image of Figure 20 is the version proposed by the in-vehicle wireless multimedia sensors. It was then sent to the sink nodes at a station.

An original image with inhomogeneous illumination.

The image proposed by in-vehicle wireless multimedia sensors.
The sink nodes send the images received to the servers. The proposed system is installed on the servers. The image in Figure 21 is the result of software analysis by our system. We can clearly find the extracted shape of crack in the image. However, in the demarcation area of the illumination, there is something that looks like crack. This is because the luminance was too high.

Analysis result of the image with inhomogeneous illumination.
In the experiment, we took images of the surface of a 2 km long tunnel, in which 569 cracks were marked by artificial cognition. The proposed system picked out 909 suspected cracks, which contained 450 false cracks. The results are shown in Table 1.
Detecting results 1.

Therefore, the precision of the proposed system was 459/909 = 50.5%.
Recall was 459/569 = 80.7%.
Now we discuss the length of cracks. Artificial recognition identified 179,143 mm of cracks. The proposed system picked out 296,560 mm of suspected cracks, which contained 148,365 mm of false cracks. The results are shown in Table 2.
Detection results 2.

In this case, the precision of the proposed system was (296,560 − 148,365)/296,560 = 50.0%.
Recall was (296,560 − 148,365)/179,143 = 82.7%.
5.2. Performance Analysis of Image Compression
In the proposed system, there are two parameters that affect the quality of image compression, neighborhood size of median filtering, and feeler diameter of the top-hat transform.
5.2.1. Neighborhood Size of Median Filtering
Now we discuss how neighborhood size affects compression ratio. We set the feeler diameter of the top-hat transform at nine pixels and changed the neighborhood size of the median filtering. The shape of the neighborhood is a square, and sizes ranged at 3 × 3, 5 × 5, 9 × 9, 13 × 13, 15 × 15, and 21 × 21. Then we calculated the compression ratio of the image after JBIG and run-length coding with different parameters. The results are shown in Figure 22.

The relationship between neighborhood size and compression ratio of median filtering.
Taking the same image as an example, we analyzed the differences in an image for transmitting and identification of results with neighborhood sizes at 3 × 3, 5 × 5, 9 × 9, 13 × 13, 15 × 15, and 21 × 21. In Figure 23, images for transmitting after JBIG are on the left side and crack identification results are on the right side.
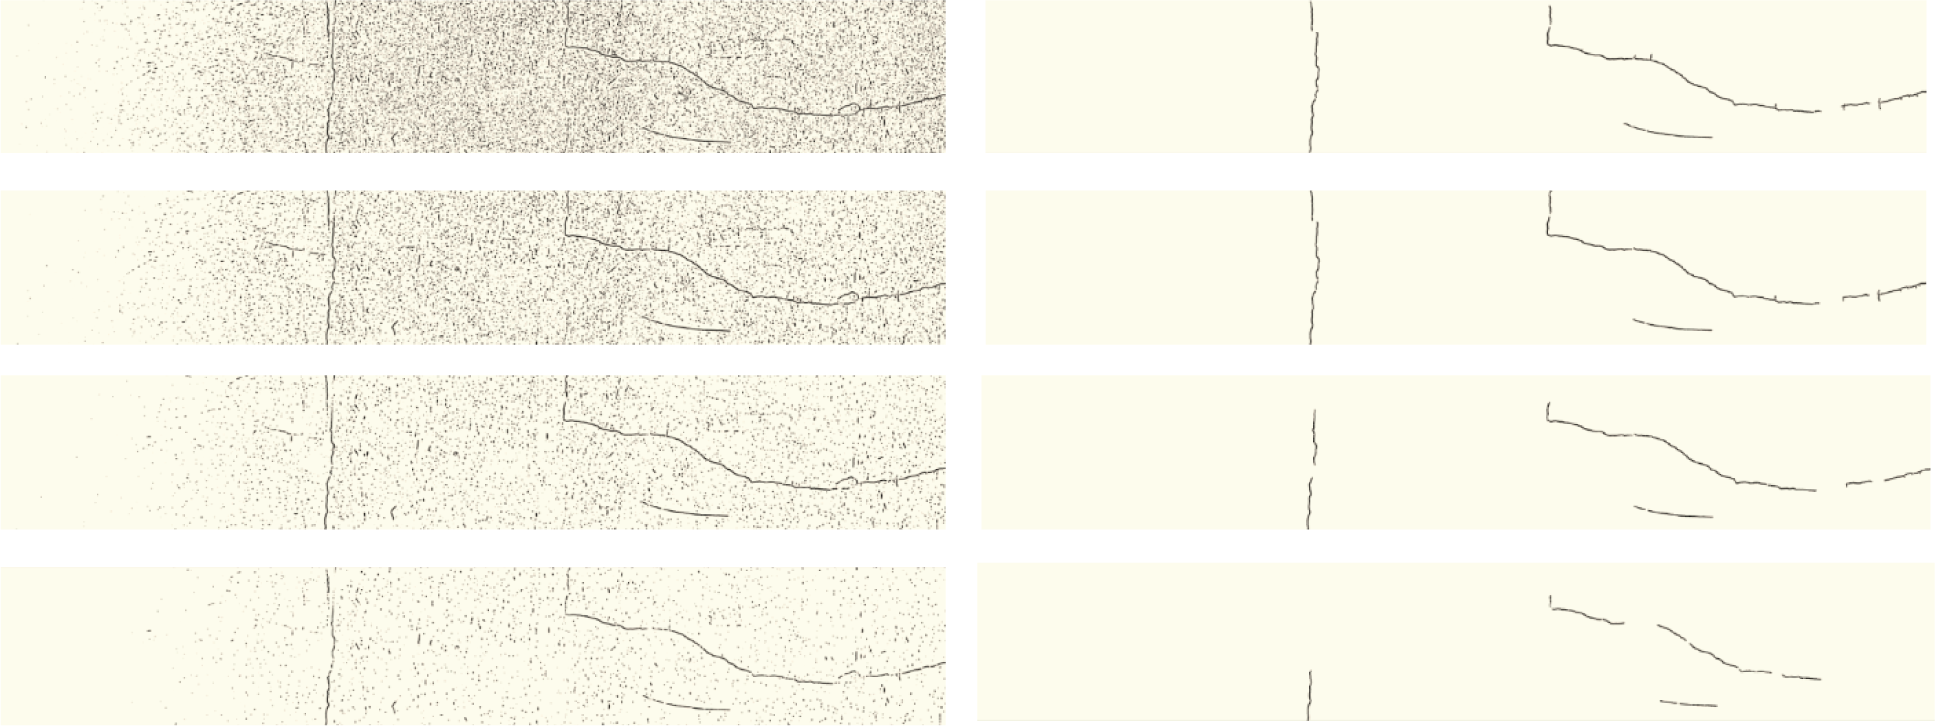
The influence of neighborhood size of median filtering on the image for transmitting and identification results.
Obviously, the conclusion based on the figures is that larger neighborhood sizes lead to a higher compression ratio and less noise in images for transmission but worse performance in crack identification (detection radio).
5.2.2. Feeler Diameter of the Top-Hat Transform
Now we discuss how the feeler diameter of the top-hat transform affects the compression ratio. We set the neighborhood size as 9 pixels × 9 pixels and changed the feeler diameter of the top-hat transform. The lengths of the feeler diameter ranged at 5, 7, 9, 11, 15, and 21 pixels. Then we calculated the compression ratio of image after JBIG and run-length coding with different parameters. The results are shown in Figure 24.
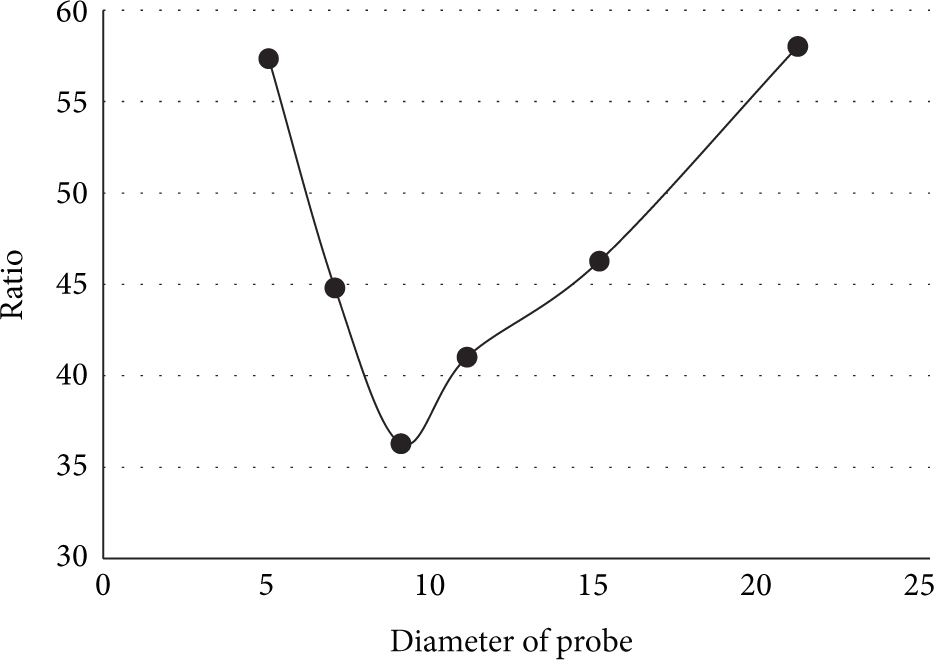
The relationship between the feeler diameter of top-hat transform and the compression ratio of image.
Taking the same image as an example, we analyzed the differences in images for transmitting and identification of results with the feeler diameter of top-hat transform at 5, 7, 9, 11, 15, and 21 pixels. In Figure 25, images for transmission after JBIG are on the left side and crack identification results are on the right side.

The influence of the feeler diameter of top-hat transform on the image for transmitting and identification results.
We can find the following points from the figures above. When the feeler diameter is small, there is little effective information in the image for transmission, the compression ratio is high, and cracks can hardly be marked. When the feeler diameter reaches a threshold, as the feeler diameter becomes larger, less noise appears in the image for transmission, and the compression ratio becomes higher. However, existing noise is also enhanced, which is detrimental to identification, and reduces precision.
6. Conclusion
In this paper, we proposed and designed a subway tunnel crack detection and identification algorithm based on a wireless multimedia sensor network (WMSN). We applied a special WMSN with improved ability for processing and storage to overcome limitations in traditional WMSN. The proposed system has avoided complex calculations, while retaining excellent detection results. The proposed system accomplishes sublevel processing in crack detection with WMSN. One consideration to note is that since the results of the proposed system are binary images, it is convenient for transmission and facilitates crack identification but the original image is lost. We can retrieve the original images from the wireless multimedia sensors. Suggestions for future research include the following: (1) development of a fast crack-image processing algorithm; (2) improvement of the identification algorithm and enhancing precision; and (3) creating a novel crack quantization algorithm with improved accuracy.
Footnotes
Conflict of Interests
The authors declare that there is no conflict of interests regarding the publication of this paper.
Acknowledgments
This research is supported by National Natural Science Foundation under Grant 61371071, Beijing Natural Science Foundation under Grant 4132057, Beijing Science and Technology Program under Grant Z121100007612003, and Academic Discipline and Postgraduate Education Project of Beijing Municipal Commission of Education.