
Abstract
Wi-Fi has been widely adopted by families in Taiwan, for it has the advantage of designing family monitoring systems with its wide usage. Therefore, there are many advantages for designing family monitoring systems. Based on our previous research architecture, we implemented a monitoring system for family environments based on Wi-Fi and sensor technologies. Humidity, gas, smoke, and temperature sensors are applied for designing and developing the intelligent home environment monitoring system in this paper. A system prototype is proposed in this research, and the experimental results are discussed. The results showed that the system is workable and remarkable for environment monitoring. The contribution of this is to propose a framework for future home environment monitoring system developers to refer to.
1. Introduction
A quarter of the families in Taiwan use Wi-Fi with their own access point (AP). Using Wi-Fi for data transmission is easier than transmission using ZigBee due to its reliability and its popularity. Many research centers have proposed the concept of home automation, home monitoring, or intelligent home concepts, listed as follows. It has been shown that the smart home technologies have reached a good state of maturity but the spreading is still marginal and mostly restricted to demonstration projects [1].
Some home automation, hone monitoring and intelligent home projects was already proposed as follows: Adaptive House, University of Colorado: http://www.cs.colorado.edu/~mozer/nnh/ Carnegie Mellon's Intelligent Workspace: http://www.arc.cmu.edu/cbpd/iw/index.html Duke University Smart House: http://smarthome.duke.edu/ Georgia Tech Aware Home: http://www.cc.gatech.edu/fce/ahri/ Humboldt State CCAT: http://humboldt.edu/clubs/club_sites/ccat MavHome at University of Texas Arlington: http://ailab.wsu.edu/mavhome/ Medical Automation Research Center at UVA: http://www.medicine.virginia.edu/ MIT House_n: http://web.mit.edu/cron/group/house_n/ MIT Media Laboratory: http://www.media.mit.edu/ NC State Solar Center: http://www.ncsc.ncsu.edu/ Oberlin College: http://www.oberlin.edu/ajlc/ajlcHome.html Smart Medical Home: http://www.urmc.rochester.edu/ UNC Office of the Future: http://web.media.mit.edu/~raskar/UNC/Office/ Touch Center, National Cheng Kung University, Taiwan: http://touch.ncku.edu.tw/.
In this paper, an idea using Wi-Fi to transmit data from a sensor to a computer at a high speed is proposed based on our previous architecture published in the TANET 2013 Conference in Taiwan [9]. The previous research was a system prototype of Wi-Fi based home monitoring platform, which has not been verified or experimented. In this research, we discussed and described more details of Wi-Fi applications for home monitoring based on not only Wi-Fi but also digital signal processor (DSP). Furthermore, experiment process flow with results is also discussed in this paper in order to propose a framework for future home environment monitoring system developers to refer to.
Remote monitoring is used to monitor the room temperature, the humidity, and the environmental quality related to the use of gas. In addition, MPLAB IDE programming development tools are used to write a program into MCUs (microcontroller units) and to set the temperature, humidity, and gas thresholds. When one of these is above the threshold, the alarm system, cooling system, or dehumidifier will be turned on automatically. Then, a cell phone is used to deliver a message to the administrator when the concentration of gas is above the threshold. This research is based on Wi-Fi wireless technology to develop an intelligent home environment monitoring system, and its contributions are as follows: using database and Wi-Fi wireless technology to develop a monitoring center for a home environment; using Wi-Fi to provide sensors for room temperature, humidity, and gas; allowing instant room adjustments to the environment; developing a graphical user interface (GUI) system for monitoring the power switch of any home facilities; developing a low-cost home monitoring embedded inductor system; using a short message service to notify the administrator when the concentration of gas is above the threshold.
2. Literature Review
Most researches for home environment monitoring are named as “smart home.” Some representative literatures are discussed in this research and summarized as in Table 1.
Literature reviews of smart home.

2.1. Comparison between Wi-Fi and ZigBee
ZigBee is a low-speed, short-distance transmission based on an IEEE 802.15 standard. It is currently in use not only in the military but also in the home care services and for applications related to environmental safety. The transmission speed of ZigBee is 10 K to 250 Kbps, and the distance is several dozens of meters. Yi et al. provided the following characteristics of ZigBee [11]. Saving Electricity: ZigBee can work for about 6 to 24 months by using batteries. High Reliability: when there are some requirements for the delivery of data, it will deliver it immediately and will also do a bidirectional check. The reliability of system information transmission thus will be raised substantially. High Expandability: the amount of networks nodes in ZigBee can be a maximum of 64,000. Wi-Fi is a wireless local area network based on the IEEE 802.11 standards, and it is also a short-distance wireless messaging technology. The maximum transmitted speed of Wi-Fi is 54 Mbps, and its transmission radius is 100 m. In addition, equipment with installed Wi-Fi is widely available in the market and includes things like computers, console games, MP3 players, smart phone, printers, and notebooks.
It is used for big data network transmissions, mainly including mobile video conferencing, public wireless Internet access, and other electronic products used for wireless transmission. Lee et al. provided the following characteristics of Wi-Fi [12]. Standard Maturity: IEEE formulated the bandwidth, speed, and physical layer in 1997. The provisions and integration are therefore already mature. High Recognition by the Public: there are a lot of products equipped with Wi-Fi. Android and iPhone can serve as an access point to allow other types of equipment to link to the Internet. Low Interference: the frequency of Wi-Fi is 2.4 GHz; it will not be interfered with by Bluetooth, cell phones, or microwave ovens.
2.2. Related Researches on Wireless Home Monitoring
Yu and Cheng used Bluetooth combined with Wi-Fi and a sensor module to detect users’ vital signs and to provide information about the flexibility and mobility of the patients under consideration [13]. It allows medical instruments such as electrocardiograms to be brought anywhere. However, in this study, Bluetooth was still used to transmit the data, and Wi-Fi was used to link to the Internet. If Wi-Fi had also been used to transmit the data, it could have been used more comprehensively.
Yu-Han and Jin-Hai used Wi-Fi to construct a home monitoring system. Wi-Fi was used to connect the sensor and network, and GPRS was used to connect to a cell phone to provide the latest information from every sensor [14]. However, it was not able to solve environmental problems such as providing a warning about high temperatures in the absence of the cooling system, so users had to resolve such situations themselves.
Many control systems for home monitor or control were proposed in recent years, which shows that the integration of wireless sensor network for home monitoring was workable [15–25]. Some other researches for smart city, surveillance, fire safety for home, and home monitoring application research topics are also discussed in recent years [26–30].
3. Research Methods
3.1. Design of Framework for Home Monitoring Systems
Our research on an intelligent home environment monitoring system framework is focused on intelligent monitoring using fan, dehumidifier, and warning messages from a cell phone to monitor temperature, humidity, and gas levels in a home, as illustrated in Figure 1. On top of the picture is the center of the monitoring system, and the monitoring network is built using Wi-Fi. The sensor nodes linking to every kind of sensor are built into the rooms everywhere, thus providing sensors and data from places where this information is relevant. The Wi-Fi module is then used to transmit the data to the user side of the home monitoring center using a Dynamic Host Configuration Protocol server (DHCP server). The database center includes the server data and the PC side, and this platform is in charge of saving the monitored data. The home monitoring center includes the user interface and a database so that users can operate the automatic equipment and monitor every environmental concern.
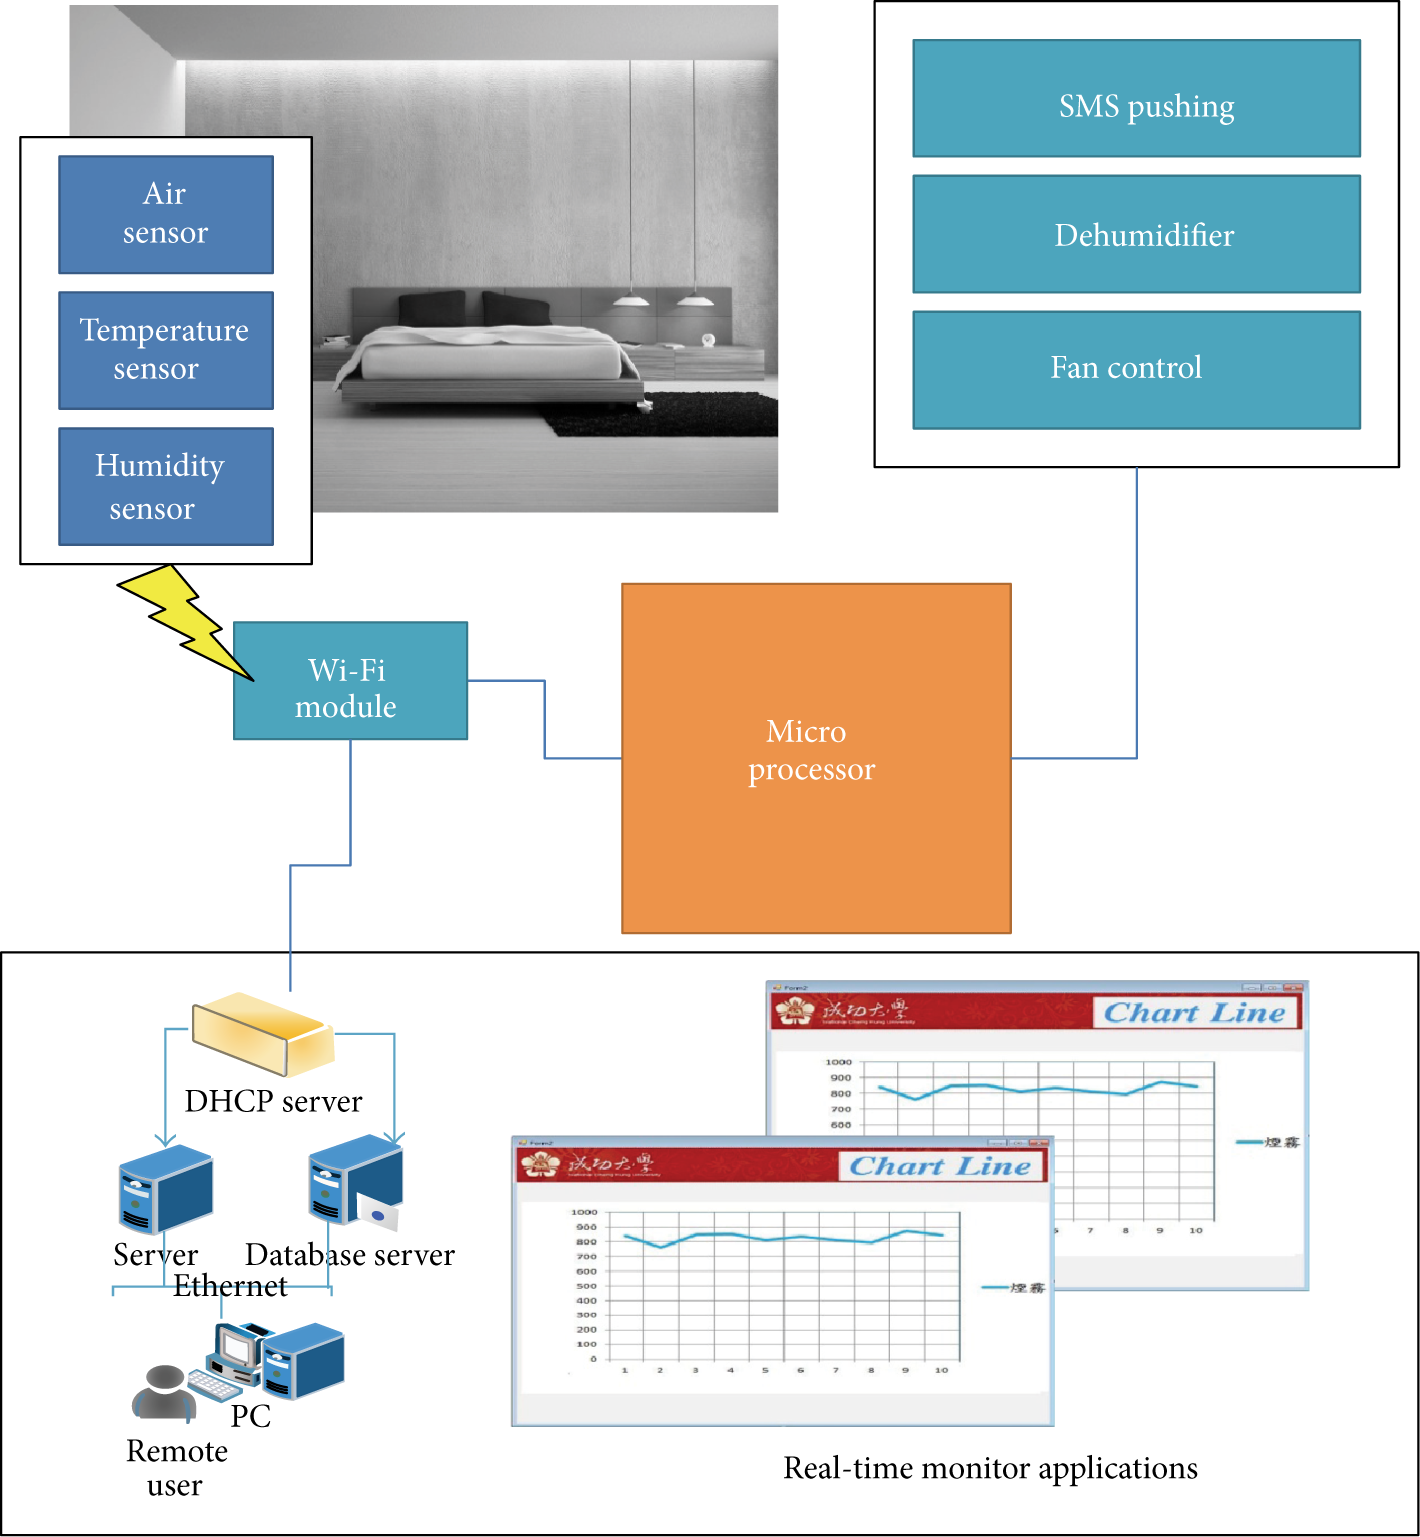
Intelligent home environment monitoring system framework.
3.2. Development and Implementation of Wi-Fi Wireless Network
The sensor data in this research is transmitted by the Wi-Fi wireless network. The sensing circuit with the Wi-Fi module requires an IP address that can help it link to the Internet to transmit the data. We adapted a DHCP server to cover all the Wi-Fi modules and dynamically allocated a virtual Internet Protocol (IP), thus allowing the equipment to have a wireless link to the Internet. A home monitoring system needs real-time data regarding room temperature, humidity, carbon monoxide, smoke, and methane; Wi-Fi is used because of its high-speed transmission and wide wireless network. To achieve system miniaturization and cost reduction, we use a Wi-Fi module to transmit the data. The RN-131-EK Evaluation Board is used to evaluate and design the system based on Wi-Fi module. The universal asynchronous receiver/transmitter (UART) is used as the interface because it is not necessary to understand TCP/IP protocol and because the applications can be designed easily. The module supports 2.4 GHz IEEE Std. 802.11b and can obtain IP addresses using a DHCP server assigning dynamically. The data rate goes up to 2 Mbps, and the network coverage goes up to 400 meters. This module can be designed and developed using a microchip high-level microcontroller for network cost reduction and high-speed data transmission.
3.3. Sensing Circuit Architecture
In this study, it is necessary for the high-speed data transmission sensing system to be combined with Wi-Fi wireless networks because Wi-Fi has high transmission distance, which is quite suitable for monitoring sensor network connections and equipment. Sensors depend on the demand provisioning of different environmental sensors and preliminary planning of the digital signal processor (DSP) core for sensing data acquisition and data transfer work; the sensing circuit architecture is shown in Figure 2: the middle sensing circuit and core DSP, left for the various sensors, the above control systems for the automation facilities, the right interface for the database, and the administrator. The monitoring sensor includes temperature, humidity, and gas (smoke, carbon monoxide, and methane).

Sensing circuit architecture.
3.4. The Temperature Sensing Process Based on Temperature Sensor
LM35 is a temperature sensor IC produced by National Semiconductor Company, which is adopted in this research for temperature sensing. The output at 0°C is 0 V, and as the temperature rises 1°C, the output will increase 10 mv. There are many different types of LM35 packages. At room temperature, we do not need to do calibration because the inaccuracy is between ±0.25°C. In home monitoring this is enough because the apparent air temperature is not very accurate, so this level of error is acceptable. There are two power supply modes for the LM35, which include a single supply mode and a dual supply mode, and the two modes are shown in Figure 3. The dual power supply can provide negative temperature measurements. The current-temperature mapping chart of current and temperature relationship is shown in Figure 4. The silent current is about 50 μA in the single supply mode at 25°C. When monitoring, first we set an interval value (T, default = 4) and let the temperature be stable within a specific range. The upper limit (U) and lower limit (L) are under manual control, and their conditions are
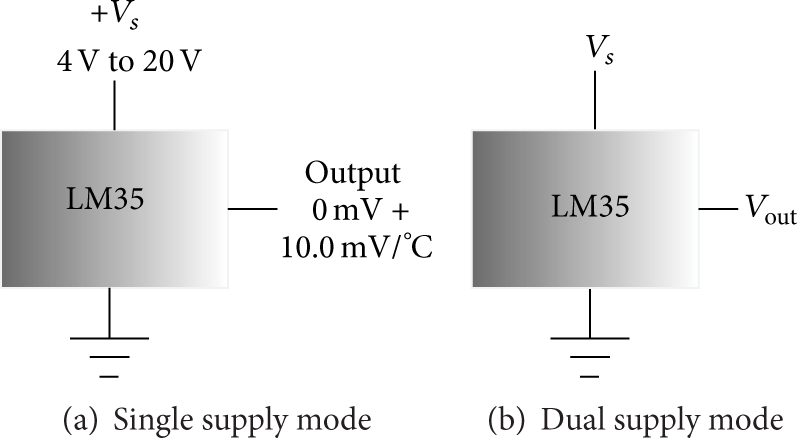
Two modes of LM35 IC [10].

Current-temperature mapping chart [10].
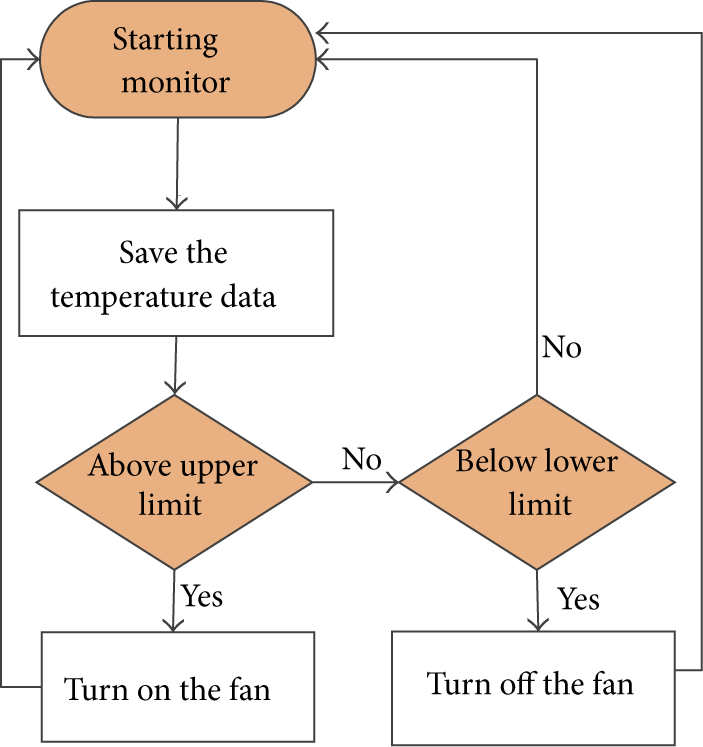
The temperature sensing process of this research.
3.5. The Monitor Humidity Testing Process Based on Monitor Humidity Sensor
In this study, we chose the HR-31 humidity sensor produced by the Arduino Company. It is famous for its wide monitoring range. The range of relative humidity is 20% to 80%. It can be used for a long term because of its high stability. It also fits in indoor environments like warehouses, homes, cars, and so forth. The test process is shown in Figure 6. First, when the humidity exceeds the upper limit, it starts dehumidification conditions. When the humidity is below the lower limit, the dehumidifier will be turned off, and all data will be stored.
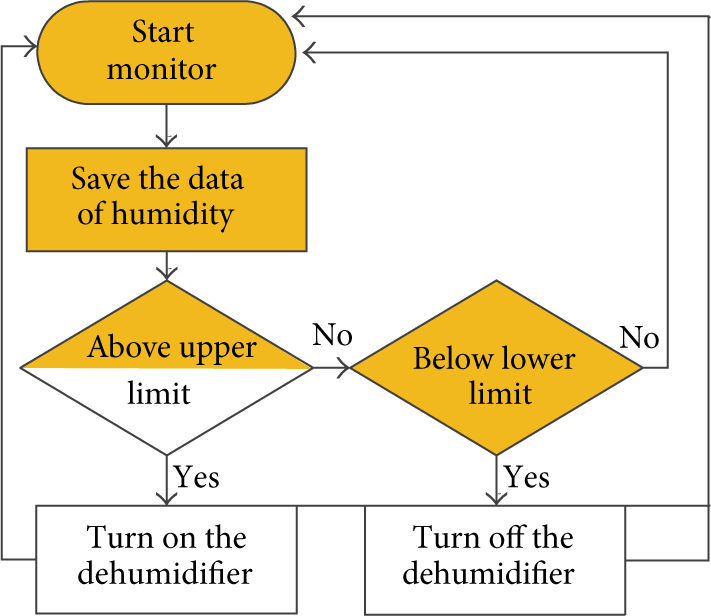
Humidity test process.
3.6. Design of Multisensor Sensing Process Flow
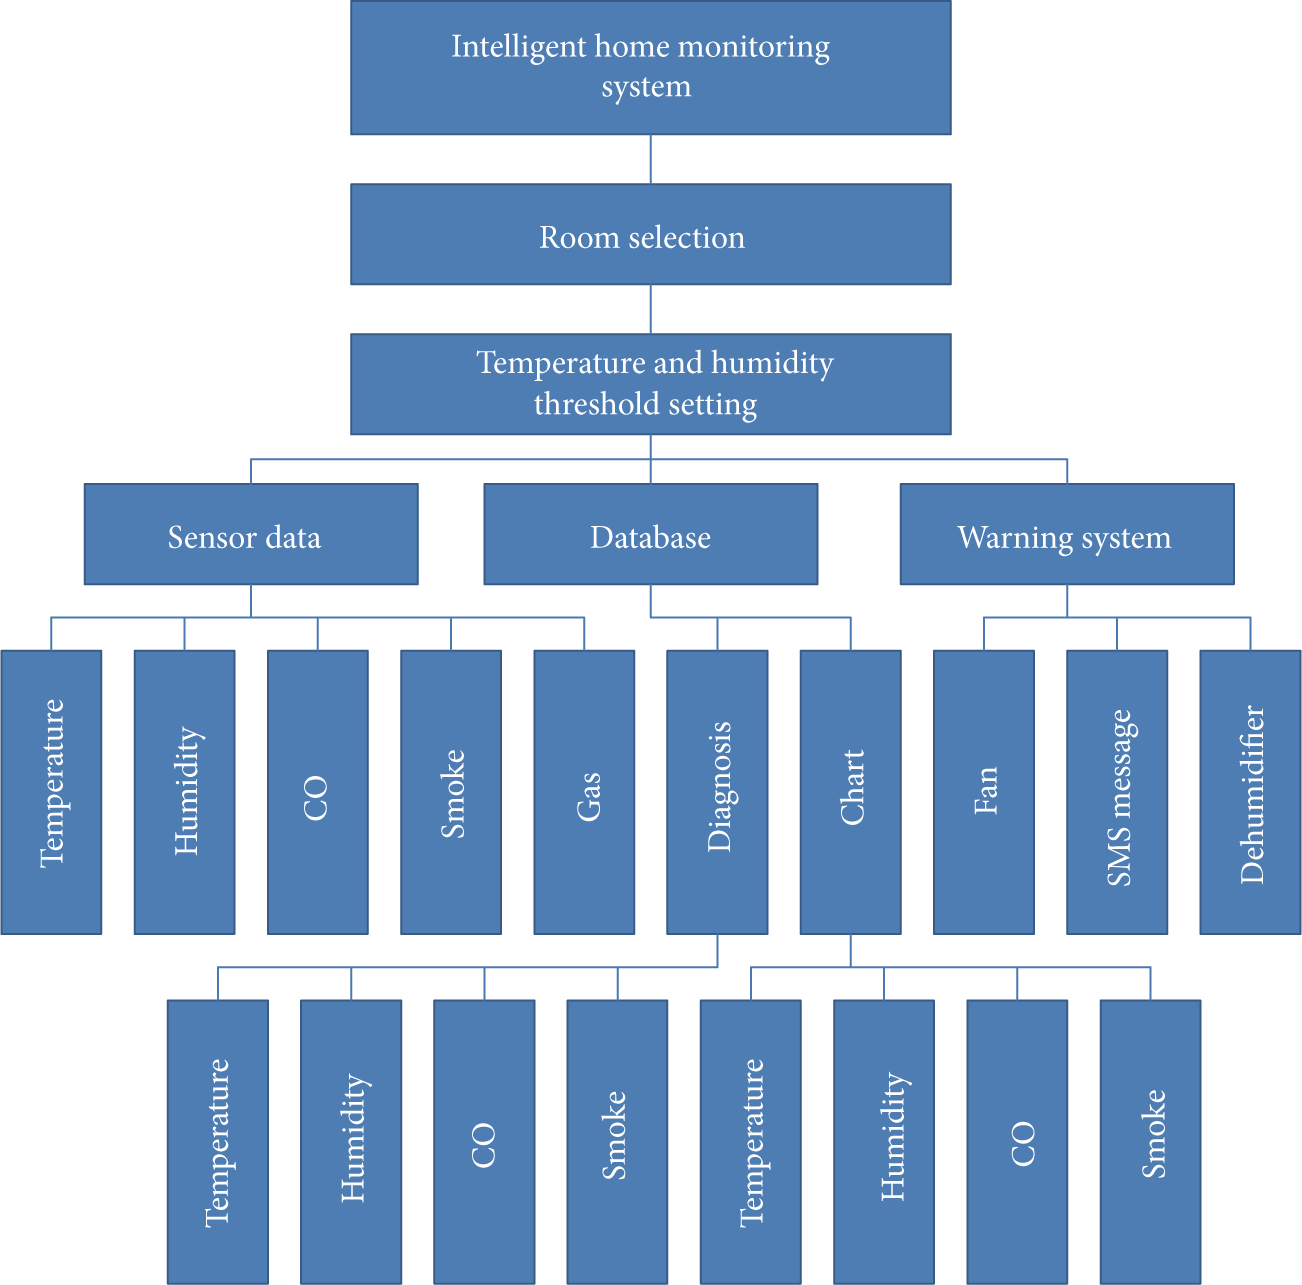
The carbon monoxide sensors used in this study were produced for the Arduino MQ-7 gas sensor. The smoke and gas sensors are produced for the Arduino MQ-2 gas sensor. Detection of gas sensitivity for a family in a range of 10 ppm to 10000 ppm is adequate. The multisensor sensing process flow is shown in Figure 7. When the concentration exceeds the threshold value, it will be released after the release of warning message until the gas level is below the threshold value. Figure 8 shows the functional model of home monitoring system; after users access the interface, they can choose the room that they want or switch it. After the room is chosen, the user can set the threshold for the temperature and humidity and push the start button. The screen will show the sensing factor. If users want to check the database and the sensing factor chart line, they click on “database” and look for the information for that factor. The user can adjust the fan, the warning, set the lights to blink or remain constant, and the message setting, or the phone number through the proposed real-time monitoring application, which is shown in Figure 1.
Multisensor sensing process flow.
Functional model of home monitoring system.
3.6.1. SMS Alarm Pushing
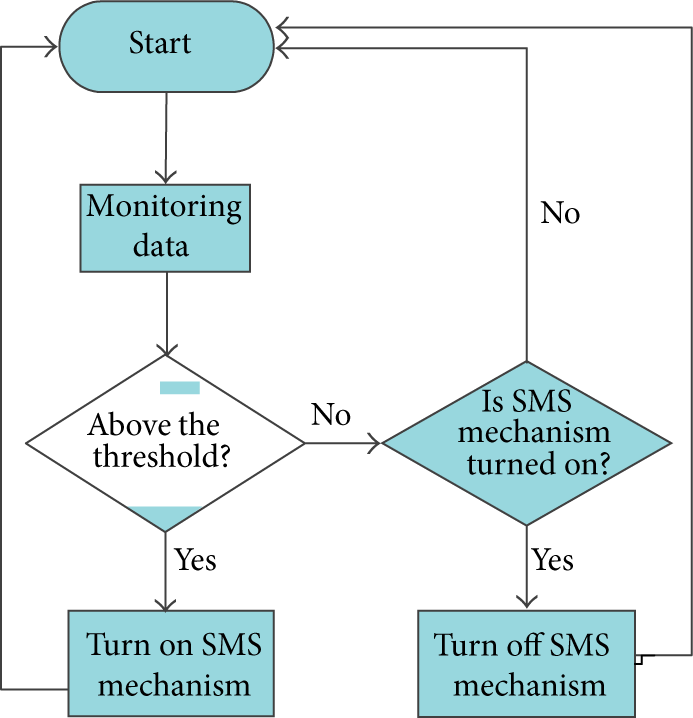
In this study, a mobile phone text message delivery is used to push SMS alarm messages when the gas concentration is too high, the ventilation system is opened, and text messages are sent to notify users that the concentration of dangerous gas has exceeded the threshold. Figure 9 is a flowchart for SMS alarm pushing. The upper left box “Application” has the SMS contents. The SMS alarm pushing process was developed by Visual C#. Users are able to take the message already set to hyperlink to the input queue by using Hypertext Transfer Protocol (HTTP). The program displays the alarm information with detail sensing information and data.

SMS alarm pushing flowchart.
4. System Deployment and Experiment Results
Carbon monoxide is produced due to the incomplete combustion of fuel. In addition to water heaters, stoves, and leakage, traffic exhaust fumes and indoor sources of smoke are major sources of indoor carbon monoxide. Therefore, in this study, the carbon monoxide threshold is set at 5 ppm. Smoke in low concentrations is nontoxic. According to the Environmental Protection Administration, Executive Yuan, Taiwan, the indoor concentration of smoke must be under 700 ppm. Therefore, in this study, the smoke threshold is set to 700 ppm. Gas can be divided into natural gas (CH4) and liquefied petroleum gas (C3H8). Gas will generally explode when it exceeds an explosion limit of 5%. Therefore, we set the gas threshold as 0.1% (1000 ppm) in this study [31]. Because everyone's apparent air temperature and humidity comfort level is different, users can decide their own ideal standard values for temperature and humidity. For the default in this study, we refer to the Environmental Protection Administration, Executive Yuan, Taiwan, suggesting that the temperature should be 25°C and the relative humidity should be 55%. The detailed temperature and humidity and upper and lower limits used in this study are shown in Table 2.
The settings of temperature and humidity.

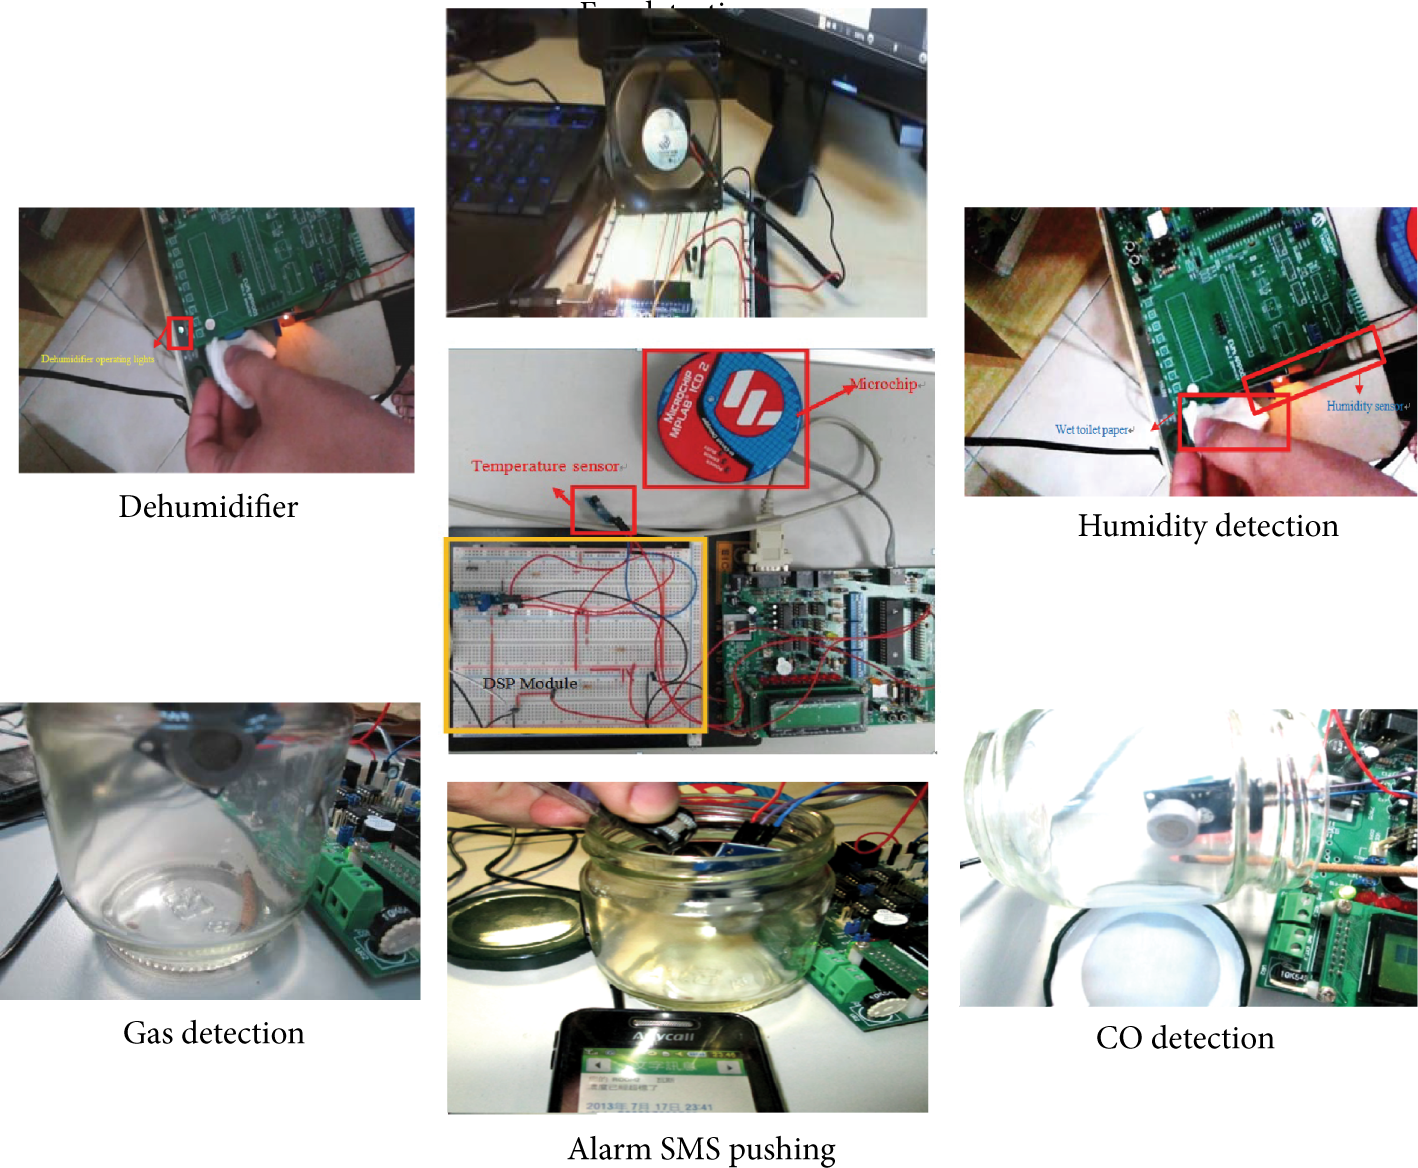
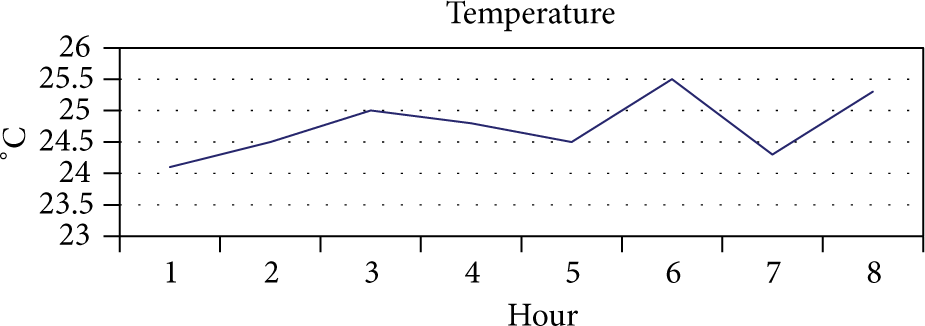
Figure 10 shows the experiment results of the developed system in this research. Some of the experiment processes are mentioned in our previous research [9]. The testing functions include fan detection, dehumidifier, humidity detection, gas detection, SMS pushing alarm, and CO detection. The experiment flow is shown in Figure 11. The experiment lasts for 8 hours, including temperature sensing, humidity sensing, carbon monoxide sensing, and gas sensing. The experiment results showed that the designed system based on our hardware architecture is workable, as shown in Figures 12, 13, 14, and 15.
Overall experiment scenario [9].

Experiment flow of multisensor embedded intelligent home environment monitoring system.
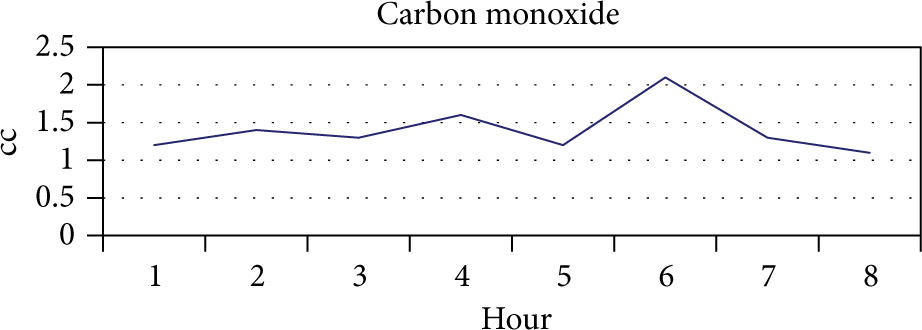
The experiment result of CO.
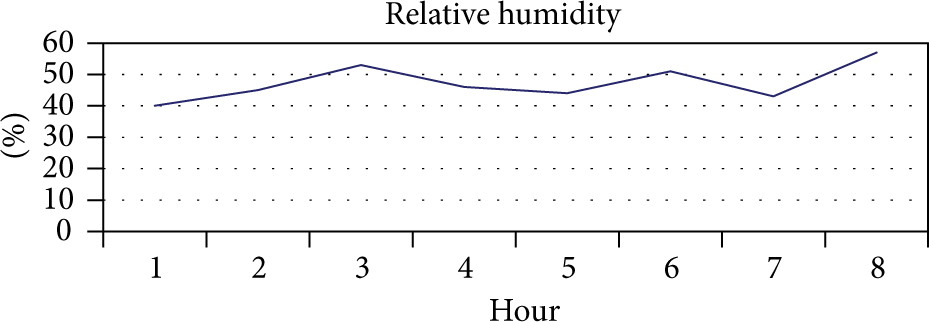
The experiment result of humidity detection.

The experiment result of gas detection.
The experiment result of smoke detection.
5. Conclusions
In this study, we developed a home monitoring system which could monitor every environmental indicator we set effectively. The implementation of the system in this study is discussed as follows. Develop a home environment monitoring center with database and Wi-Fi wireless network system. Architecture for hardware and software integration with models is proposed. In any kind of environmental change, the indoor environment can be adjusted immediately. The temperature can be adjusted by turning on a fan, and the humidity can be adjusted by turning on a dehumidifier based on system evaluation with scenario and flow is discussed to prove that the system and the architecture are both workable.
The experiment results showed that when the temperature and humidity exceed a specific threshold, the fan and dehumidifier will be turned on, and when the gas level exceeds the threshold, a message is sent to users. This system achieves our basic requirement of intelligent home monitoring. It will be easy to popularize in the future. In addition, we provide Table 3 to analyze the improvement of our system with a Wi-Fi wireless network.
Comparison before and after integration of Wi-Fi.

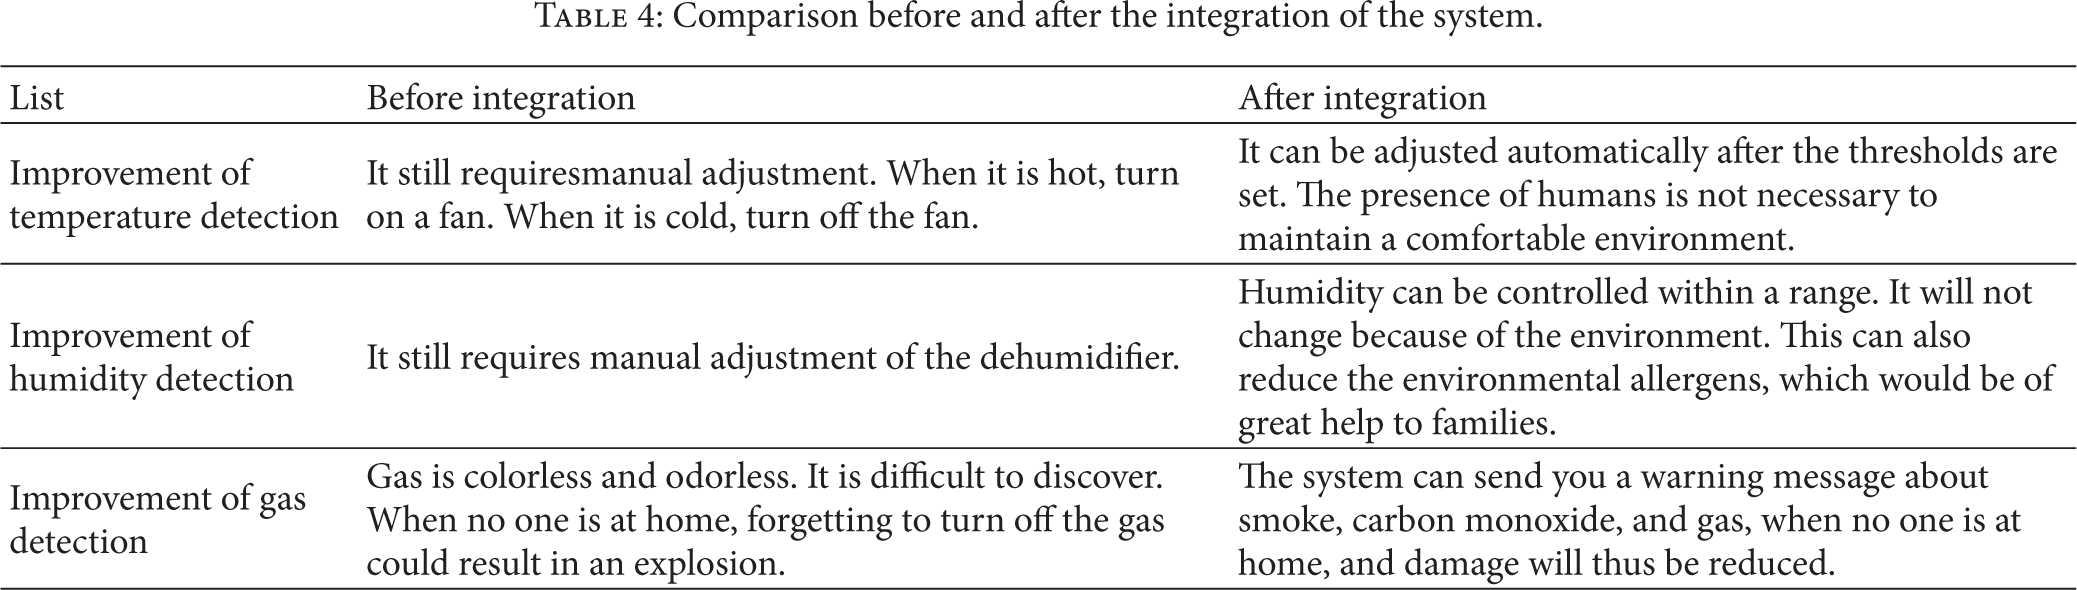
Table 4 illustrates the improvements in all of the environmental factors under consideration in this study. Temperature, humidity, and gas levels can be controlled, and the home environment can be effectively improved. Increased levels of more dangerous substances such as gas (smoke, carbon monoxide, and methane) result in warning messages being sent to users. We can extend this application from family to entire neighborhoods or to office buildings, thus creating intelligent communities, intelligent commercial buildings, or even intelligent medical centers and enhancing the quality of life and care. In addition, developing the intelligent home monitoring system can also enhance the value of buildings. Researchers can design different functions for intelligent home monitoring systems based on this infrastructure in the future. For example, to improve safety, door security and security systems can be designed. There could be many different types of intelligent systems customized ideally to meet customer needs and desires.
Comparison before and after the integration of the system.
Footnotes
Conflict of Interests
The authors declare no conflict of interests.
Authors’ Contribution
All members have contributed in various degrees to the development, integration, and deployment of the system. Shang-Liang Chen proposed the main concept of the development of a multisensor embedded intelligent home environment monitoring system based on digital signal processor and Wi-Fi. Based on Shang-Liang Chen's concept, Shu-Kai Chang further implemented the system and finished the experiments. Yun-Yao Chen finally revised all the architectures based on the original concept of Shang-Liang Chen, including architecture redesign, flow redesign, and system architecture redesign. The paper organization and English grammar were also revised by Yun-Yao Chen.
Acknowledgment
This research was funded by the Ministry of Science and Technology of the Republic of China, Taiwan, under Grant MOST 103-2221-E-006-085.