
Abstract
This paper mainly describes a fault diagnosis scheme for aircraft multibranches wiring networks. The background theory is based on the matching algorithm with theoretical reflection waveform and realistic reflection waveform. Firstly, a numerical model with a comprehensive database was built to create the theoretical waveform of the measured wiring network. On the other hand, the realistic reflection waveform of the measured wiring network can be collected by reflectometry detection system. Then, the waveform matching algorithm and fault diagnosis algorithm were applied to detect the fault type and fault location in the measured wiring network. With all the steps above, the fault diagnosis scheme was designed and realized. Finally, a multibranches wiring network, which includes two branches, and one of its branches contains two subbranches with different types of faults, was built to verify the fault diagnosis scheme and the results show that the scheme is an effective way to diagnose faults in multibranches wiring network.
1. Introduction
Airborne equipment includes power system, hydraulic system, fuel system, air conditioning system, flight control system, electrical system, navigation system, communication system, landing gear system, and various types of display devices. The energy and signal transmission among all the equipment rely on aircraft wiring system [1]. Aircraft wiring system is an important part of aircraft which is composed of connecting wires, connectors, and many other airborne equipment. The safety issues of aging aircraft wires have drawn extensive national attention and several methods for wiring system testing have been developed.
Time domain reflectometry (TDR) is the most common method; it launches a short rectangular shape of voltage wave from the test point (shaped pulses can also be used) to the terminal of the wire. When it comes across the fault position, there will be reflected signals and faults can be detected by analyzing the reflected signal at the test point. However, TDR is hard to detect high resistance defects and intermittent defects of wire [2].
Frequency domain reflectometry (FDR) method is another widely used method. It sends a low-voltage high-frequency sinusoidal signal into the aircraft wire and collects the reflection signals on the other hand. This method is suitable for detecting open and short faults, and also the techniques for detecting frays, cold solder joints, and other small anomalies are emerging [3–5]. However, this method relies on a strong reflection. In reality, the problems such as moisture, damaged insulation influence reflection make it difficult to detect the type of faults by traditional FDR method.
Spread-spectrum time-domain reflectometry (SSTDR) method is based on chaotic sequences. At the present moment, pseudo-random sequence (PN sequence), which is modulated by a sine wave signal, has been widely used as the SSTDR test signal. The point of failure can be detected by the cross correlation between the reflected signal and the test signal. The requirement of low frequency signal and high noise immunity makes this method suitable for diagnosing intermittent faults quite well [6–8]. However, due to inherent deficiencies of PN sequences and more and more wide application of chaotic sequences in spread-spectrum communication, there is a trend to replace the PN sequences with chaotic sequence in SSTDR method.
All the methods mentioned above can diagnose the aircraft wiring system without any branches and joints. But in reality, the distribution of aircraft wiring system is so complicated that it is inevitable to contain branches and joints in it. It is impossible to detect the fault in aircraft wiring system one by one as most of joints were sealed under boards. In this condition, fault diagnosis method must consider branches and joints.
To solve this problem, Brewer has developed a network fault diagnosis algorithm of the multibranches wiring network which provided fault topology of multibranches wiring network through the analysis of convolved reflectometry data collected at multiple data points along a test wire by the field sensors [9]. This method needs an array of hand-held electromagnetic field sensors in conjunction with a SSTDR wire tester and it is unrealistic to detect the multibranches wire network on board. Similar research on multibranches wire network can be found in the literature but all are not practical ways to diagnose aircraft multibranches wiring network [10–12].
In this paper, a practical fault diagnosis scheme for aircraft multibranches wiring network with waveform matching and fault diagnosis algorithm was developed.
2. Multibranches Wiring Network Numerical and Simulation Model
According to the transmission line theory, the signal aircraft wire can be considered as a circuit constituted of a number of equivalent resistance R, conductance G, inductance L, and capacitance C [13]. Each parameter is assumed uniformly distributed along the entire wire. When the incident signal passes through the wire, a voltage drop would happen due to the resistance R and inductance L, and the signal would shunt by inductance L and capacitance C. Assuming the initial voltage is
If the test wire was normal and the terminal load impedance equals to the characteristic impedance of the wire, the signal passing through the wire would be absorbed by the load without reflecting back. If there was a fault, the impedance of the fault point would be different from the characteristic impedance of the wire so the reflected signal would be generated. The reflection coefficient is the physical parameter to describe the reflection as shown in

Normally there are three kinds of faults in aircraft wire which include open-circuit fault, short-circuit fault, and fray fault.
From (2), the following results can be concluded. When When When When
For multibranches networks, the reflected signal has its own characteristic. The impedance mismatch happened not only at the fault point of the wire but also at the transmission branches. Multireflections might happen not only at the fault point but also at transmission branch junctions. As a result, the signals might attenuate and interfere with each other to result in the difficulty of fault diagnosing. When a junction between two wires of equal impedance

So according to (3), if the incident signal amplitude is 5 V, the first reflected signal amplitude in a wiring network with two branches will be 5/3 and the second reflected signal amplitude is 5/9. If the aircraft wiring structure is two levels of subbranches after a branch, the first reflected signal amplitude at the end of the branch is 5/9. The second reflected signal amplitude is 5/27. So the second reflected signal will submerge in noise and cannot be detected. As to the three serial branches, the first reflected signal amplitude at the end is 5/27. So the most complicated wiring network we can detect now is three branches with four joints in each branch. In real aircraft engine, aircraft wire connection is realized by continuous block which was produced by BURNDY Company. The complex degree will not exceed three branches with four joints in each branch.
The numerical model of the reflected signal with two-branches wiring networks can be described as shown in Figure 1.

The numerical model of the two-branch wiring networks.
In Figure 1,
For the resistance of the wire being small and the insulation resistance being high, a high-frequency signal will be used as the incident signal when diagnosing faults of the multibranches wiring networks with reflectometry method. In fact, when the high frequency signal reached a certain level, the effects of the resistance and conductivity can be negligible; therefore, only the capacitance and inductance were considered in the numerical model of the multibranches wiring networks. With the value of ρ ranging from −1 to +1, the numerical model can be simplified to include transport delay units, reflection and transmission units only. The simulation can be easily implemented in the MATLAB/Simulink.
A typical simulation model of the multibranches wiring network was built according to the numerical model. There are transport delay units, the reflection or transmission units, and multiple reflections feedback loops in each section which can be seen in Figure 2. Firstly, the incident signal reaches junction A; then it divided into three signals: the reflected signal back to O, the transmission signals to B, and C. Once the signal travels through the transport delay units and reflection units, it will come back to junction A again and be divided into three directions: the feedback signal to C, the feedback to O, and B. For the end of branch

The simulation model of the two-branch wiring networks.
Figure 3 further explains the multireflections and transmission phenomenon in a wiring network with two branches.

Illustration of the reflected signal in a wiring network with two branches.
In Figure 3(a), the incident signal
In Figure 3(b),
In Figure 3(c),
In Figure 3(d), signal
For the propagation of the incident signal in branches wiring networks, there are a number of equidistant reflected signals after the first reflected signal back from the fault point. But as the increasing of the propagation distance, the following reflected signals which happen right after the first and second reflection will be gradually covered by the noise.
Figure 4 is the reflected signal of a wiring network with two branches. The incident signal is a pulse with duration of 10 ns and voltage of 5 V. The reflected signal of branch 1

The reflected signal in a branches wiring network with two branches.

Illustration of the reflected signal in a branches wiring network with two levels of subbranches after a branch.
Figure 5 is the illustration of the reflected signal transmission in a wiring network with two levels of subbranches after the first branch. In Figure 6, the reflected signals caused by connection points A, B, C, D, and E can also be found out. By analyzing a large number of reflected signals in some typical kinds of multibranches wiring networks, the signal transmission rule has been clearly defined. And if the sampling points and the voltage of the first-level reflected signals can be determined, the fault type and fault position of the multibranches wiring network can be decided.

The reflected signal in a branches wiring network with two levels of subbranches after a branch.
3. The Theoretical Waveform Generation
3.1. Path Search Algorithm
Before the fault diagnosis, aircraft wiring database which includes ID, length, and other items must be designed from which the structure of the measured multibranches wiring network can be deduced. The database was built according to wiring diagram manual (WDM) which is varied from different types of tested aircraft. A sample table was built and it is shown in Table 1.
Aircraft wiring database.

Bundle number is the bundle part number and title of each branch. Wire number is the unique identification of each branch. Once connecting the bundle number and wire number, the wire is unique. GA, CO, and Farm represent the basic parameters of the wire which means size, color, and wire family separately. FT_IN is the length of the wire. F_Equip, F_Term, T_Equip, and T_Term means the equipment connected with the start, the corresponding pin number, the equipment connected with the end, and the corresponding pin number of each wire separately. Once the GA, CO, and Farm are chosen, the propagation velocity of signal in the wire can be calculated. And once the F_Equip, F_Term, T_Equip, and T_Term are determined, the structure of the measured multibranches wiring network can be deduced. For example, the structure of a multibranches wiring network is shown as Figure 7 and we would search the path from the starting point D00001A-1 to the end point D00003A-4. At D00001A-1, the program will search the database and find out all adjacent wires of the points. At first, the program will search all the wire connected with the node. Then, if we input the node D00001A-1, the program will find out the wire number W0001-001. So the node D000002C-2 can be determined. So the next step is to search the wires connected with node D000002C-2. Then, the wires named W0001-001, W0002-004, and W0003-005 can be found out. But the wire W0001-001 has been passed. So we must select a register storage to store the wires that have been passed. So the wire will be excluded. So the rest is W0002-004 and W0003-005. Then the program will search the random one of them first. For example, the program chooses the wire W0003-005. Then the node D000003A-5 can be found out. At the same time, both wires W0002-004 and W0003-005 will be stored in the stack. But which one is on the top is random. So assuming the W0003-005 is on the top. Then, the search path program will search the path from W0003-005 to W0010-011 until the path goes to the end. So when the path comes to the end, the W002-004 which is at the bottom of the stack will come out and search the next path. So all the path will be searched with the program. So the point D00002C-2 can be found out. And at D00002C-2, D00001A-1, D00003A-4, and D00003A-5 can be found out. But the D00001A-1 must be deleted for it has been passed. Then, the point D00003A-4 and D00003A-5 will be stored in a stack of which the sequence is decided by computer. Suppose the D00003A-4 is stored in the stack first. For the D00003A-5 being at the top of the stack, it will be used to search the next connecting point first. Then, D00002C-2 and D00004A-4 can be found out. And D00002C-2 will be deleted. Once at the end of the wire, the D00004A-4 will find out a null. So the D00003A-4 will be popped from the stack. At that time, the point D00003A-4 is what we want and the program comes to the end. So the path is D00001A-1, D00002C-2, D00003A-5, D00004A-4, and D00003A-4. By choosing to keep the useful path, the result D00001A-1, D00002C-2, and D00003A-4 can be got. Then, the wire number can be confirmed by the start and end point. The path is W0001-001 and W0002-004.

A structure of the multibranches wiring network for path search.
3.2. Theoretical Waveform Generation
According to path search algorithm, the connections, branches, signal propagation velocity, and length of the wiring network can be confirmed. Then the simulation model can be built with reflection coefficient, transmission coefficient, and feedback loops. Once injecting a pulse incident into the measured multibranches wiring network, the peaks and troughs of the reflected signal can be acquired through simulation model.
In the laboratory, the digitizer typed NI PXIe-5186 is used to collect the reflected waveform. The maximum sample rate with one channel enabled can step in multiples of 12.5 GS/s. Random Interleaved Sampling (RIS) rate can reach 250 GS/s. In our experiments, the RIS is used to acquire the waveform. As the sampling rate is 250 GS/s, the sampling interval is
Assuming the average signal transmission speed in the wire is

A structure of the multibranches wiring network for theoretical waveform generation.

The theoretical reflected signal of the multibranches wiring network in Figure 8.
From Figure 9 we can see the following: There will be a peak in the end of each branch; there will be a trough in the connection of branches; the position of peaks and troughs is decided by the wire type and length; the secondary reflected signal may be seriously decayed and merged in noise as the length of the measured wire; the peaks can be found out by setting a threshold value while the troughs can be found out by negating the reflected signal and setting a threshold value.
4. The Reflected Waveform Generation
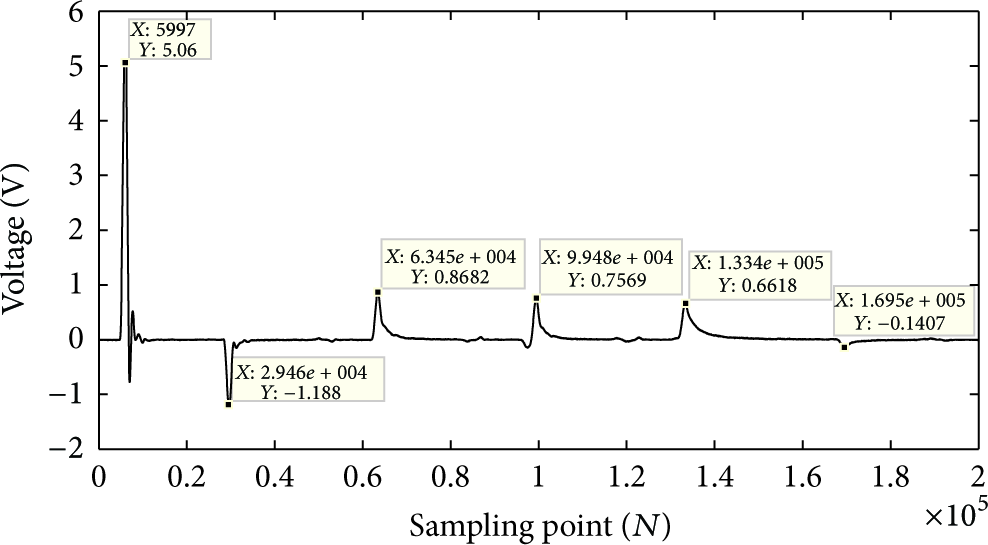
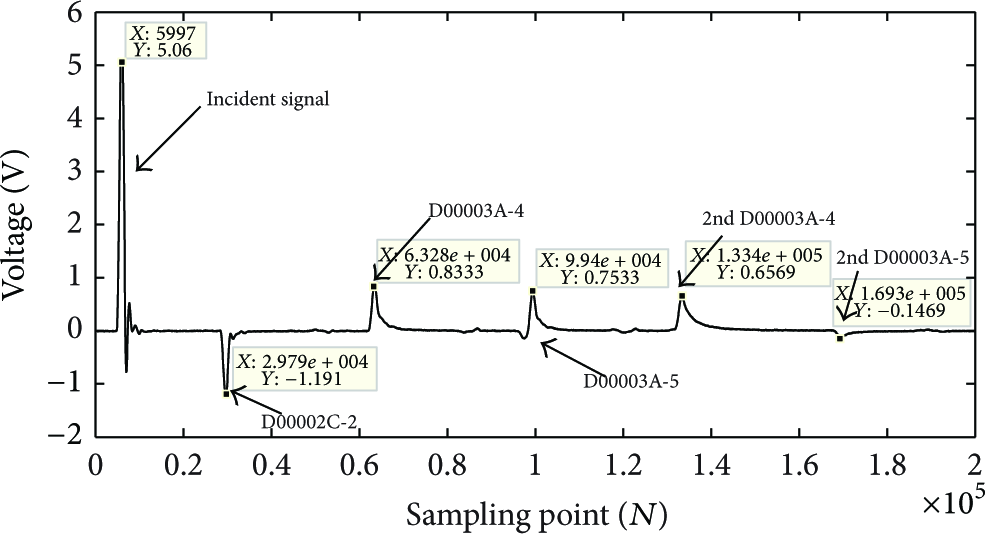
To measure the real reflected signal of multibranches wiring networks, the reflectometry detection system is constructed of PXI bus controller PXIe-8135, signal generator card typed NI PXI-5422, data acquisition card typed NI PXIe-5186, monitor, and T-joints as shown in Figure 10. Signal generator card generates the incident signal and the data acquisition module collects the reflected signal. The reflected signal collected by reflectometry detection system is shown in Figure 11.
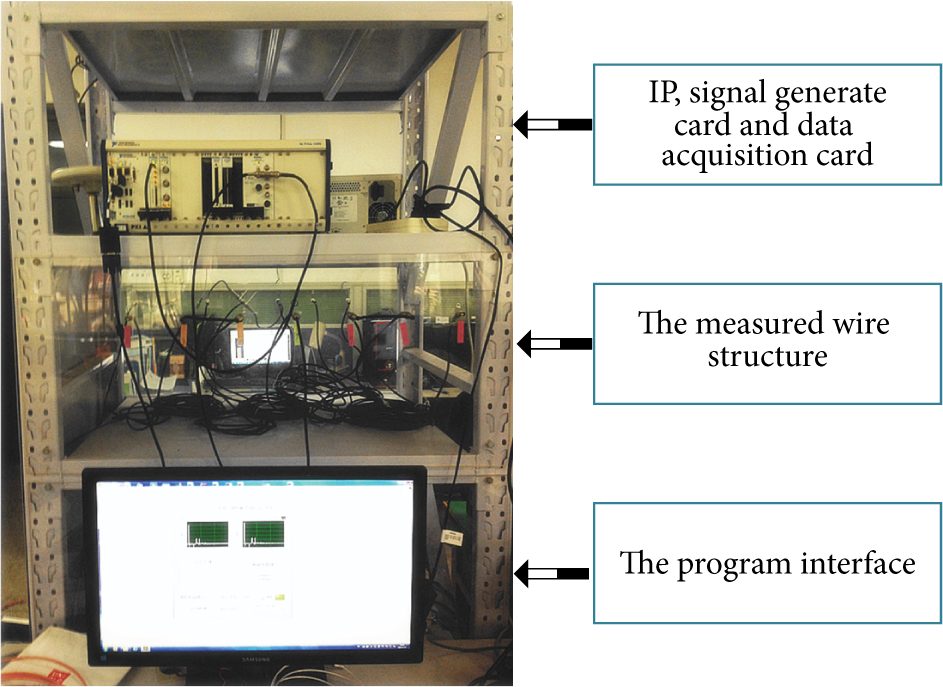
Reflectometry detection system.
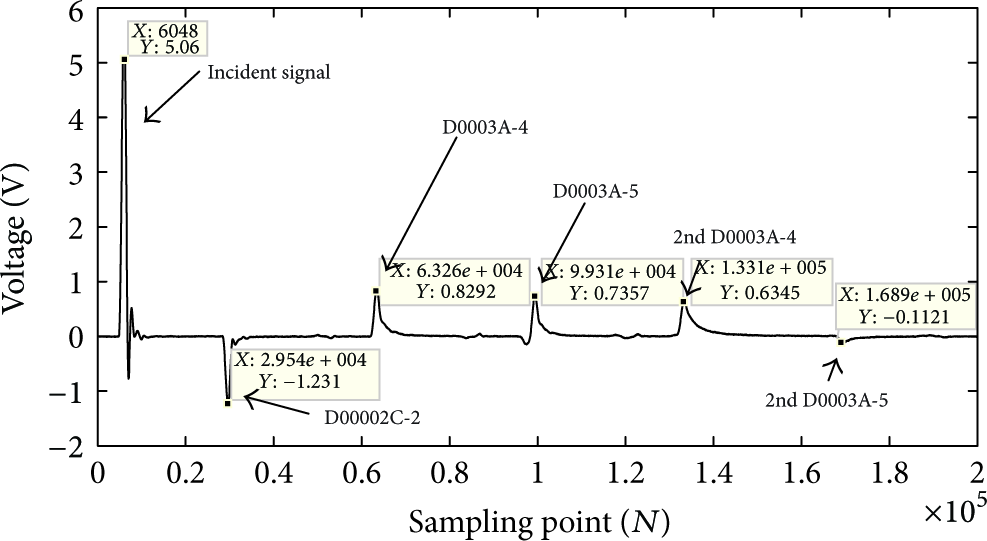
Reflected signal collected by reflectometry detection system.
5. Waveform Matching Algorithm
5.1. Signal Alignment Algorithm
Assuming 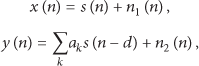

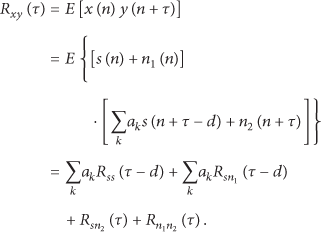
Assume additive uncorrelated noise and signal are uncorrelated, and the noises are uncorrelated either, which means that the additive noise is with ideal circumstances: 
According to the characteristics of the correlation function, (8) can be got:
The cross-correlation of the 
When the delay time is d, cross-correlation of the
5.2. Waveform Matching Algorithm
After the alignment operation, cross-correlation must be calculated again. A difference function between the autocorrelation and cross-correlation function can be used to reflect the theoretical and real reflected signals at each sampling point of the shape. The difference function is shown in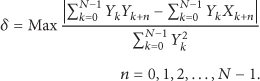
In (10), δ and γ, respectively, are the difference coefficient and similarity coefficient. N is the sampling number. X is theoretical reflected signal and Y is the theoretical real reflected signal [18].
If the difference coefficient is less than a default threshold, the theoretical and real reflected signals are similarly enough that means the measured multibranches wiring network is in good condition and otherwise means there would be faults in it.
5.3. Peaks and Troughs Detection
Peaks and troughs detection is the most important step which can decide the accuracy of fault diagnosis. As for the theoretical reflected signal, the width of the incident signal is fixed. So the peaks and troughs have the same width as the incident signal. So the peaks and troughs detection of the theoretical reflected signal can be decided by detecting a number of sampling points with the same voltage. All peaks and troughs’ coordinates of the theoretical reflected signal were shown in Figure 12.

All peaks and troughs’ coordinates of the theoretical reflected signal.
As for the real reflected signal, wavelet denoising method was used to eliminate the interference of the noise. Assign the voltage of the ith sampling point as 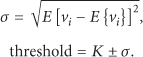
Construct a two-dimensional matrix 
With the procedure above, all the peaks and troughs can be found out. All peaks and troughs’ coordinates of the real reflected signal were shown in Figure 13. By comparing the difference peaks or troughs of the theoretical and real reflected signals, the fault type and position can be determined.
All peaks and troughs’ coordinates of the real reflected signal.
6. Fault Diagnosis Scheme for Aircraft Multibranches Wiring Network
6.1. Fault Diagnosis Scheme
The whole faults diagnosis logic is shown in Figure 14.

The whole faults diagnosis logic.
Once there were faults in wiring networks, F_Equip, F_Term, T_Equip, and T_Term of the test position must be sent to the program first. Then the program can infer the structure of the multibranches wiring network with fault between the starting point and the end point. And there should be reflected signal in the joint position. If the end of the branch is open, there would be a positive reflex and if the end was connected with other branch, there would be a negative reflex. The prereflex position can be determined by numerical model of the wiring network with faults. Then a pulse with 10 ns width and 5 V amplitude was sent to the measured multibranches wiring network and the real reflected signal can be obtained with data acquisition card. There would be a comparison with waveform matching algorithm between the prereflex and the collected reflex. The comparing steps can be summed up in the following steps. Firstly, make the incident signals alignment between the theoretical and real reflected signals acquired by data acquisition card. Secondly, set a threshold and calculate the difference coefficient between the theoretical and real reflected signal. If the difference coefficient is less than a default threshold, the theoretical and real reflected signals are similarly enough that means the measured multibranches wiring network is in good condition and otherwise means there would be faults in it. Thirdly, compare all the peaks and troughs of the theoretical and fault reflected waveforms. If the corresponding sampling point does not lie in the peak width of the theoretical waveform, the corresponding peak or trough was defined as the fault point. If the fault position is a peak, it means open or fray fault. Otherwise it is the short fault. The voltage of the peak can be used to distinguish open or fray fault. Finally, calculate the D-value between the fault point and the peak of the incident signal. The D-value is decided by the signal propagation velocity in the wire. If the measured multibranches wiring network is constructed of different types of wires, the signal propagation velocities in different types of wires will vary from each other. The fault position must be calculated combing with the theoretical reflected signal. Suppose the fault position lies between D00003A-5 and D00004A-4 in Figure 7, the fault position must be calculated as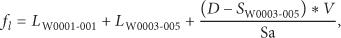
6.2. Experiments
A more complicated multibranches wiring network was used to detect aircraft multibranches wiring network with the structure shown in Figure 15 and the wire parameters were shown in Table 1. The incident signal is the pulse with 10 ns width and 5 V amplitude.

A multibranches wiring network for test.
6.2.1. Standard Reflected Waveform
Figure 16 shows the real reflected waveform when the structure of the measured multibranches wiring network is intact without fault and from which we can see that there is a negative reflected signal at the connection of D00002-2. While the incident signal transfers to D00002-2, it will be divided into two parts equally; one will go along W002-004 and the other go along W003-005. W002-004 is twice shorter than W003-005 and the propagation velocity is the same in all wires, so the incident signal will reach the end of W002-004 and generate a reflected signal at first. Then there will be a secondary reflected signal at D00002-2. In this case, the sampling difference between the secondary reflected signal of D00003A-4 and the firstly reflected signal at D00003A-5 is less than the pulse width and there will be a superposition. Then the end of D00004A-1 and D00004A-4 will generate reflected signal. Especially, there will be a thirdly reflection after the connection D00004A-1. But it does not need to be considered in the fault diagnosis method. Figure 17 shows the theoretical reflected waveform simulated by numerical model. Comparing the collected and the theoretically reflected signal by waveform matching algorithm, the difference coefficient of Figures 16 and 17 is 0.04. So we can determine that the measured multibranches wiring network is in good condition without fault. In the other side, we can verify that the theoretically reflected waveform is accurate enough and can be used to detect the aircraft multibranches wiring network faults.

The real reflected waveform of the measured multibranches wiring network without faults.

The theoretically reflected waveform of the measured multibranches wiring network without faults.
6.2.2. Open Fault at D0003A-5
An open fault at connection D00003A-5 was made and it caused the wire W0005-009 and W0010-011 is not connected with W0003-005. The real reflected waveform of this fault is shown in Figure 18.
The real reflected waveform with short fault at D0003A-5.
By comparing Figures 18 and 17 by waveform matching algorithm, the difference coefficient of Figures 16 and 17 is 0.37. So the measured network is faulty. From Figure 18 we can see that the trough at D00003A-5 and 2nd D00003A-4 changed into a peak. At the same time, the peak at D00004A-4 disappeared. The fault type is open but not fray or short. If it is a fray fault, the peak at D00004A-4 will not disappear. And if it is a short fault, it will be a trough at D00003A-5.
By computing the D-value, the fault sampling number can be confirmed. And fault position can be inferred by comparing the fault sampling number and measured multibranches wiring network with the aircraft wire specifications. So we can decide that there is a fault point at connection D00003A-5.
6.2.3. Short Fault at D00003A-4
A short fault at connection D00003A-4 was made and it caused the shielding layer and core linked of wire W0004-004. The real reflected waveform of this fault is shown in Figure 19.

The real reflected waveform with pen fault at D0003A-5.
By comparing Figures 19 and 17 by waveform matching algorithm, the difference coefficient of Figures 16 and 17 is 0.34. So the measured network is faulty. From Figure 19 we can see that the peak at D00003A-4 changed into a trough. At the same time, the other peaks and troughs are still at the same sampling points. So the branch W0003-005 with W0005-009 and W0010-011 is still in good condition. The fault type is short. By computing the D-value, the fault sampling number can be confirmed. And fault position can be inferred by comparing the fault sampling number and measured multibranches wiring network with the aircraft wire specifications. So we can decide that there is a short fault point at connection D00003A-4.
6.2.4. Short Faults at D00003A-4, D00004A-1, and D00004A-4
Multiple faults in the measured multibranches network were made to verify the detection scheme.
Short faults at connection D00003A-4, D00004A-1, and D00004A-4 were made. The real reflected waveform of this kind of fault is shown in Figure 20.

The real reflected waveform with short faults at D00003A-4, D00004A-1, and D00004A-4.
By comparing Figures 20 and 17 by waveform matching algorithm, the difference coefficient of Figures 16 and 17 is 0.71. So the measured network is faulty. From Figure 20 we can see that the peak at D00003A-4 changed into a trough. At the same time, the peak at D00004A-1 and D00004A-4 changed into troughs also. But the trough at D00003A-5 and 2nd D00003A-4 does not change. So it can be inferred that there are faults at D00003A-4, D00004A-1, and D00004A-4. The faults types are all short. By computing the D-value, the fault sampling number can be confirmed. And fault position can be inferred by comparing the fault sampling number and measured multibranches wiring network with the aircraft wire specifications.
6.3. Detection Result Analysis
The branches wiring network with two levels of subbranches after a branch wiring network was used to detect aircraft multibranches wiring network with the structure which is shown in Table 2. Where the fault position starts from the closest connector. From the detection result we can see that the fault type can be detected perfectly and the fault position error is less than
Detection result analysis.

7. Conclusions
In this paper, a fault diagnosis scheme for aircraft multibranches wiring networks based on matching algorithm between theoretical reflection waveform and reflected signal was developed. And the following conclusion can be got. The simulation model of the multibranches wiring networks which include transmission units and multiple reflections feedback loops can be used to generate the theoretically reflected waveform for fault diagnosis. By comparing with the real reflected waveform, the theoretical reflected waveform is accurate enough. Aircraft wiring database which includes ID, length, and other items must be designed from which the structure of the measured multibranches wiring network can be deduced. The reflectometry detection system which is composed of the PXI bus controller, signal-generator module, data acquisition module, computer, and T-joints was built in the lab. A high frequency signal was sent to the multibranches wiring networks. The reflected signals acquired with experimental equipment can verify the numerical and simulation model of multibranches wiring networks and can supply necessary data for fault type diagnosis and location algorithm. Signal alignment algorithm, path search algorithm, and waveform matching algorithm were combined to compare theoretical and real reflected waveform. If the difference coefficient is less than a default threshold, the theoretical and real reflected signals are similarly enough that means the measured multibranches wiring network is in good condition and otherwise means there would be faults in it. By analyzing the peak or trough type and position variation of real reflected signal corresponding to the theoretical reflected waveform, the fault type and fault position can be determined. Experiments show that the fault diagnosis scheme is an effective way to diagnose faults in aircraft multibranches wiring network. If the test wire is longer than 200 meters, it can be diagnosed by improving the amplitude of the incident signal. Then the reflected signal will not submerge in noise easily. Secondary reflection of the reflected signal can be used for further analysis of faults.
Footnotes
Conflict of Interests
The authors declare that there is no conflict of interests regarding the publication of this paper.
Acknowledgments
This work was supported by the National Natural Science Foundation of China (Grant no. #U1233201); Important & Specific Projects of Civil aviation science and technology project (Grant no. #MHRD20140104); Tianjin Science and Technology Support Key Project (Grant no. #11ZCKFGX04000); Fundamental Research Project of the Central Universities (Grant no. #ZXH2012B002, no. #3122013P005, no. #3122013D002, and no. #3122013D006); China Aviation Industry IUR Cooperative Innovation Engineering Project (Grant no. #CXY2012MHDX3); and the Innovation Fund project of National Commercial Aircraft Manufacturing Engineering Technology Research Center (Grant no. #SAMC13-JS-15-017).