
Abstract
With the analysis of various sensor data from the mobile devices, it is possible to extract user situations, so-called user context. This is needed for the development of modern, user-friendly services. Therefore, we developed a simple, nonintrusive, and automatic method based on the Wi-Fi fingerprints and GPS. The method finds user stay points, aggregates them into meaningful stay regions, and assigns them four general user contexts: home, work, transit, and free time. We evaluated its performance on the real traces of six different users who annotated their contexts over eight days. The method determined the stay mode of the users with accuracy, precision, and recall of above 96%. In combination with the novel approach for aggregation, all regions relevant to the users were determined. Among the tested aggregation schemes, the fingerprint similarity approach worked the best. The context of the determined stay regions was on average accurately inferred in 98% of the time. For the contexts home, work, and free time, the precision and recall exceeded 86%. The results indicate that the method is robust and can be deployed in various fields where context awareness is desired.
1. Introduction
Ubiquitous or pervasive systems, as imagined by Weiser, are becoming reality with advancements in mobile computing, wireless connectivity, and sensing of the environment [1]. Mobile communications have become the most readily available and widespread technology. Widely used smartphones [2] contain an increasing number of communication technologies, such as Wi-Fi, infrared (IR), Bluetooth, radio-frequency identification (RFID), and global positioning system (GPS), as well as sensor modules, such as an accelerometer, compass, microphone, and camera. Measurements collected by these sensor probes can help extract current user location and other circumstances, so-called user context. User context is any information that can be used to characterise the situation of entities, such as a person, place, or object, that are considered relevant to the interaction between the user and the application, including the user and the application themselves [3]. While some services, for example, navigation, require accurate physical location, other services prefer locales that carry a particular semantic meaning, such as a shopping mall or restaurant, and user context, such as home or work. Such locales and user context can be used, for example, in the multimedia applications, in the recommender systems, and in the fleet management. In multimedia applications, the applications can become more user-friendly. In recommender systems, only relevant and personalised information, applications, and services can be suggested to the user [4]. In fleet management, automatic control of fleet can be achieved.
To achieve good performance, semantics of locales and user context used to be annotated manually, but this kind of intervention is not practical for the user. Therefore, automatic and nonintrusive solutions are preferred. However, inference without user intervention is challenging due to the unstable mobile environment and the high density of locales with semantic meaning.
The method for automatic inference of user context needs to trustworthily determine locales, movements between them and revisits. The problem is that the locales with a specific meaning to a user often considerably differ in size. For example, the user context work consists of both, a small locale representing an office and a large locale representing the entire company premises with several floors of offices. The open research question is how to automatically extract small detailed user locales and at the same time determine the bigger units with the same semantic meaning to a user. In the literature there is very little focus on this issue. For example, in PlaceSense [5] the size of locales is arbitrary, because it is limited by the visibility of at least one representative Wi-Fi beacon: inside the building a locale can encompass a few rooms nearby in the same or neighbouring floors, while outdoors it covers a much larger area. The SensLoc method [6] is better than PlaceSense in the recognition of close-by detailed locales but does not anticipate the possibility that several inferred places can constitute a more general locale with the same context to a user, for example, several shops in a mall as shopping or offices and meeting rooms in the company premises as work. In general, the existing place discovery algorithms, such as PlaceSense [5] and SensLoc [6], do not reason about the actual semantics of discovered places. On the other hand, the algorithms that do assign semantic meaning to the recognized places require labelled data and do not infer more detailed user contexts within the general context categories.
In this paper, we propose a method that automatically, without user input, infers various-sized locales with the same semantic meaning and assigns them four different user contexts: home, work, free time, and transit. The outline of the method is as follows: the method (i) uses Wi-Fi fingerprints and physical locations, collected by sensors on the smartphones; (ii) determines user trajectories, that is, stay points (in the related literature, locales with semantic meaning are named stay points when they are inferred from the GPS data and places when they are inferred from the Wi-Fi data; in our paper, we use the term stay points for both) and paths between them; (iii) aggregates the determined stay points into meaningful stay regions (e.g., different rooms are aggregated into an apartment and floors into a building); and (iv) infers user context based on spatiotemporal features of determined stay regions.
Our main innovations are the following. (i) We introduce five optimization parameters to the best existing method, SensLoc [6]. These parameters improve the robustness of stay points determination, as well as inference of user static versus dynamic mode. (ii) We develop a novel approach that aggregates nearby stay points with the same semantic meaning to a user into meaningful stay regions. Thus, we determine more general locales of the same user context while maintaining the details of belonging stay points. (iii) Our method automatically, without labelled data, assigns one of four general user contexts to each determined stay region. For stay points within stay regions, we demonstrate how the more detailed user contexts could be extracted.
We evaluated our method by comparing it to the best-known existing methods. We use two annotated datasets from mobile users: the first was real life traces collected by six users over eight days and the second dataset was a scripted tour of one user within one apartment. With these datasets, we evaluate the determination of user static versus dynamic mode, the determination of stay points and their room-level accuracy, and the correctness of aggregation and of context inference. On our datasets, the proposed method outperforms, to our knowledge, the best method for determination of stay points. Moreover, the method is able to infer the user context comparably well as other similar methods.
The paper is organised as follows. Section 2 presents the related work. Section 3 provides the details of the proposed method. Section 4 deals with the evaluation of our method and Section 5 discusses the results. Section 6 draws the conclusions.
2. Related Work
2.1. Determination of Stay Points and Stay Regions
GPS is the most widely used technology for inference of stay points and user context [7–14], followed by Wi-Fi [5, 15–17] and a combination of several technologies, including cell IDs (CIDs), Bluetooth, accelerometer, sound, and camera [6, 18–20]. The main advantage of GPS is its high positioning accuracy and good coverage in the open outdoor environment, while Wi-Fi is mostly available in indoor and urban environments. Despite the fact that these two technologies are complementary, they are rarely combined for inference of stay points [18].
There are three major approaches for discovering stay points: geometric, fingerprinting, and inertial sensor-based approach.
The geometric approach relies on distances among physical locations. It can be further divided into clustering-based [9, 21], differential-based [12, 13], and probabilistic methods [8, 11]. The geometric stay points are mostly determined with GPS, but positioning based on Wi-Fi can be used also [15]. This Wi-Fi-based positioning requires a database, such as Skyhook [22], PlaceEngine [23], or Google location API [24], in which the fingerprints are linked with the geometric locations.
The fingerprinting approach relies on finding similar patterns. A new pattern is compared to previously learned patterns by, for example, comparing the number of beacons the fingerprints have in common [5] or calculating a similarity parameter, such as Tanimoto [25] or Sørensen's similarity index [26]. However, the learned patterns lack a reference to physical location, but this can be obtained if needed, for example, with GPS [19] or from any of the abovementioned databases.
The inertial sensor-based approach most commonly relies on accelerometer data. In this approach, the stay points are determined as places without movements. Inertial sensors consume less energy than the other two technologies, but they can only be used as a complementary approach because they lack the physical location. However, the location can be determined in the same way as in the fingerprinting approach [26].
In conclusion, the fingerprinting approach proved to be better than the clustering-based and differential-based geometric approaches [6]. Again, both approaches are complementary but were rarely used together [18]. Moreover, a room-level accuracy of determined stay points was promised if the fingerprinting approach was combined with the inertial sensor-based approach [26]. However, it is not clear if the room-level accuracy can be achieved only with the fingerprinting approach without prior field measurements.
Aggregation of stay points into stay regions was studied only with stay points determined with the geometric approach. For this purpose, clustering was used, for example, K-means [9], density-based [14], and grid-based clustering [12, 19]. To the best of our knowledge, the aggregation was not explored with stay points determined with the fingerprinting approach.
2.2. Context Models and Context Inference of Stay Regions
There are mainly two types of context models in the domain of context awareness: (i) context models that refer to places, such as home, a restaurant, or a shop and (ii) context models that describe user activities, such as running or walking. Both can be combined to infer activities at various places, but we limit our scope to (i). Furthermore, user context models vary from very general ones, describing contexts like home, work, abroad, and in transit [16, 27], to very narrow ones, that is, domain-specific, such as for museums [28] or tour guides [29]. The most commonly used models distinguish several rather specific user daily contexts, such as visiting a friend, parking, food and drink, shopping, movie and shows, sport and exercise, tourism and amusement, travel and transport, outdoors, nightlife, and colleges and universities [10, 12, 13, 30]. None of the used context models tried to include all contexts that typically describe the everyday life of a user, nor did they organise them in a hierarchical structure.
The context of stay points can be automatically determined in an unsupervised or in a supervised manner. Contrary to the unsupervised approach, the supervised approach initially requires labelled data, which can be obtained manually by entering a label [16, 31], by using the check-in mechanism [30], or semiautomatically by confirming suggested labels [12, 20]. Automatic context inference typically includes rule-based approach, data mining techniques, and ontologies. These techniques were in practice combined with the following approaches for automatic context inference: location-based lookup [10, 13, 30], point of interest (POI) database and POI-activity matrix [7], popularity of nearby POIs [32], and temporal and image features extraction [30]. While the performance of location-based lookup was rather poor due to inaccuracy of positioning and density of POIs, the last two approaches that used social network data performed better [30]. Therefore, the current trend in the field of context inference favours these automatic and supervised approaches. However, there is a lack of further research into automatic and unsupervised context inference.
3. Methods
To address the identified challenges, we propose a hierarchical context model and a method for processing mobile sensor data in an automatic and unsupervised manner. The outline of our approach is as follows. The method first finds user stay points; then it aggregates them into stay regions and finally infers the context of determined stay regions. The details of each step are described below in the corresponding sections.
We evaluated the performance of the proposed method against user context annotations and compared its performance to the performance of SensLoc [6]. Both the sensor data and the annotations were collected with the smartphone application during two data collection campaigns.
3.1. Context Model
We formed a simple hierarchical taxonomy that is general enough to describe most of the possible user contexts and detailed enough to enable discrimination between various contexts but still not too interruptive for the users. It consists of four general contexts: work, free time, home, and transit. The first two contexts are further divided into more detailed subcontexts, as presented in Figure 1. Some of the subcontexts were divided even further.

Scheme of the proposed hierarchical context model.
3.2. Smartphone Application
We used the Android-based Funf open sensing framework [33] to build the application for collecting mobile sensor data and user context annotations. This framework supports periodic triggering of over 30 different sensor probes, but for our present work only location and visible Wi-Fi access points (APs) were used. The proposed hierarchical context model, presented in the previous paragraph, was integrated in the application. We adjusted the graphical user interface (GUI) of the application, as presented in Figure 2, so that there was one tab for manually choosing user context and another tab for editing all previously chosen contexts.

GUI of our application, showing a tab for entering current user context.
3.3. Data Collection Campaigns
For the data collection campaign, we activated all observed sensors and defined their sampling intervals and durations, where applicable. For location, the sampling interval was one minute, and duration, that is, maximal time the probe will scan before sending the best value, was five seconds; for Wi-Fi, the sampling interval was two minutes. The settings were the same for all users, and they could neither see nor change them. We recruited six middle-aged mobile users of various lifestyles. All were office workers, but five of them performed their work also outside the office premises. Two of them spent most of their time at home and at work, while others had more diverse lifestyles. Each of them had a different smartphone: Samsung Galaxy Ace, Samsung Galaxy Ace 2, Samsung Galaxy S Plus, Samsung Galaxy S II, Samsung Galaxy S III, and HTC One V. They were asked to use their phones as usual and to activate Wi-Fi and GPS modules on their smartphones. Each user participated in the campaign for eight days. The users were instructed to annotate their context whenever they carried their phone with them. Every time their context changed, they chose the appropriate context from the hierarchical context model, as presented in Figure 2. The collected data were uploaded to the dedicated server and processed offline. Through a simple web interface, the participants and researchers could see who was participating actively, track the amount of collected data, and observe trajectories on a map. With the map, all annotations were corrected, if necessary, to reflect the real contexts.
Additionally, a user followed a scripted tour within one apartment. She visited all rooms while collecting data with the smartphone application as described above.
3.4. The Proposed Method
First, we define some terms, such as GPS and Wi-Fi trajectory, GPS and Wi-Fi stay point, and stay region.
3.4.1. Definitions
A GPS trajectory is a sequence of time-stamped points
A Wi-Fi trajectory is a sequence of time-stamped points
A GPS stay point
A Wi-Fi stay point
A stay region is a cluster of several GPS and Wi-Fi stay points that are within 100 m or have a similar Wi-Fi fingerprint. They can be represented with average x and y coordinates or a common set of Wi-Fi beacons.
3.4.2. Finding Stay Points with Fingerprints
To find Wi-Fi stay points, we implemented the method from [6], found the optimal set of parameter values for our dataset, suggested five improvements, and evaluated them. The method from [6] uses sliding windows

In (1),
Similar scan windows are those whose Tanimoto coefficient is above threshold
To find the optimal set of parameter values, we tested the performance of all possible combinations of w,
We also proposed and evaluated five possible improvements.
We changed the units of RSS values. We tested the effect of values in mW instead of in dBm and thus favoured stronger beacons.
We improved the learning scheme of reference fingerprints. While SensLoc uses accumulated beacon statistics during the current stay for a better detection of departures, we tested an incremental learning of new representative beacons that was used not only for detection of departures, but also for updating the reference fingerprint of a stay point. By doing this, the reference fingerprint of each stay point continuously adapted to the changes of the Wi-Fi environment.
We used only unique MACs. Although MAC should be a unique identifier of AP, in reality several devices bear the same identifier. Therefore, we considered only unique MACs that were identified in our campaign.
We limited the number of considered beacons in the reference fingerprints. Due to the unstable radio environment, the set of beacons at the same location differs at various times. To improve the robustness, we calculated the Tanimoto coefficient only with the beacons contained in the current scan window.
We reduced the number of transitions between the same stay points. Due to the unstable radio environment, the transitions between the same stay points can often be falsely inferred. Therefore, we excluded the departures and returns to the same point if they occurred within a couple of minutes.
To evaluate all five improvements, we tested the performance of each improvement and of their combinations and compared it to the best performing set of parameter values without any improvements. The performance was again evaluated in terms of number of stay points and transitions among them, time spent at stay points, and accuracy, precision, and recall of finding stay points.
We also evaluated the effect of all combinations of parameters and of five proposed improvements on the room-level accuracy. For this test, we used a scripted dataset with our application while visiting all rooms of one apartment at specified times. The results of our method were compared with the diary of the LifeMap application [18].
Finally, the stay points were determined with settings and improvements that demonstrated the best overall performance. These stay points were assigned physical locations with GPS or Wi-Fi using the location-sensor data from the Google location API [24]. All stay points for which such location was not available were assigned approximate locations based on similarity of fingerprints. For a stay point A without a location, another similar stay point B with location information and with highest similarity value according to (1) was searched for. If it was found, the stay point A was assigned an approximate location. If not, its location remained unknown.
3.4.3. Finding Stay Points with Geometric Approach
To find stay points from the GPS trajectories, we deployed the differential-based clustering. We used the threshold
3.4.4. Aggregation of Stay Points into Stay Regions
For aggregation of stay points with the same semantic meaning to a user into meaningful stay regions of adoptable size, we tested different combinations of the widely applied physical proximity as well as three other parameters: (i) fingerprint similarity, (ii) term frequency-inverse document frequency (TF-IDF), and (iii) SSID.
The fingerprint similarity in the fingerprinting approach resembles the physical proximity in the geometric approach. If two fingerprints
TF-IDF is used for measuring the importance of a specific POI category to a stay point in the collection of all POI categories and stay points. For this, we used 38 POI categories from the database of the local mobile operator. We sought all POI categories within 100 m of a stay point. A weight w was assigned to each stay point s in the collection of stay points of each user u for each POI category j according to (2):

In the equation,
Stay regions, such as a shopping mall, company premises, or concert hall, are covered by several APs to provide coverage of the entire space. These APs typically belong to the same SSID. Therefore, the stay points with APs of the same SSID tend to belong to the same stay region. For each stay point, we extracted the most common SSID. The stay points A and B were aggregated if the most common SSID of the stay point A was present in more than 60% of Wi-Fi scans of the stay point B.
We designed and evaluated six aggregation schemes. The aggregation scheme 1 used only the physical proximity of stay points with location information. The aggregation scheme 2 used the physical proximity of stay points with location information and stay points with approximate location information. The aggregation scheme 3 used only the fingerprint similarity. The aggregation scheme 4 aggregated stay points based only on SSID. The aggregation scheme 5 aggregated the stay points with location information firstly on the physical proximity. Then, all of the other stay points were added based on the fingerprint similarity. The aggregation scheme 6 firstly aggregated the stay points with location information based on proximity and TF-IDF. Then, all of the other stay points were added based on the fingerprint similarity.
For evaluation, we first mapped the locations of the user-annotated static subcontexts to see how the locations were grouped together. From this, we manually extracted meaningful stay regions for every user, that is, the groups of locations with the same semantic meaning, such as her home building, company premises, a shopping mall, and a fitness club nearby. These regions were named the “user-annotated stay regions.” For each of them, the containing stay points were extracted from the user trajectories. Then, we ran all aggregation schemes, but only on the stay points where the users stayed at least one minute. Finally, we manually ranked the schemes according to how well their stay regions matched the user-annotated stay regions. Then, we used the best two schemes to aggregate three sets of stay points separately: the first set was determined with our method and the other two with SensLoc of two different settings. For each set and aggregation scheme, we compared the number of correctly determined stay regions, merged stay regions, divided stay regions, missed stay regions, falsely determined stay regions, and interesting stay regions, as well as precision and recall of stay region determination, as defined in (3):

Similarly as in [5, 6], we only considered the regions where a user stayed for more than five minutes. For all users, we also evaluated how revisits to familiar stay points were recognized for two most visited stay regions: home and work. At each subsequent visit, we assessed the number of newly recognized stay points determined with our method and with SensLoc of both settings. Finally, we evaluated the accuracy of detected entrance and departure times to and from stay regions. We measured the time offset between the annotated ground truth and detected entrance and departure times by our method and by SensLoc of both settings.
3.4.5. Context Reasoning
We designed a method for automatic and unsupervised assignment of four general user contexts to the identified stay regions, evaluated its performance, and proposed an approach for in-depth reasoning about stay points within each general context. Inference of user context was based on a spatiotemporal clustering. It extracted work as the stay region denoting the office building where a user spent most of her time during typical working hours between 8:00 and 17:00. Home was inferred as the stay region where a user spent most of her time in the evening, during the night, and at weekends, while transit was obtained as a moving mode from inference of stay points. All other stay regions were annotated with the context free time.
For evaluation, we compared the results of our method to the user-annotated data. All user-annotated contexts that represented a moving mode, such as cycling or walking, were treated as the context transit. Each of the four contexts was evaluated with accuracy, precision, and recall for the best two aggregation schemes. To do this, we considered all available time samples, and for each sample we assessed the correctness of automatic context inference. For easier comparison with the related literature, we also used accuracy, precision, and recall to evaluate if the context of each stay point was inferred correctly. Although the context was assigned to the stay regions, we did not evaluate their contexts because the false aggregation into regions and false context assignment would lead to the accumulated error.
For the in-depth reasoning about stay points within each context, we plotted the temporal patterns of the stay points’ visits for each user and examined their characteristics. By doing this, we tried to extract various subcontexts of stay points, such as a living area, a dining area, and a sleeping area, all within the context home. Because we did not have such detailed user annotations, we unfortunately were not able to evaluate the proposed approach.
4. Results
4.1. Finding Stay Points
For the inference of stay points with the original SensLoc method, the optimal set of parameter values for our dataset turned out to be the following:
An example of five different settings for stay point determination chosen from all possible combinations of window size (w), sliding window (
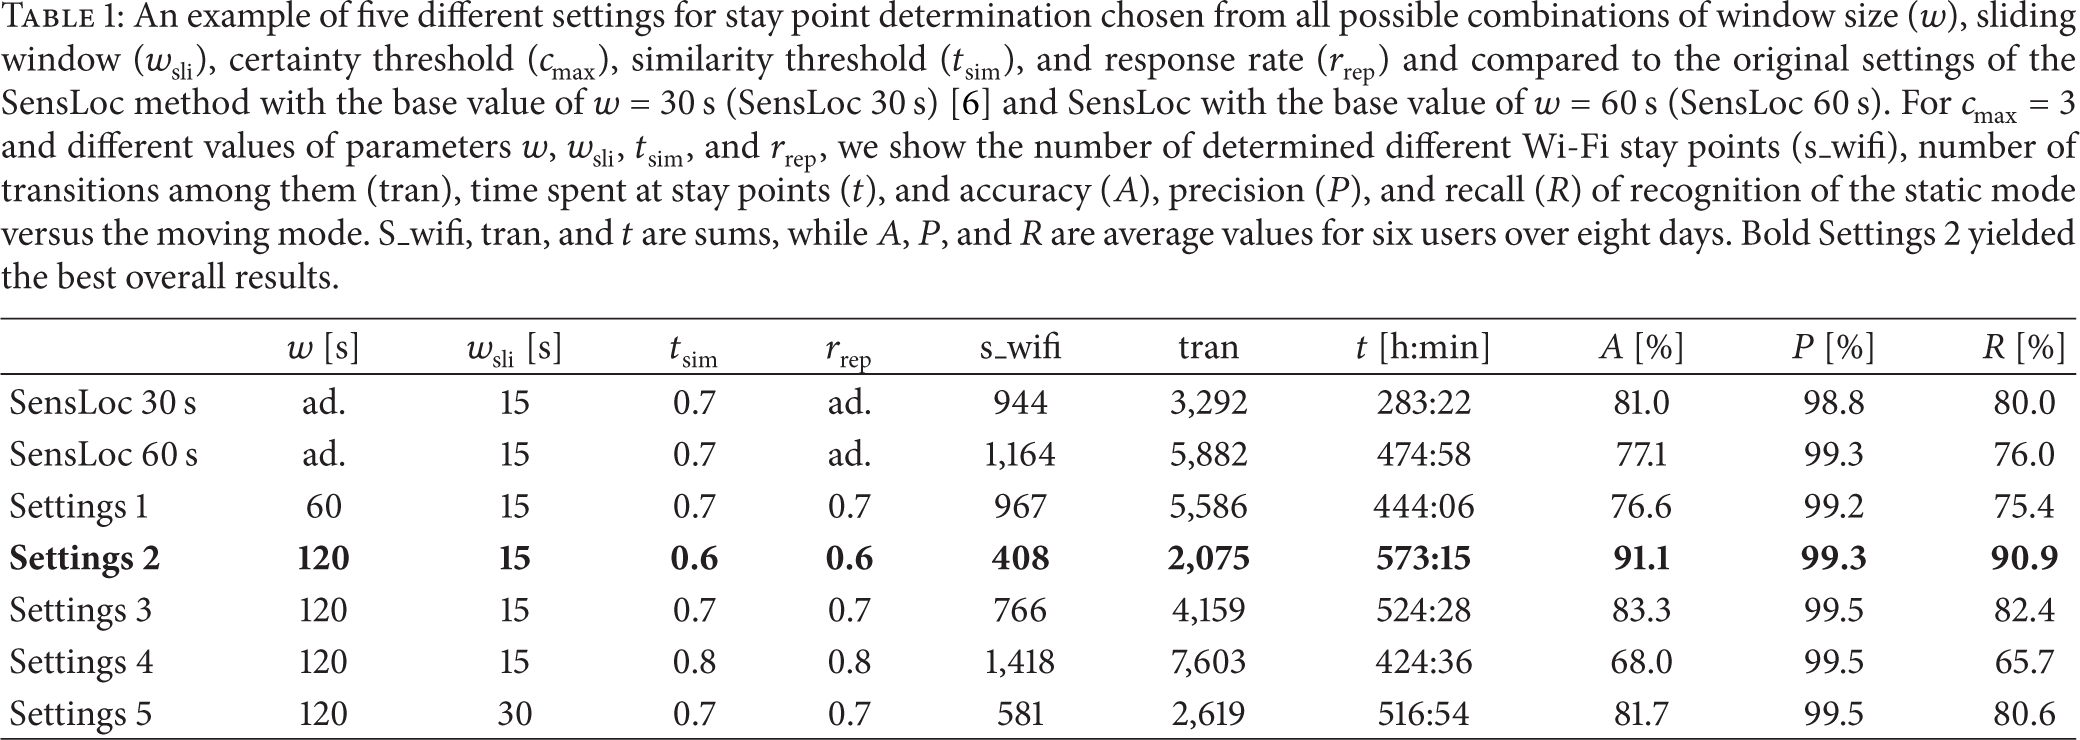
The accuracy, precision, and recall of inferred stay points were very high for all six users except for User 1. For the highlighted combination in Table 1, the standard deviation of accuracy was 4.6%, of precision 0.4%, and of recall 5.3%. For SensLoc 60 s, the standard deviation of accuracy was 6.8%, of precision 0.5%, and of recall 7.5%, while they were higher for SensLoc 30 s.
In the next step, we evaluated the impact of the five proposed improvements and their combinations on the performance. As shown in Table 2, a combination of improvements 1, 2, 4, and 5 resulted in the amount of time spent at stay points that even better resembled the user-annotated time, in the highest recall and in the lowest number of transitions. Improvement of considering only unique MACs (Imp 3) did not affect the performance, so we omitted it from the table. With GPS, only two additional stay points were recognised, adding less than 20 min to the overall stay time and not affecting accuracy, recall, and precision.
The performance of the method with the proposed improvements (Imp) compared to the performance without improvements. Only some of the improvements and their combinations are shown. The improvements were (1) mW instead of dBm; (2) incremental update of representative beacons; (4) selection of used beacons for calculation of Tanimoto; and (5) interpolation of transitions between the same stay points. Bold combination gave the best overall results. The performance was evaluated as the number of determined different Wi-Fi stay points (s_wifi), number of determined different GPS stay points (s_gps), number of transitions (tran), time spent at stay points (t), and accuracy (A), precision (P), and recall (R) of recognition of the static mode versus the moving mode. S_wifi, s_gps, tran, and t were sums, while A, P, and R were average values for six users over eight days.

The proposed improvements levelled up accuracy, precision, and recall so that they were high for all users. They increased the accuracy and recall compared to Settings 2 from Table 1 for more than 5% and determined an additional 9.1% of time spent at stay points. For the highlighted combination in Table 2, the standard deviation of accuracy was 1.2%, of precision 0.5%, and of recall 1.1%.
The highlighted combination of settings and improvements demonstrated also the best performance at the room level. Of all settings and improvements, it reflected the reality the most with respect to inferred rooms, transitions between them, and time spent in them. As with LifeMap, two out of four rooms were identified.
4.2. Aggregation of Stay Points
In this section we present how well the stay regions determined with different aggregation schemes reflected the “user-annotated stay regions,” as defined in Section 3.4.4. Table 3 shows the results of the two most promising aggregation schemes. The accuracy of aggregation is compared for three different methods for finding stay points: our method, SensLoc 30 s, and SensLoc 60 s. The aggregation scheme 3 was based only on the fingerprint similarity, and the aggregation scheme 5 was based on the physical proximity and the fingerprint similarity. A combination of our method with the aggregation scheme 3, highlighted in Table 3, yielded the best overall performance. It was better than the combination of our method and the aggregation scheme 5 in precision, recall, and number of correctly determined stay regions. The aggregation scheme 3 outperformed the aggregation scheme 5 also on the other two observed methods for finding stay points. The highlighted combination, compared to the results of the other two observed methods for finding stay points, had at least 8.1% higher recall and 7 correctly determined stay regions more without missing any user-annotated stay region.
The comparison of correctly aggregated (Cor), missed (Mis), merged (Mer), divided (Div), interesting (Int), and false (Fal) stay regions for both aggregation schemes and three observed methods for finding stay points SensLoc 30 s, SensLoc 60 s, and our method. The precision (P) and recall (R) of stay region determination are shown as well. Only stay regions where a user stayed for more than five minutes were considered. Bold combination gave the best overall results.

Other aggregation schemes that we tested did not perform well. The aggregation schemes based solely on the physical location or on the physical location with TF-IDF suffered from two facts. Firstly, not all stay points had the location information, for example, because it was not provided by the Google API. And secondly, the location information was not accurate due to positioning error. However, the aggregation scheme 4 based on SSID worked better, but it aggregated also the stay points that were far apart.
An evaluation of revisits to two most visited stay regions revealed very different behaviour between the three observed methods for finding stay points. While our method normally determined new stay points during the first visit to a stay region and then accurately recognized revisits, SensLoc 30 s and SensLoc 60 s determined several (up to 17) new stay points during each revisit.
Figure 3 compares the time offset between the detected departure (a) and entrance (b) times and the ground truth. The time offset for departure times for all three methods was negative for at least 78% of the visits. With our method, the time offset was within −120 to 0 for 71% of the visits which is for 26% better than with SensLoc 30 s and for 9% better than with SensLoc 60 s. With our method, the inferred departure times were more than 120 s earlier than the actual departure times in 13% of the visits. This is for 20% less than with SensLoc 30 s and for 15% less than with SensLoc 60 s. The time offset of entrance times for our method was within 0 to 120 seconds for about 62% of the visits, while the percentage of this time offset was for at least 11% lower with both versions of SensLoc.
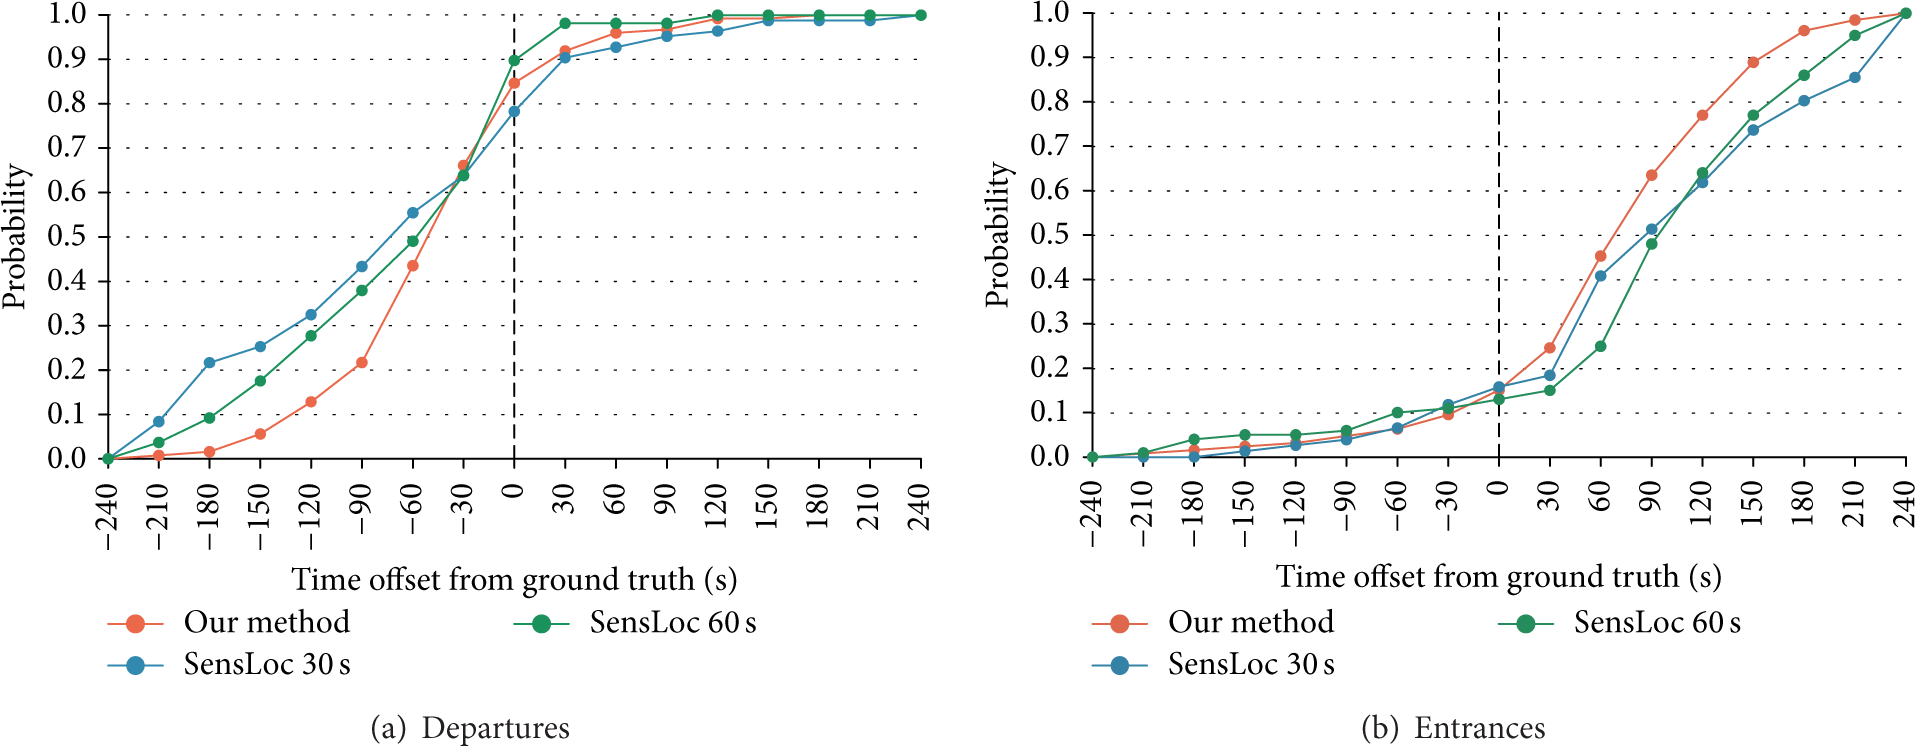
A comparison of the time offsets between the ground truth and departure times (a) or entrance times (b) detected by three methods for finding stay points: SensLoc 30 s, SensLoc 60 s, and our method for six users over eight days.
4.3. Context Inference
For 90.1% of all the minutes when the application was running, our method was able to automatically and in an unsupervised manner determine user context. The results presented in Table 4 show that, with our logic, the user context was inferred with high accuracy, precision, and recall. The contexts home and work were inferred very correctly, while the contexts transit and free time were inferred noticeably less correctly. The average inference accuracy in time over all users was 97.5% with a standard deviation of 1.5%.
The accuracy (A), precision (P), and recall (R) of context inference (transit, home, work, and free time) in time for the aggregation scheme

The accuracy, precision, and recall of the inferred contexts were different from user to user. For the context home, the standard deviations were the smallest; they were higher for work and highest for transit and free time.
Figure 4 presents the correctness of context inference per stay points in comparison with context inference in time, already presented in Table 4. When evaluating context per stay points, the context home was, as before, inferred very accurately with precision of 90.5% and recall of 95.0%, whereas the results for the context work were noticeably worse with precision of 83.3% and recall of 53.6%. The overall accuracy of stay point labelling was 89.7%.

The comparison of two different evaluations of the context inference: (blue line) in time and (orange line) per stay points, for the aggregation scheme 3 for the user contexts home, work, and free time. Accuracy (A), precision (P), and recall (R) represent the average values for six users over eight days.
For three users, we observed that the context home consisted of two to six stay points. Figure 5 shows an example of four different stay points within the context home for User 3. From the time pattern of stay point 1, we can reason that it represents a sleeping area. Similarly, we can reason that stay point 2 represents a room used during the day.
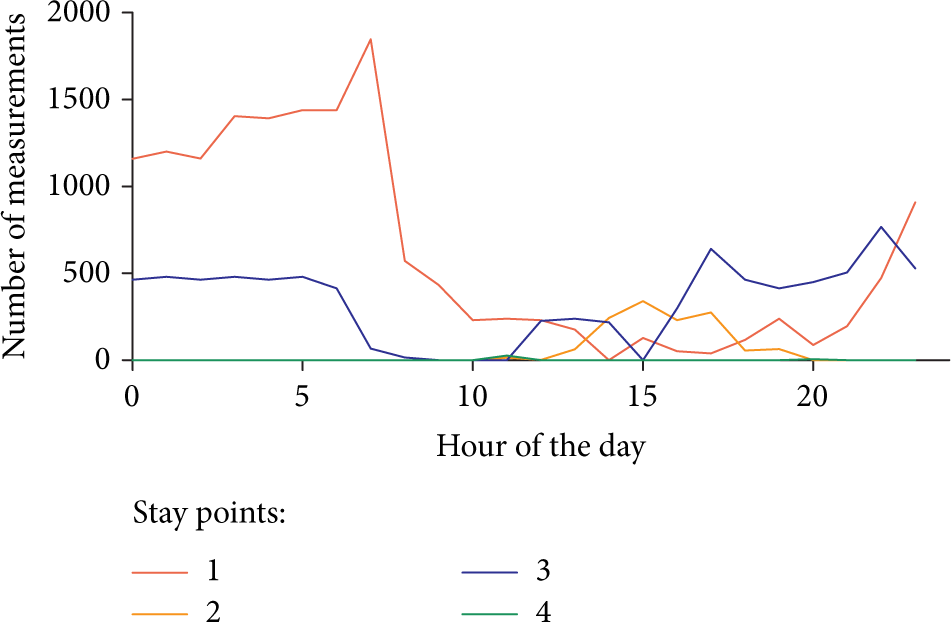
An example of four stay points determined within the context home for User 3. For each stay point, the number of measurements is shown for different periods of the day.
5. Discussion
With the proposed method, we were able to trustworthily find user stay points, aggregate them into stay regions, and infer their contexts. Our method differs from the related work in several ways. Firstly, it is entirely automatic and nonintrusive, because it does not require user input at any stage. Secondly, the method is simple and universal because it uses only Wi-Fi and GPS, but no other smartphone sensors, such as accelerometer [16, 18], sound [16], and camera [30]. This enables its wide deployment, for example, on laptops, simpler mobile phones, and M2M devices. Thirdly, the proposed method relies mostly on Wi-Fi fingerprints, while most of the related work used GPS for stay points inference [7–14]. Wi-Fi is preferable because it spends significantly less energy [6], works instantly, is enabled by the users more often than GPS, and covers most urban and indoor environments. Due to all of the characteristics, the method can potentially be deployed in various fields, such as in adjustment of multimedia applications and services, in recommender systems, kids and elderly care, studies on user mobility and their context-dependent behaviour, and in fleet management.
5.1. Finding Stay Points
We improved the method for inference of stay points from [6] by finding a better set of parameter values for our dataset and by proposing and evaluating five improvements. The chosen set of parameter values worked better on our dataset because it optimised the determination of moving versus static mode, indicated by high values of accuracy, precision, and recall parameters. It also approached the user-annotated time spent at stay points and decreased the number of stay points and transitions between them. One possible reason why the optimal set of parameter values from [6] with the base value of
With our set of parameter values and improvements, we ran into a risk of losing some information about the actual user trajectories due to merging of the adjacent stay points and eliminating transitions between them. However, our short test on the scripted trajectory showed that with our set of parameter values and improvements the results most closely approximated the real number of rooms, the time spent in them, and transitions between them. The results were as good as those of the LifeMap application [18] which, besides the Wi-Fi fingerprints, relied also on the accelerometer data. The LifeMap application promised room-level accuracy but did not achieve it in our case. Some of the most likely reasons for not achieving room-level accuracy with our method were its dependence on the number and placement of APs in the environment, the layout of the rooms, and the construction materials used. The room-level accuracy was not achieved with other methods [6]; therefore we did not compare our method to them. For example, PlaceSense [5] merged the nearby locales indoors, while, outdoors, a single locale covered a large area, such as a long street or a park. Similarly, the geometric approaches, such as in [15], did not distinguish different locales within the same building or close-by, because they considered only two spatial dimensions which were not sufficiently accurate.
The methods for finding stay points are usually evaluated as the number of correct, divided, merged, false, interesting, and missed stay points [5, 6]. Such evaluation was not possible with annotations used in our dataset, because the users did not annotate the detailed locales, such as rooms, but only larger locales that contained several stay points, such as an apartment or a shopping mall. Therefore, we performed such evaluation only on larger locales, that is, stay regions.
When evaluating the method for finding stay points through comparison with the user-annotated data, some caution is needed. Although the user-annotated data is a good indicator of the ground truth, it caused some systematic error in our calculation of the accuracy, precision, and recall, and in the estimation of the time spent at stay points. On the one hand, the user annotations were not entirely correct due to the different understanding of the labels among the users and due to the imprecise timings of the context changes. We minimised this type of error by manually correcting all annotations so that they reflected the real contexts well. On the other hand, our context categories could not have been uniformly assigned to the dynamic or static modes. Some labels of the static user contexts, for example, home, at concert, and dining, were better indicators of the stay points than others, for example, shopping. Similarly, the dynamic user contexts, such as waiting for a bus in the context transit, often included some elements of the static mode. Therefore, the total user-annotated time spent at the stay points was never reached, and the values of accuracy, precision, and recall were never 100%.
5.2. Aggregation of Stay Points into Stay Regions
We proposed and evaluated six approaches for the aggregation of fingerprint and geometric stay points into stay regions. While the aggregation of the geometric stay points has been well explored [8, 9, 11, 14, 15, 21], we are not aware of any solutions for the aggregation of the fingerprint stay points and for joining them with the geometric ones.
Among the proposed aggregation schemes, the results of aggregation scheme 3, which was based on the fingerprint similarity, resembled the user annotations the most. The number of correctly determined stay regions together with the precision and recall was consistently the highest compared to the second best aggregation scheme 5. The logic of the fingerprint similarity used in the aggregation scheme 3 resembles the logic of the physical proximity, but the fingerprints are more sensitive to small changes of the user location and are also available for the majority of stay points. However, the scheme was limited, as it could not aggregate the GPS stay points unless they had the Wi-Fi fingerprints. Moreover, this scheme failed to aggregate the stay points with different fingerprints even though they belonged to the same stay region. Therefore, in the future, the use of the location information and SSID could be considered to account for both of these issues. The aggregation scheme 5, which was based on the physical proximity and on the fingerprint similarity, performed similarly well as the aggregation scheme 3. However, all aggregation schemes that were based on the physical proximity did not yield such good results because some stay points lacked the location information or because this information was inaccurate. The latter was problematic due to the urban environment, where the density of stay points and stay regions was high. The aggregation scheme 4, which was based on SSID, successfully aggregated the stay points within a large shopping mall, which offered its own WLAN. However, it also aggregated the stay points of gas stations of the same provider, even though they were located in different cities. A similar issue could occur also with the stay points that included the municipality WLAN in their fingerprints. With the further development of our context inference method, we foresee two possible enhancements of the current work: crowdsensing [30] and the use of additional sensors [6, 19, 20, 30, 35]. Thus, we could obtain more characteristics of each stay point, such as the temporal patterns of visits, the user activity, light, and sound, and use them for the aggregation.
After selecting the best aggregation scheme, we used the matching between the automatically determined and the user-annotated stay regions as an additional performance indicator of our method for finding stay points. In comparison to both versions of the original SensLoc method, our method for finding stay points had the highest number of correctly determined stay regions and highest recall and did not miss any regions. Its precision was third highest due to the high number of merged and divided stay regions. The number of merged and divided stay regions was in all cases a result of the incorrect aggregation and not of the incorrect stay point determination. However, the opposite was true for the number of missed stay regions.
The merged stay regions occurred when the stay points of the neighbouring stay regions were similar; that is, the Tanimoto coefficient was higher than 0.1. For example, an open concert area, a coffeehouse terrace, and a bar terrace were merged into one stay region. A possible solution to keep such stay regions separate would be increasing the threshold value of Tanimoto coefficient.
The divided stay regions were determined when the stay points from the same stay region were not similar, for example, an indoor and outdoor area of the same restaurant or different shops within a big shopping mall. We foresaw that the aggregation based on SSID could be a solution for such cases. However, our current approach (the aggregation scheme 4) did not lower the number of divided stay regions on our dataset, because we were not able to find the right SSID for such aggregation.
All missed stay regions occurred, because the methods for finding stay points were unable to determine all of the relevant stay points. Our method did not miss any stay regions, which means that it was more successful compared to both versions of the original SensLoc method not only in the parameters discussed in Section 5.1, but also in finding stay points that were relevant to the user. For example, the original method failed to determine the locales, such as bakery, stores, shopping malls, and restaurants, where the users spent less time compared to the most visited locales.
The evaluation of revisits showed that, with our method, the number of newly determined stay points within the most visited stay regions approached zero after a few revisits. However, with SensLoc many new stay points within such stay regions were determined at each subsequent revisit. Which method was better in reflecting every detail in the user trajectories cannot be evaluated with our dataset due to too general annotations for such purpose. However, such behaviour of our method could indicate a lower ability to distinguish the stay points close-by or the resistance to the changing radio environment.
The comparison of the time offsets showed that with our method the results more closely approached the ground truth than with both SensLoc settings on our dataset. Our method detected earlier entrances and later departures which further confirms that the chosen values of parameters and the improvements added to the original SensLoc method were reasonable.
5.3. Context Inference
We demonstrated that, with our automatic and unsupervised spatiotemporal reasoning about the user context, high precision, recall, and accuracy can be achieved. The context inference was possible more than 90% of the time, which could be attributed to the use of the widely available Wi-Fi fingerprints and the sliding windows for the inference of stay points. However, the context inference was not possible all of the time because the Wi-Fi fingerprints and GPS were not always available and because the sampling of the sensor data behaved inconsistently.
We introduced a hierarchical context model consisting of all contexts, static and dynamic, that typically describe the everyday life of a user. At the moment, the hierarchical structure enables the correct determination of four general contexts that can be partitioned later into more detailed subcontexts with the use of more logic and more sensor data. The four general contexts of our model resemble [16, 27] the most. We have used several subcontexts suggested by others [10, 12, 13, 30], but we combined them into a broader category named free time. Moreover, our context inference logic resembles [27], which inferred user context based on CID transitions in an unsupervised manner. A somewhat similar, but essentially supervised, approach was used in [30], where logic for personal naming of places was based on time of the day, day of the week, stay duration, three features from image recognition, and familiarity. In [10, 13], the entirely supervised approach of user context inference used nearby POIs, time of the day, day of the week, and stay durations. We used the last three features in our method for automatic and unsupervised inference of personal names of stay regions.
We evaluated the proposed method for context inference from two perspectives. Firstly, we focused on the percentage of time when the inference worked correctly, and, secondly, we assessed the correctness of context inference for each stay region. We believe that the first option is currently more relevant for the inferred four general contexts because we did not focus on the recognition of subcontexts. Moreover, we could not directly compare the performance of our method for context inference with related work because different context models, sensors, and context reasoning have been used. Therefore, we compared our results with the related work that inferred similar contexts. Our unsupervised method worked accurately on average 97.5% of the time, which was 17% more than reported for the GPS-based supervised method for inferring contexts home, work, shopping, dining, visiting, and other [13]. The accuracy, precision, and recall of our method were in general high because all of our users were very typical and easily predictable. For example, they had only one home, and they spent most of the working time in the main office. This reflects the reality of most users well. Nevertheless, some additional logic should be added to account for the atypical users. However, for the contexts free time and transit, the precision and recall were lower due to the discrepancy between the user labels and the automatically inferred contexts. Namely, our method misclassified the contexts that were mostly static but contained some elements of dynamism, such as shopping. Similarly, it misclassified the contexts that were in essence dynamic but contained some stops, such as resting while cycling or waiting for a bus during transit.
When assessing the correctness of the inferred contexts of stay regions, our method on average performed slightly less accurately than the supervised method based on GPS [10] but performed better than the essentially supervised approach in [30], which in addition to our sensors used a camera. In [10], the overall average accuracy for five contexts was 90.6%, for our three static contexts it was 89.7%, and for ten different contexts in [30] it was 56%. In [10], the contexts home and work were inferred with 100% accuracy, precision, and recall, while in our case the values for home were over 90%, but lower for work. Compared to [30], our recall for home and the precision for work were better, while the precision for home and the recall for work were worse. The good performance of our method could be a consequence of the simple context model and the simple logic for inferring two major contexts home and work, where the users spend most of their time. All our users had only one home, so the logic for this context worked very well. However, half of our users did not work only in the main office as predicted by our logic, which explains the low recall for this context in comparison to [30]. Therefore, some improvements would be needed to account for other offices and field work. The context free time, which we defined as everything that was not home, work, or transit, accumulated the errors of all other contexts. With improved inference of the contexts work and transit, the inference of the context free time will improve as well. This could be achieved with, for example, better logic, additional sensors, or the overlay layer for control of transitions among various contexts, such as the Markov chain or the dynamic Bayesian network.
Nevertheless, some systematic errors will always remain because the entirely unambiguous context model, where each user situation would be attributed to only one context, is not realistic. For example, when a user walks up the stairs to her flat, should this be labelled as home or transit? This depends on the user perception. Thus, there will always be some error when the user annotations are used for evaluation.
We have shown that after the general context of a stay region had been determined, we could infer the subcontexts of its stay points. By doing this, we could approach the room-level context recognition, which is desired for some services. In the case of home, the bedroom could potentially be distinguished from places where a user spends most of her time during the day. Similarly, for the context work, the main office could be distinguished from other rooms. However, with the existing annotations we were not able to evaluate if such reasoning worked, so this remains an open question.
5.4. Other Findings and Comments
Despite the various characteristics of smartphones and the differences in the user lifestyles, our method proved to work robustly. We noticed that the Wi-Fi and location sensors on different smartphones behaved differently and most of the time the data were not sampled with the preset sampling frequency. This might be attributed to the Android peculiarities or the overload of CPU. On the other hand, the user lifestyles differed in the amount of time spent at home, number of work places, and diversity of free time activities. Despite all of these differences, the standard deviations of accuracy, precision, and recall were low, especially when finding the stay points. Nevertheless, the differences in the accuracy and precision among the users decreased after the proposed improvements, which resulted in the lower respective standard deviations. Thus, we believe that our method for finding stay points together with the proposed improvements is robust. Its robustness should be further investigated with more users. When evaluating the context inference, the standard deviations of accuracy, precision, and recall increased due to the very different user lifestyles and limited reasoning of our method. The context inference worked better for the users who spent most of their time at home and in the main office and worse for the users with more dynamic lifestyles. Although all of our conclusions were based solely on six users, we believe that the rather simple logic of our method would work for the majority of users.
Last, but not least, the application in its current form represented a huge burden on the battery life. As already demonstrated in [6, 16], the energy consumption can be optimised without losing much accuracy by dynamically adapting the sampling frequencies and using less power-consuming sensors when possible.
6. Conclusions
In the paper, we presented and evaluated a method that extracts the trajectories from the mobile sensor data and analyses them. The method is able to successfully determine user stay points, aggregate them into stay regions, and assign them four different user contexts: home, work, transit, and free time. In the part of analysing the user trajectories, our method outperformed the current best performing method SensLoc on our dataset in determining static versus dynamic mode, extracting locales that were relevant to the users, estimating the time spent at such locales, and detecting the accurate entrance and departure times. In the part of context inference, our method works similarly well as all the related work. The advantages of our method are as follows. It is entirely automatic and nonintrusive because it does not require user input at any stage. It is simple and universal because it uses only Wi-Fi and GPS but no other smartphone sensors, which enables its wide deployment. Contrary to most of the related work, the method relies primarily on the Wi-Fi fingerprints, which is preferable because of smaller energy consumption, instant functioning, and good coverage in urban and indoor environments.
We improved the SensLoc method [6] for inference of stay points by finding a better set of parameter values for our dataset and by proposing and evaluating five improvements. Four of them further improved the performance of the original method without losing the vital information about the user trajectories. We introduced a novel approach which aggregated the nearby stay points with the same semantic meaning to a user into meaningful stay regions. By doing this, we were able to determine more general locales of the same user context but at the same time maintained the details of the belonging stay points. For such aggregation, we evaluated six approaches and found out that the aggregation scheme based on the fingerprint similarity resembled the real stay regions the most. Finally, we introduced a hierarchical context model and used a spatiotemporal logic to infer four most general user contexts. These were on average accurately inferred 97.5% of the time. Furthermore, we demonstrated how the more detailed user contexts could be extracted from stay points and stay regions that were determined in the previous steps of our method.
The results indicate that the method is robust and can be used with various users and on various smartphones. Due to its characteristics, the entire method or its modules can potentially be deployed in various fields, such as in adjustment of the multimedia applications and services, in the recommender systems, and in the fleet management. According to the needs in the specific field of deployment, the method can be further adjusted and expanded.
Footnotes
Conflict of Interests
The authors declare that there is no conflict of interests regarding the publication of this paper.
Acknowledgments
Special thanks are due to the European Union for the partial financing of a young researcher training programme from the European Regional Development Fund, European Social Fund, and Cohesion Fund and to the authors’ coworkers for their support.