
Abstract
In smart home, location estimation based on PIR sensors is very popular. Existing methods by various sensors technologies and intelligent algorithms are used to achieve a high accuracy. In fact, how to deploy the PIR sensor is directly related to the accuracy. In this paper, we present an approach to deploying the PIR sensor based on the accessible priority by genetic algorithm. This paper presents a genetic algorithm that searches for an optimal or near optimal solution to the PIR sensor deployment for smart home. The fitness function of GA is based on the accessible priority of indoor areas. The accessible priority value of different area is set according to the indoor environment and daily accessible habits. The performance of the genetic algorithm was evaluated using several metrics, and the simulation results demonstrated that the proposed algorithm can optimize the network coverage in terms of accessible frequency.
1. Introduction
According to the United Nations online database [1], currently the percentage of elderly population is 7.6% that is projected to rise by 16.2% in 2050. Issues such as increased healthcare expenditure, burden to caregivers, and insufficient and inefficient care are more likely to occur as the health of older persons normally deteriorates with increasing age, resulting in more demand for long-term care. Therefore, it becomes urgent to find a compromise between the need for constant care (at home or in institutions) and the need to lighten the load on caregivers. Also, it is highly important to ensure that the ministered care is personalized and efficient. In this regard, the smart home concept is an adequate solution. It can be especially useful for the elderly or the disabled who wish to live independently.
In smart home, the occupant's location is probably one of the most important data items needed to monitor the occupant's activities [2]. Some home devices, such as lighting, heating, or home electronic devices, should be also adjusted automatically according to occupant's indoor position. So, it is necessary to localize people in smart home by sensor technologies and some intelligent methods. When the sensors are used for indoor localization, some techniques and constraints need to be considered, such as the occupant's privacy [3], hardware installment cost [4], and technologies' unobtrusiveness [5]. For PIRs are costly, have no privacy problem, and also have very low power consumption, they are very useful to track targets in indoor environment. In Gopinathan et al.'s paper, four PIR detectors are used to develop a system able to detect the path of a single person moving in an area [6], while in Shankar et al.'s paper a low cost sensor cluster is used to extract velocity as well as the path of a single person [7]. Also an array of PIR is used to detect the number of people moving through a gate [8]. In order to improve the tracking accuracy, some efforts are placed on position calculation by data fusion algorithms. Kim et al. developed a Bayesian classifier to enhance the accuracy of PIR-based indoor location-aware system [9]. Seifzadeh et al. proposed a Soft-Data-Constrained Multimodel Particle Filtering method, where the inherently vague (subjective) soft data provided by human agents are modeled using a fuzzy inference system [10]. These mentioned Bayesian methods offer a formal way to update existing knowledge from new evidence. Slightly finer localization can be obtained by exploiting the deployment of neighboring sensors. However, there are a limited number of studies that focus on coverage efficiency of PIR sensors. In this paper, we propose an implementation of GA-based approach for the PIR sensors deployment based on the priority of zones by accessible frequency in a smart home. We split the indoor environment in 2D view into small grids, and we assign a value to every grid that indicates the priority (accessible frequency) of the zone specified by that grid. For example, in a smart home there are many areas with different accessible frequencies. We can distinguish these areas based on obstacles (walls), furniture, the unoccupied free place, accessible daily habits, and so forth. The performance of a given PIR sensor layout by genetic algorithm was evaluated according to the area accessibility as the standard. Some simulation experiments have been implemented to evaluate the performance of our method for PIR deployments.
The rest of the paper is organized as follows: Section 2 will review related sensor deployment works. Section 3 will provide the description of the genetic algorithm with steps. Section 4 will discuss the experimental results and some simulation regarding the algorithm. Finally, Section 5 concludes this paper.
2. Related Works
This paper focused on the optimal PIR sensor placement with the accessible priority using GA-based approach for indoor localization. Therefore, the review of the related work consists of two parts: PIR sensor placement for indoor localization and GA for sensor placement.
2.1. PIR Sensor Placement for Indoor Localization
Generally, the PIR sensor placement is classified into two categories: (1) the deployment of PIR sensors: selecting the optimal coordinate for the PIR sensors and (2) the modulation of FOVs: modulating the optimal FOVs. In [11], the authors have mentioned that the deployment strategy of directional sensor nodes is critical to improve target detection and tracking accuracy. They presented the PIR sensor deployment in WSNs based on computational geometry. Byunghun and his workmates also show how the PIR sensors are deployed, which is very important for localizing an object using region-based tracking algorithm [12]. They discussed the PIR deployment that would divide the monitored room into different regions and how to deploy them determined the localization error. The work reported in [13] addresses the problem of target detection and classification using seismic and PIR sensors and makes use of wavelet-based feature extraction method to resolve this problem. The advantages and disadvantages of seismic and PIR sensors are also discussed. For example, the deployment of sensors largely depends on the intent of use and environment. PIR sensor deployment could be very expensive, because the detection range of PIR sensors has a short range of detection. Therefore, it is recommended that seismic and PIR sensor should be used together. In [14], PIR sensor nodes are deployed linearly and the sensing area is divided into cells through the four sensing regions of each PIR sensor node. In another study [15], five PIR sensors are attached to a service robot to make a circular sensing region. According to the experimental results stated in these studies, the usage of PIR sensors can improve the accuracy of target detection and tracking. Unlike real sensor nodes, most of the researches assume that sensor nodes have a 360° Angle of View (AoV). For example, a node deployment strategy that assumes PIR sensor nodes have 360° AoV is proposed in [7]. The performance of the proposed deployment algorithm is evaluated by comparing the coverage at the initial and final locations of sensor nodes.
2.2. GA for Sensor Placement
Sensor placement for indoor localization is an optimization problem that is nondeterministic and polynomial-time hard [16]. Genetic algorithms (GAs) are a type of evolutionary, optimization algorithm, which can be used to solve optimization problems with NP-hard complexity. Some previously developed algorithms have used GAs to obtain optimum deployment of sensor networks. The study in [17] presents a multiobjective genetic algorithm (MOGA) for optimal deployment of N static sensors in a 2D flat RoI, with two competing deployment objectives: maximizing the area coverage and maximizing lifetime. Each deployment layout was ranked according to its area coverage and lifetime. Different optimum layouts are obtained with respect to different sensing-to-communication range ratios. Reference [18] proposes a dynamic sensor nodes selection strategy, which uses the GA to implement global searching space of GA and ensure the validity of each chromosome. The two objectives of their fitness function are to maximize the coverage and minimize the area covered by more than one sensor. Liang et al. [19] have performed the optimization work for wireless sensor networks in 3D environments. In this work, a force driven genetic algorithm was introduced to decide the location of the sensors in order to obtain an optimized accessible space and also consider sensor coverage. Feng et al. propose an implementation of GA-based design approach for the deployment of the sensors and angles for the modulation of FOVs [20].
3. An Approach for Deploying PIR Sensor Using Genetic Algorithm
This section describes the approach that we propose to deal with the deployment issue of PIR-based positioning system. Two subsections are included in this part. Section 3.1 describes how the proposed approach is used to build the accessible map based on the human visiting habits. And Section 3.2 illustrates how our approach is used to optimally deploy the PIR sensors with the accessible priority of each area in indoor environment.
3.1. Building Accessible Map by Human Daily Habits
Given a mock apartment for deploying, our approach for building an accessible map is executed by human daily habits by performing the following steps, as illustrated in Figure 1.
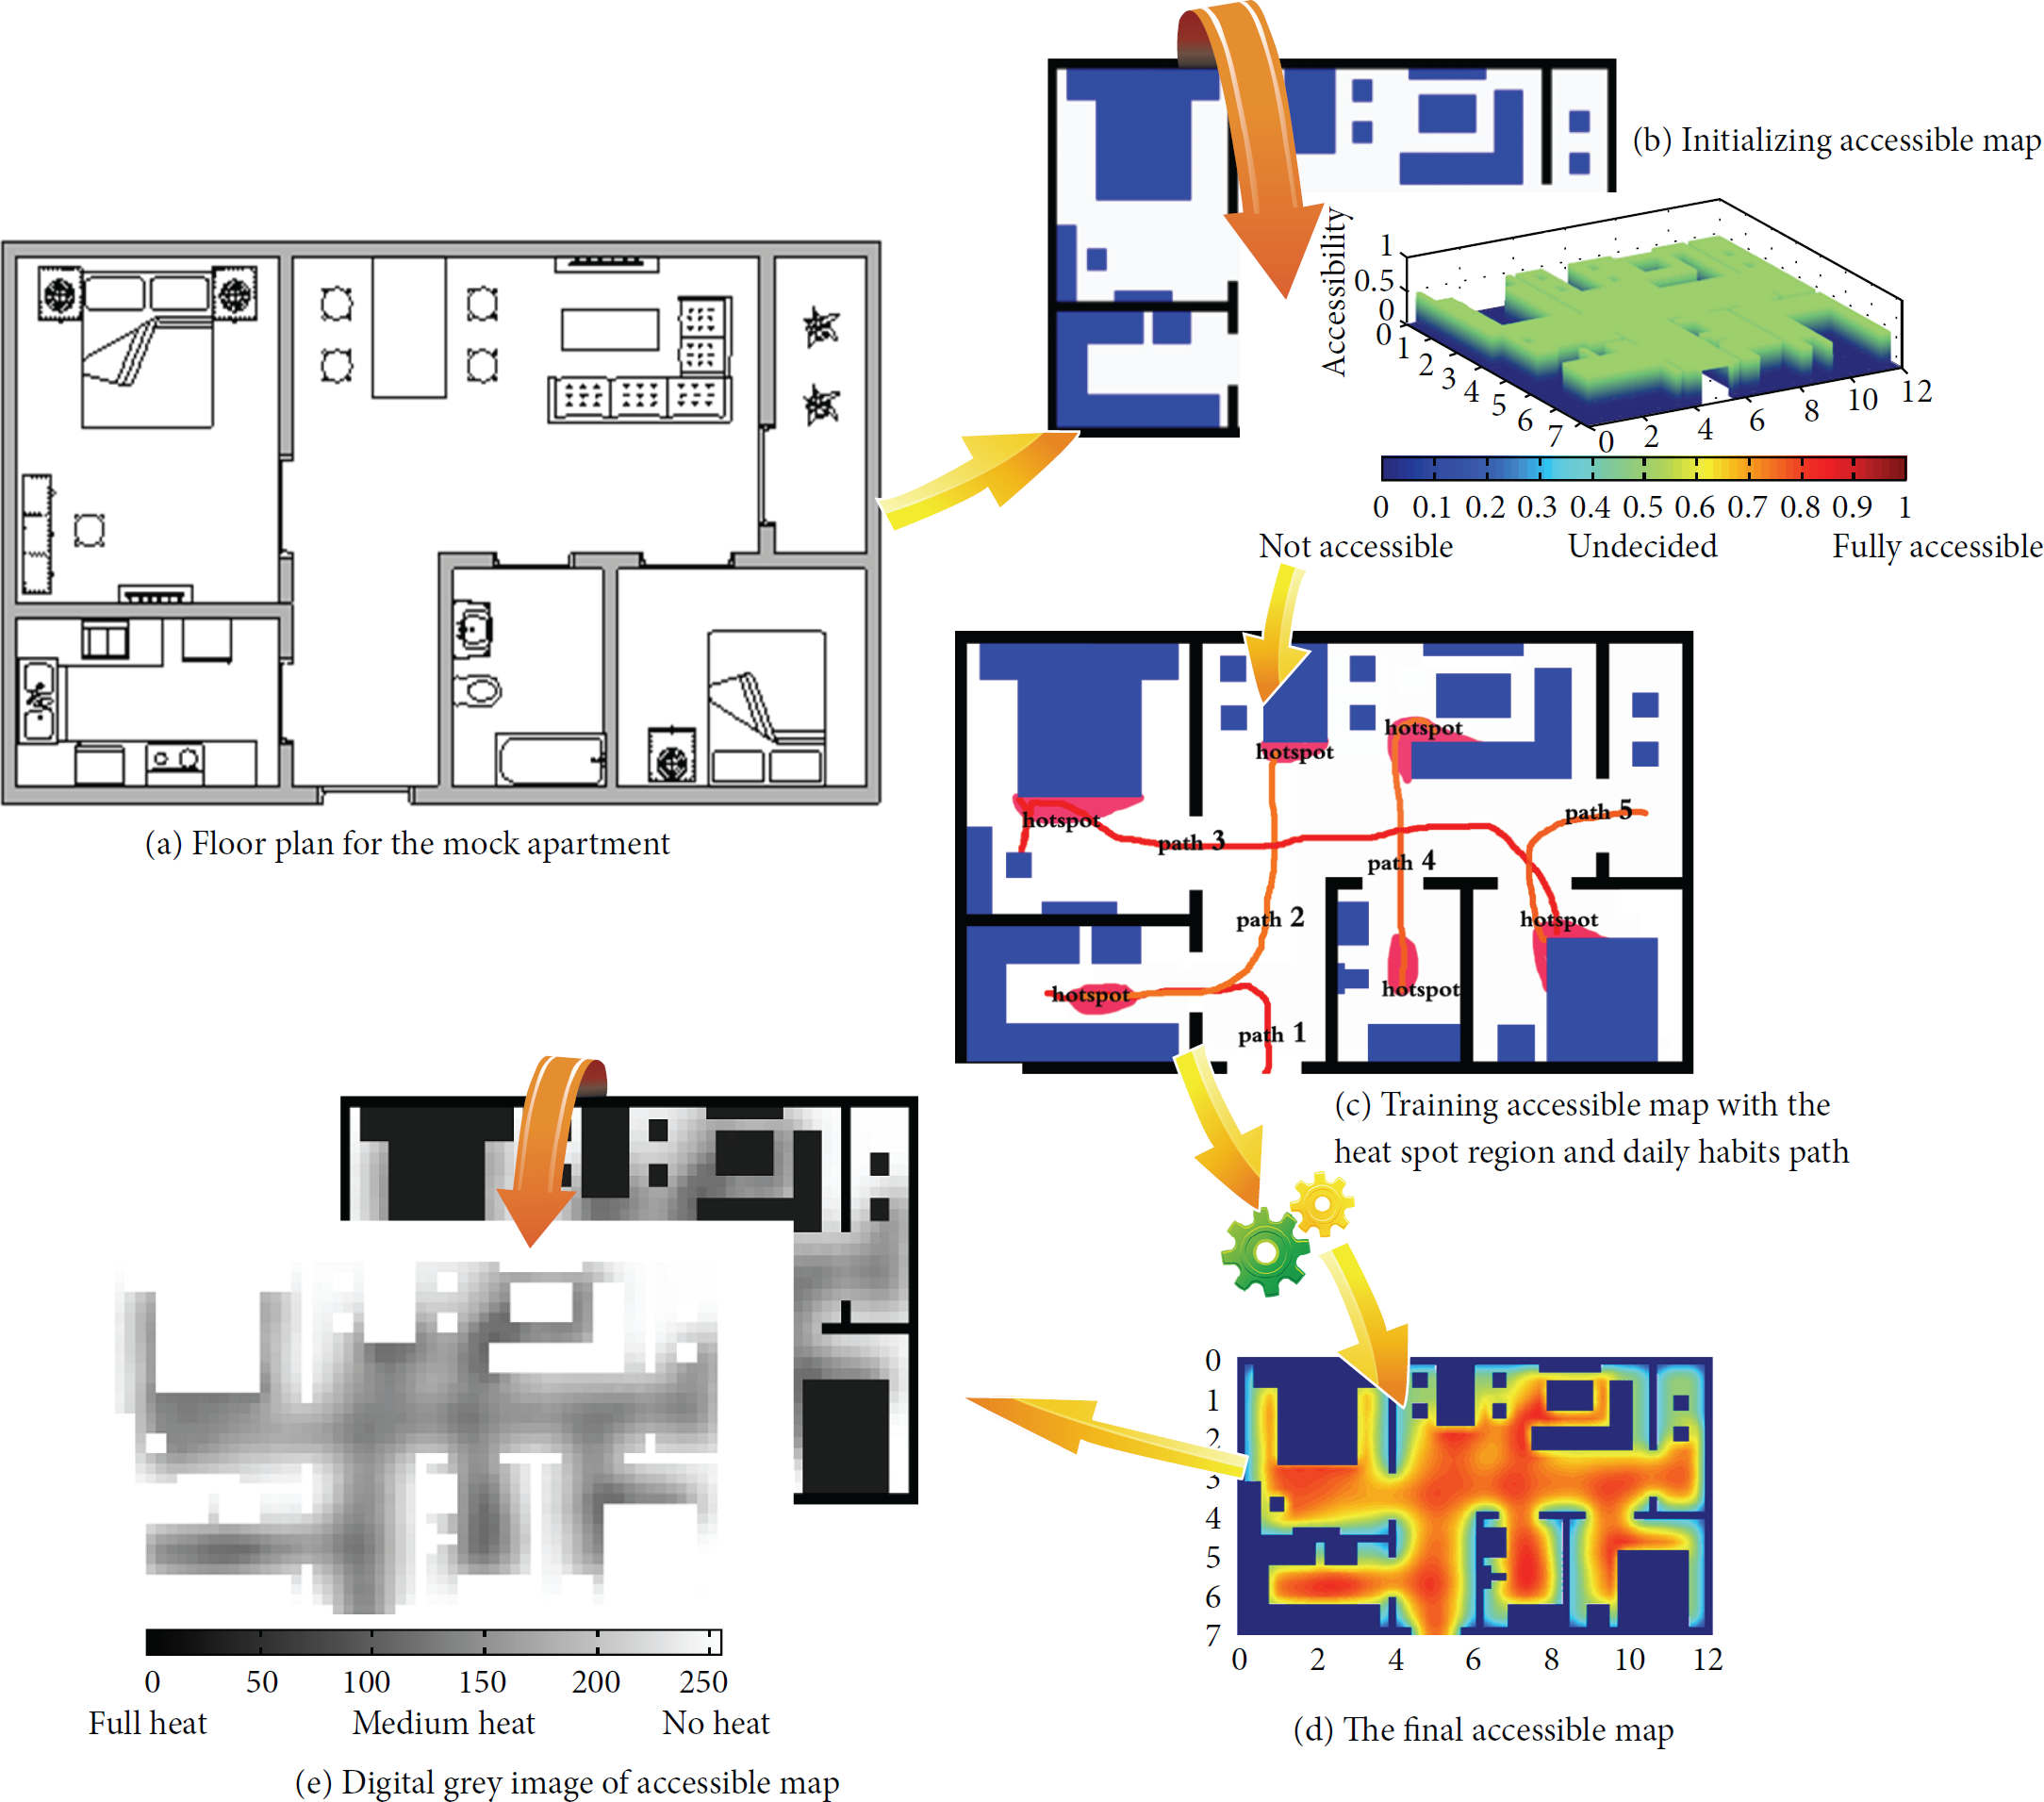
The flow chart of building the accessible map.
Step 1.
The full description of space topography of the smart home to be monitored is provided, shown as in Figure 1(a). This includes shape and size of the room layout, location of walls and furniture, and size of the areas in which the indoor environment is partitioned.
Step 2.
The graphical characterization of the space topography is transformed into an accessible map, which can be used to resolve the accessible priority of each area in the smart home.
Step 3.
The accessible map is provided as input of the GA so as to find as output the accessible priority in each area of the smart home. The image of the accessible map is resolved as follows.
Step 3.1. The space topography is fixed for a given indoor environment. If some places are occupied by the walls or furniture such as beds, chairs, or refrigerators, people do not or rarely visit these positions. So the areas of the accessible map occupied by walls or furniture are set as “0.” For other areas without the furniture and other obstacles, the initial value of the accessible map is set as “0.5.” The results are shown as in Figure 1(b).
Step 3.2. For the accessible areas in the smart home, not all positions have the same opportunities to be visited. We use another source of information, that is, the daily visiting habits of human subject when he interacts with the environment. Generally, the human subject visits more frequently around certain furniture. The mock apartment we designed has some key furniture: bedroom bed, living room couch, dining room chair, living room table, kitchen basin, and bathroom sink. The areas around the furniture have more visiting frequencies than other inner areas in the indoor environment.
Step 3.3. Each two pieces of furniture can generate arbitrary route. Some daily routes are trained by
Step 3.4. The last consideration is for transitions between the accessible areas and their surrounding areas. The accessible map value can be computed by convolution of the accessibility with a Gaussian kernel in two dimensions. The mean of the Gaussian kernel is the related wall's position minus/plus 0.2 m, and the variance of the Gaussian kernel is 0.2 m. The equation can be described by

Step 4.
Based on the prior knowledge, the accessible map can be represented in Figure 1(d). The accessible map is discredited by the assumed occupant visits respective grid points. Each grid size is

That means the ith grid point can be accessible. Then we generate the array
3.2. PIR Sensors Optimal Deployment Based GA-Based Algorithm
Genetic algorithm (GA) is a stochastic search technique that mimics the natural evolution proposed by Charles Darwin in 1858 [22]. GA has been successfully applied to a wide range of combination problems. It is modeled largely on the principles of the evolution via natural selection [23], employing a population of individuals that carry on the selection procedure in terms of variation-inducing operators such as mutation and recombination (crossover). A fitness function is used to evaluate individuals, and reproductive success varies with fitness. The main objective of employing the GA in our approach is to enhance the performance of the indoor location after initial deployment of the stationary nodes. The details are described as follows.
3.2.1. PIR Sensor Parameters
The interested parameters of the PIR sensing model are represented with the use of a vector p:

3.2.2. Chromosomes Modeling
Each chromosome, as a solution in the GA, represents a set of deployment locations of potential PIRs in the specific apartment. The gens of each chromosome are positive integer values

The example of how to encode the gens of each chromosome.
3.2.3. Fitness Function
The fitness function is used in order to choose the best fittest chromosomes for the purpose of reproduction of the next generated solutions by the GA. In our approach, the fitness function calculates the sum of “heat” scores for each grid point in the x-y plane of the specific space. The “heat” score
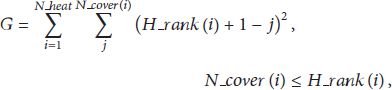
According to randomness and parallelism of evolution individual for PIR layouts, the overlapping probability of multiple PIRs sensing area is large. For this reason, the restriction condition for the number


3.2.4. GA Selection
We use Roulette Wheel Selection (RMS) as the selection method, which gives to each individual i of the current population a probability of being selected [10], proportional to its fitness

3.2.5. GA Operator Operations
(a) Crossover. The crossover operator is a genetic operator that combines (mates) two chromosomes (parents) to produce a new chromosome (offspring). Arithmetic crossover (AC) operator is used for GA in our approach. Children are the weighted arithmetic mean of two parents. Children are feasible with respect to linear constraints and bounds. Alpha is random value in


The example of arithmetic crossover.
Crossover occurs during evolution according to a user-definable crossover probability


(b) Mutation. Mutation introduces random binary changes in a chromosome, which helps escape from local minima's trap and maintains diversity in the population. For binary representation, a simple mutation can consist in inverting the value of each gene with a small probability. In this paper, an improved mechanism of mutation is introduced. Move the actual coordinates of randomly selected individuals representing a real gene; displacement amplitude is based on the individual fitness of scale. The larger the fitness of the individual chromosome is, the smaller the displacement amplitude would be. The probability of mutation is adjusted by using the following equation:


4. Simulation Results
The objective of this work is to have an optimal deployment for PIR-based indoor localization. We consider in the simulation 12 m × 7.2 m area. The thickness of wall is 0.2 m and the door of all the space, such as the kitchen and bathroom, is
Setting for GA parameters.

In order to analyze the performance of our method, several simulation experiments were conducted for the performance evaluation. Hence, we compared the simulation running time and fitness function value when the deployed PIR sensors' number is different for the special indoor environment first. Then we investigated how the accessible heatmap rank affects the PIR deployment in case of a given scenario. Next, we took a closer look at how to keep the tradeoff between the coverage and overlap of the PIR sensing area. And finally, we compared the performance of three deployment methods.
4.1. The Number of PIRs for Optimal Deployment
The first experiment analyzed the effect of PIR sensors' number. As expected, the PIR sensors' number increased the algorithm run time proportionally, listed as in Table 2. In case of a given indoor environment, when the PIR sensors' number is lower than 7, the increase in the number of deployed PIR sensors will not affect the deployment of PIR sensors. However, the number of PIR sensors is larger than 7 and the deployment of PIR sensor will vary with the PIR sensor numbers. In our lab, the PIR sensors' number needs to be determined according to the fitness function.
PIR sensors' deployment versus the PIR sensors' number.

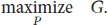
In Figure 4, the fitness value changes for different population size and PIR sensors' number. As is shown, a specific plot represents the fitness versus time under the fixed PIR sensor number. There are three sections in one curve. Section I shows the reproduction in region A, Section II shows the reproduction in region B, and Section III represents the results of mutation with region A and region B. The fitness increases as the PIR sensor number increases.
Fitness curves of GA versus PIR number.
4.2. Effect of Rank of the Accessible Heatmap
The second experiment was performed to understand the effect of the accessible heatmap score rank. The heat score S is used to equally divide the original heat zones based on the different degrees of heat. With the heat range being fixed, the corresponding heat division would be accurate when S increases. This can effectively eliminate the multiple priority layouts. Because our rule is that only the low rate zones' overlap should be punished, the relatively low rate heat range's decrease will lead to the increase of the PIR overlap range. Therefore, the experiment was done to get an appropriate S. The number of PIR sensors is set as 10 in the following experiments.

Quantization effect of the heatmap at different degree and corresponding PIR deployment.
Figure 5 directly presents the features of the PIR layout when S is set as different numbers. When more accurate heat stratification is needed to eliminate the multiple priority, one method is to increase the rank S. Figures 5(c) and 5(e) show that the heat stratification is growing accurate with the increase of the rank S. However, increasing the rank will make the PIR layout tend to overlap. Compared to Figures 5(b) and 5(d), the appropriate overlap theory can enhance the localization accuracy. But this increasing to a certain degree, serious overlap would occur, shown as in Figure 5(f). At this point, it is the same as accuracy. After comparison, the heatmap rank degree is set as 6.
4.3. PIR Coverage and Overlap Rate by Different PIR Number
The third experiment examined the effect of the PIR sensors' number against the sensing coverage and overlap. Three parameters are defined to evaluate the effect of PIR sensor number on the sensor coverage. They are listed as follows:
Maximum coverage ratio Actual coverage rate Overlap rate


The results can be seen in Table 3. The value
Evaluation parameters for PIR coverage and overlap rate.

The data in Table 3 indicate that the overlap rate is small and there occurs no overrated overlap if PIRs number is lower than 8. This shows that the overlap rate tends to be low if the PIRs number is small, which goes in line with the coverage priority principle. That is, the coverage needs to be more if there are fewer PIRs. The overlap rate and overrated overlap remain unchangeable when the PIRs number is 8, 9, or 10. At this point, the result would be superb if the PIRs number is 10 based on the actual coverage choice standard. The actual coverage does not increase much and the overrated overlap is high when the PIRs number increases to 11. Compared to the outcome of the PIRs number being 10, the localization accuracy has not much increased. Hence, we would believe the best PIRs number which is 10 would be the best layout.
4.4. Performance by Three Deployment Methods
In the last experiment, changes in the fitness by GA, greedy algorithm, and manual random deployment were observed. The performance curves by three various PIR deployment algorithms are presented in Figure 6. The green curve is with the GA method and the red and blue curves are represented by greedy algorithm and random deployment, respectively. Our purpose is to find a common way to solve the PIR sensor layout problem from simple to complex. When people do not know how to make PIR sensor layout, the simplest way is to put them in an optional space by random deployment. Then, the possible method is to place the sensor according to the fitness value in order which is named greedy algorithm. After careful consideration of the previous method, it can be found that all the sensors are not placed at the same time, so it is likely to lead to a local optimal state. GA is a parallel algorithm which can solve this problem easily. Although the performance between GA and greedy algorithm is similar at the beginning, the gap is increasing with the increase of the number of PIR sensors. In fact, the gap has a greater impact on the accuracy of the location experiment when the sensor layout is determined. The results show the PIR sensors layout is not ideal by manual random deployment and also not stable. As the PIR sensors number increases, the performance by our proposed method is better than the other two.

The fitness curves by GA, greedy algorithm, and manual random deployment.
5. Conclusion
The main contribution of this paper was to optimize the coverage in sensor networks considering area accessible frequency. The GA we proposed to solve the coverage problem defined in this study stands out with its novel fitness function, which is quickly calculable and based on area priority. Additionally, the proposed optimizations are novel approaches that we introduced in this study that allow for faster convergence of the solutions. The actual coverage rate is 39.03%, and overlap rate is 7.14% when the number of PIR sensors is 10. The running time of our method for PIR sensor layout is greater than 10 minutes. It will increase according to the number of PIR sensors. In the future, we tried to obtain the PIR sensors layout by the multiobject function and some considerations will be placed on the efficacy of the algorithm.
Footnotes
Conflict of Interests
The authors declare that there is no conflict of interests regarding the publication of this paper.