
Abstract
The aim of this study is to construct an intelligent wireless sensing and control system to address health issues. We combine three technologies including (1) wireless sensing technology to develop an extendable system for monitoring environmental indicators such as temperature, humidity and CO2 concentration, (2) ARIMA (autoregressive integrated moving average) to predict air quality trends and take action before air quality worsens, and (3) fuzzy theory which is applied to build an energy-saving mechanism for feedback control. Experimental results show the following. (1) A longer historical data collected time interval will reduce the effects of abnormal surges on prediction results. We find the ARIMA prediction model accuracy improving from 3.19 ± 3.47% for a time interval of 10 minutes to 1.71 ± 1.45% for a time interval of 50 minutes. (2) The stability experiment shows that the error rate of prediction model is also less than 7.5%. (3) In the energy-saving experiment, fuzzy logic-based decision model can reduce the 55% energy while maintaining adequate air quality.
1. Introduction
Most people spend approximately 80% to 90% of their time indoors; therefore, indoor air quality has a large impact on health and work efficiency [1]. The popularity of air conditioning has made comfortable indoor spaces with reasonable air quality available to many people [2]. The research has shown that the use of air conditioners increases the amount of pollution in the air in closed spaces because of a lack of air exchange between indoors and outdoors, presenting a significant threat to our health [3]. Exposure to air that contains elevated levels of CO2 can lead to hyperventilation, increased heart rate, headaches, and vascular constriction. High CO2 concentration exposure affects breathing, decreases oxygen supply to the heart, and may result in suffocation [4]. Sensing technology has progressed in recent years [5], so more researchers use the technology to monitor and assist individuals who live and work in these spaces [6–9]. Some studies [10–13] also use sensing technology and machine learning to predict CO2 levels in the environment. The ability to predict trends in indoor air quality in dynamic situations would be extremely beneficial. The information can be used to evaluate alternative methods for improving air quality. The relevant components of this system, which involves hardware architecture, software architecture, system framework, and equations, are detailed in the following sections.
2. Materials and Methods
The system consists of three parts, as shown in Figure 1. (1) Data acquisition: a polling mechanism is used to obtain environmental indicators such as the temperature, humidity, and CO2 concentration. (2) Data analysis: the collected data are placed into an ARIMA prediction model to predict the trend of air quality. Fuzzy theory and knowledge databases are applied to select an indoor air quality improvement method. (3) Data feedback: according to the fuzzy results, several actions may be performed. For instance, a warning message may be sent, or the fan may be automatically controlled. Moreover, multiple methods of examining the analyzed data are provided, including web pages or mobile devices.
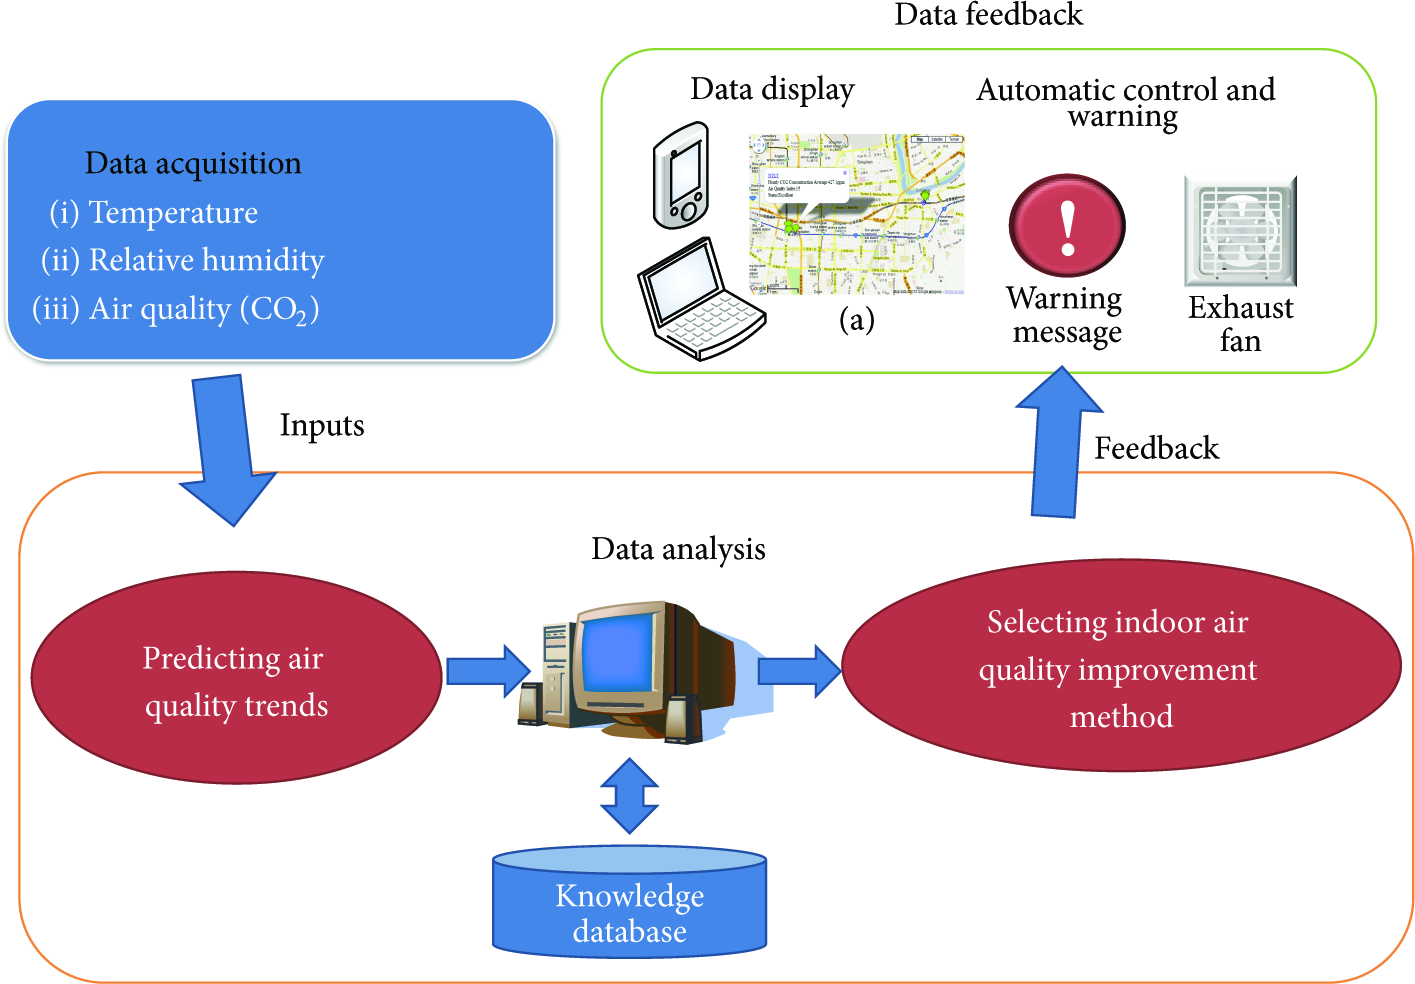
System flow chart.
2.1. Hardware Architecture
We designed wireless sensing equipment to collect temperature, humidity, and CO2 concentration data. Figure 2 displays the hardware architecture. Each sensor node is based on IEEE1451.4 [14] and follows Zigbee communication specifications for receiving and sending data. The sensor's parameters are stored in EEPROM (electrically erasable programmable read-only memory). Figure 3 shows the flow chart of sensing mechanism. The first step is to check how many sensors plug in and read the essential parameters from EERPOM such as sensor type, heating duration, heating period, and heating voltage. The second is signal analysis and adjustment. To avoid sensing data with weak electrical signals, an amplifier and filter are employed to obtain high-quality signals. An A/D converter converts the analog signal to a digital signal, which can be further processed and analyzed. To ensure accuracy of CO2 concentration measurements, an adjustment process is required to reduce error. Refer [15] to do the adjustment. The third is heating procedure. A standard heating procedure is hard to meet different sensors requirement because different sensors have their own heating duration, heating period, and heating voltage. For convenience and flexibility, we implemented this procedure. Figure 4 shows an example. According to the specification, this sensor needs a 150-second heating period including 60 seconds of 0.8 volts and 90 seconds of 0.25 volts. Finally, we can get the best signal at 0.5 seconds before the end of heating. The last one is to send the sensing data. The sensor node repeats these steps until it shuts down or is out of power. In order to estimate the pollution content of well-mixed air and to prevent human interference, sensor nodes are placed approximately two meters above ground level, near the exit air vents. The distance between the two sensor nodes is set to five to ten meters to optimize the quality of data considering both environmental and communication limitations. Each data packet carries the following information: (a) transmitter name, (b) receiver name, (c) date and time, (d) data, and (e) checksum, which is calculated as (1), where L is the length of the packet and B is the received data packet array:


Hardware architecture of our proposed system.

Flow chart of sensing mechanism.

Example of heating procedure.
2.2. Software Architecture
The software architecture of smart environments is complex [16]. For simplicity, the software architecture is divided into three components, as shown in Figure 5: (1) data monitoring agent: this agent acts as a bridge between the hardware and software and can be used to obtain environmental data for further use. (2) Air quality analyzing agent: the agent predicts indoor air quality trends and identifies an improvement method when the air quality is highly polluted. (3) Application agent: our system provides three services, including alert/warnings, automatic control, and data display, to help people understand and improve their indoor air quality. The software of our proposed system is developed within .NET frameworks, Android SDK (software development kit), and Google map API. The following subsections describe how to implement each agent.

Software architecture of our proposed system.
2.3. Data Monitoring Agent
The agent acts as a bridge between the hardware and software and obtains environmental data. Two main functions are designed to obtain data from the sensors. The first function is a polling mechanism. This mechanism has a timer to send out a query command to a unique sensor when the timer triggers. Sensors send back monitoring data when they receive the query command. Users can set the time interval. In our study, the time interval is set to 10 seconds. The second function of the agent is to verify the data, that is, to determine if the incoming data packet is correct or not. The checksum value is used in the present study to verify the data. The incoming packet has a checksum value, which is calculated as (1), where L is the length of the packet and B is the received data packet array. Verified data are fed to the ARIMA model to predict future CO2 levels in the environment. The prediction results perform various environment improvement procedures via fuzzy theory, such as sending out warning signals or turning on equipment to improve the air quality.
2.4. Air Quality Analyzing Agent
The goal of the agent is to predict indoor air quality trends and identify improvement methods when the air quality is highly polluted. We use an ARIMA prediction model to predict air quality and apply a fuzzy logic-based decision model to make a decision at every time interval. In the present study, the decision time interval is set to 10 minutes. Users can establish this time interval. In the following subsections, we describe how to implement the ARIMA prediction model and fuzzy logic-based decision model.
2.5. ARIMA Prediction Model
Many factors affect carbon dioxide concentration in the indoor environment, such as the number of people per unit area, their level of activity, ventilation, and the quality of air outside. It is impractical for the model to account for all these factors. In this study, the problem has been simplified using the ARIMA theory to predict carbon dioxide concentration, where a prediction is made based on historical data. ARIMA theory is used in time series analyses and is based on the correspondence between historical and current trends in the data. Equation (2) is applied in this study. ARIMA consists of the AR (autoregressive) and MA (moving average) parts. The former represents the relationship between current data trends and the trend during a period p in the past, while the latter describes the relationship between the current trend and the random error during a period q in the past. In (2), σ and θ are the weight parameters for AR and MA, respectively;

2.6. Fuzzy Logic-Based Decision Model
The system needs to detect environmental changes and decide which conditions require activation. We built a fuzzy logic-based decision model [13, 19–21] to solve the complex environment assessment problem. There are three variables in the input layer. Each input has three levels: Temperature (Low, Moderate, and High), Humidity (Low, Moderate, and High), and CO2 level (Low, Moderate, and High). The output variable is called “Indicator.” The output range is from 0 to 100, which indicates five levels of indoor air quality, that is, Excellent, Good, Regular, Bad, and Dangerous. According to air quality standards [10], the negative effects in health of air pollutants can be classified. Each level can be classified as follows:
Excellent: suitable for indoor activities. Good: indoor activities can be carried out, but possible discomfort can occur in children, the elderly, and people with illnesses. Regular: indoor activities should be avoided; greater health effects in the population, particularly in children and older adults with cardiovascular and/or respiratory problems such as asthma, can be present. Bad: greater adverse health effects in the general population, particularly children and older adults with cardiovascular and/or respiratory conditions such as asthma. Dangerous: health effects in the general population. Serious complications can be present in children and older adults with cardiovascular and/or respiratory conditions such as asthma.
The member function considers the level of environmental risk about human health and comfort. This function is to transform real data into a value in the

Decision rule table.

zmf: Z-shaped built-in membership function, smf: s-shaped built-in membership function, trimf: triangular-shaped membership function, trapmf: trapezoidal-shaped membership function.

Member function definitions for fuzzy variables: (a) temperature (unit: °C), (b) humidity (unit: relative humidity %), (c) CO2 concentration (unit: ppm), (d) indicator. Y-axis means degree of membership.
2.7. Application Agent
The application agent performs three services, including the following. (1) Alert/warnings: a message is sent by email or short message service (SMS) to quickly inform the user. If the area being monitored is highly polluted, an alarm is directly triggered to inform people in the area. (2) Automatic control: this service connects with devices such as ventilation equipment or air-conditioners. When the system detects that the area is highly polluted, the system will turn on devices to control the situation. (3) Data display: the agent is also responsible for displaying monitoring data. In web and mobile devices, we use charts and Google maps to show the air quality and location, which are easier to understand than raw data. We provide many ways to allow the user to easily examine analyzed data by browsing web pages or using mobile devices.
3. Results and Discussion
This study focused on the health statuses of the people in the monitoring area. The pollutant sampled was CO2. The data collected are presented to the end user in visualized form, allowing the user to easily examine the analyzed data by browsing web pages, as in Figure 7(a), or from mobile devices, as in Figure 7(c). The monitoring data are shown in a chart, so end users can quickly understand the trend of CO2 concentration, as in Figure 7(b). Our system has been deployed at 9 different areas in Taiwan, such as elementary school, university, and environmental protection administration. Otherwise, the relative accuracy is within the range (≦ 10% standard gas) that is defined in Taiwan. In our experiments, we discussed the variation and accuracy of the CO2 concentration. The following experiments were performed to test the entire system. (1) Validation of prediction model accuracy: the accuracy of the prediction model was validated by predicting the CO2 concentration. (2) Energy-saving performance validation: the prediction model was integrated with the fuzzy logic-based decision model to verify that the CO2 concentration was maintained below the threshold and that ventilation equipment was switched off whenever possible.

Data visualization: (a) in web, (b) trend of CO2 concentration, (c) in mobile devices.
3.1. Validation of Prediction Model Accuracy
All equipment was set up in an electronics factory to collect carbon dioxide concentration measurements. The size of experimental environment is 15 (meter) ∗ 12 (meter) ∗ 4 (meter). At first, we set up wireless sensors to collect CO2 concentrations every ten seconds for one day to train the fitness ARIMA model. Second, we have to determine the parameter of
We used 
Prediction results for CO2 concentration in different intervals.
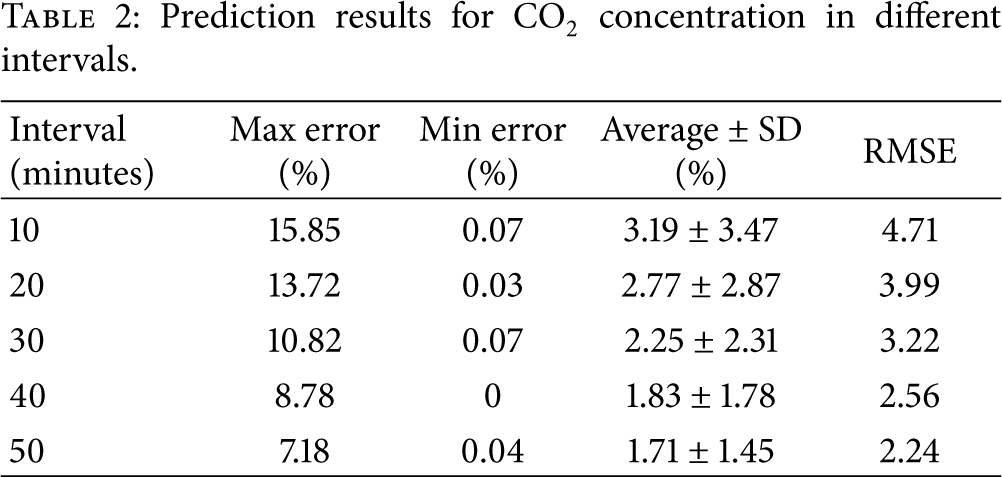
Based on the experiment results, we can summarize three main steps for making a proper prediction procedure. The first step is that sensor nodes are placed approximately two meters above ground level, near the exit air vents for estimating the pollution content of well-mixed air and preventing human interference. The distance between the two sensor nodes is set to five to ten meters to optimize the quality of data considering both environmental and communication limitations. The second is that we suggest collecting data to train predication model during five working days. This step will help the model understand the trend of concentration in the environment. Each measured data's interval is 10 seconds. The last step is to choose the proper length of historical data. If the change of CO2 concentration is stable such as a factory, it is suitable for longer collection such as 40 or 50 minutes. In an unstable environment, the shorter interval such as 10 or 20 minutes is suggested because we want to fit the change of the environment.
3.2. Verifying Energy-Saving Performance
The experiment was conducted in a simulation box with a volume of 66 L in which a small fan was installed to simulate the indoor air circulation system. To simulate air quality during work hours (9:00~17:00), the CO2 input was set to 2 L/min. It was adjusted to 0.5 L/min during the lunch break (12:00~13:00). If the fuzzy logic-based decision model output level became Poor, the fan was turned on to expel air at 4 L/min; it was not turned off until the output level became Regular. The experiment duration was 490 minutes. A prediction was made every 10 minutes to decide whether the ventilation equipment needed to be turned on. Figures 8(a) and 8(b) show the change in predictions at 50 and 10 minutes, respectively. Four states are represented: (1) Indicator Increases: the air quality has worsened due to human presence and a lack of ventilation. (2) Ventilation On: when the fuzzy logic controller detects that the air quality is worsening and the indicator is higher than 60, the ventilation system turns on. (3) Indicator Decreases: once the ventilation equipment is turned on, the CO2 concentration is reduced and the air quality improves. (4) Ventilation Off: when the air quality level becomes Regular and the indicator is under 60, ventilation is turned off to save energy. The state returns to (1).

Results of the indicator and CO2 concentration: (a) time interval 50 minutes, (b) time interval 10 minutes.
Experimental results show the following: (i) the combination of the prediction module and the fuzzy logic-based model can control the CO2 concentration effectively; the results show that the CO2 concentration is controlled below the defined 1,000 ppm threshold. (ii) During lunch, as the workers are absent and most machines are in sleep mode, there is a sudden drop in CO2 concentration. To prevent the prediction accuracy from being affected by extreme data, we increased the time interval to increase the amount of data acquired. Therefore, a quick drop in the CO2 concentration will not cause large changes in the prediction model. As the results demonstrate, the interval of 50 minutes did not change suddenly, but other interval lengths show dramatic variation. (iii) The system proposed in this study not only maintains the CO2 concentration within the required range, but it also saves energy by switching off equipment when appropriate. In [22–24], the operation time is the most important indicator to evaluate whether the system is power consumption or not. In our experiment, the fan was on for 220 minutes during the 490-minute experiment. The energy savings were approximately 55%.
4. Conclusions
This study proposes an intelligent air quality control system that monitors indoor air quality by combining wireless sensing technology, ARIMA prediction models, and fuzzy theory. The system provides an analysis and prediction of the indoor working environment. The three main contributions of this study are as follows. (1) We developed a suitable mechanism, agents, and software architecture for monitoring environmental parameters. (2) Sensing equipment is capable of wireless network and IEEE1451.4 [14] protocol for ease of deployment. The different sensor requirements would self-configure and be ready for plug & play. (3) We control indoor air quality in a comfort range with less power consumption. Experimental results show that the system is able to improve accuracy by effectively reducing abnormal peak values. Beyond establishing the air monitoring system, the system can also trigger an early warning and take action before air quality worsens at minimum power consumption. This technology can be applied to monitor other pollutants and provide health benefits for people.
Footnotes
Conflict of Interests
The authors declare that there is no conflict of interests regarding the publication of this paper.
Acknowledgments
This work was supported in part by the Ministry of Science and Technology (National Science Council) of Taiwan under Grants NSC 100-2218-E-182-004, NSC 100-2218-E-027-001, NSC 102-2221-E-182-003, and NSC 102-2218-E-004, by Chang Gung University under Grants CMRPD1B0331 and EMRPD1D0311, and by Chang Gung Memorial Hospital under Grant CMRPG5B0061.