
Abstract
Video transmission is a real challenge for wireless multihop networks with high packet loss rate. This paper proposes a cross layer video transmission scheme which combines the geographic routing in network layer and the short-length Luby transform (LT) codes in transport layer. We first analyze the effect of bit error rate (BER) on the retransmission load and the effect of payload length and LT symbols size on network efficiency. Then, based on the product of the link quality and the distance from destination, we design a routing metric for geographic routing. We further propose a cross layer transmission scheme, which adaptively adjusts payload length to encapsulate short-length LT encoded symbols and selects routes based on the new routing metric. The simulation results show that our cross layer scheme can decrease the decoding overhead and the packet loss rate, while improving the video transmission quality and the network efficiency.
1. Introduction
During the last few years, Wireless Multimedia Sensor Networks (WMSNs) [1–5] have been a research focus in the field of sensor networks. Because the captured video data has the potential to provide richer information, enable multiresolution views, and avoid false alarms, WMSNs can be used in various applications, such as environmental monitoring, object detection, and localization.
Video transmission over wireless multihop networks is challenging due to the varying nature of the wireless channel and the inherent difference between the video data traffic and the general data traffic. On one hand, the time-varying wireless channels lead to high bit error rate. The video transmission scheme in multihop networks should take the significant packet loss rate into account. On the other hand, different from the general data traffic, one video frame is usually fragmented into several wireless packets due to the Maximum Transmission Unit (MTU) in the wireless medium. At the final receiver, these wireless packets should be reassembled to reconstruct the video frame. In video transmission, a single bit error in a packet may lead to the packet loss, which results in poor quality of the entire video frame.
In this paper, to deal with the challenge for video transmission in the multihop networks, we propose a cross layer transmission scheme which selects routes based on a new metric for geographic routing and adaptively adjusts payload length to encapsulate short-length Luby transform (LT) encoded symbols. More specifically, we analyze the effect of bit error on retransmission load and design a geographic routing metric considering link quality and distance from destination. Based on the bit error rate (BER), we also analyze the effect of payload length and LT symbols size on network efficiency and then design the strategies of selection length for short-length LT symbols size and payload length, respectively. We further propose the cross layer transmission scheme, which adaptively adjusts payload length to encapsulate short-length LT encoded symbols and selects routes based on the new routing metric. The simulation results show that our cross layer scheme can decrease the decoding overhead and the packet loss rate while improving the video transmission quality and network efficiency.
The rest of this paper is organized as follows. Section 2 describes the related work. In Section 3, we analyze the effect of bit error on the link quality, and the length selection for LT symbol size and payload length, and then design the geographic routing metric and propose a cross layer transmission scheme. In Section 4, we carry out simulations to evaluate the scheme. Finally, Section 5 concludes this paper.
2. Related Work
For achieving higher reliability, several Forward Error Correction (FEC) schemes have been proposed and widely used for recovering data from a packet loss [6, 7]. Erasure codes based on XOR operation have become major FEC candidates for reliable data distribution over the wireless networks in terms of their recovery performance. The LT codes [8], namely, digital fountain codes, are ideally suitable for time-varying wireless transmission. An early data dissemination technique based on fountain codes for vehicular ad hoc networks was conducted in [9]. Fountain codes were also invoked in 802.11 wireless networks to protect file transfer by considering 802.11 Media Access Control (MAC) retransmission rate and the properties of the physical layer modulation in [10]. Carefully selecting the payload length is very useful in practical fountain codes system in [11]. Aiming at small size LT codes, the relationship between the delay and the redundancy was investigated in [12] through adjusting the degree distribution parameters, which can help the real-time applications. The packets lost could be recovered with the help of a specific packet containing the FEC code in [13]. Author of [14] studied the effect of payload length and retransmission on multimedia over IEEE 802.11 WLANs. The payload length selection was investigated for three multicast solutions by considering the packet overhead in [15].
Another important way for improving video transmission quality is designing reliable routing scheme. With the availability of low power position tracking devices like GPS, geographic routing algorithms have been widely employed for multihop networks [16]. Geographic routing algorithms usually use one-hop greedy forwarding as their primary routing technique, which might result in routing voids and poor quality of data transmission. To increase reliability, authors of [17, 18] presented routing schemes, which take link quality and residual energy into account.
The design of cross layer can improve the reliable data transmission and network efficiency. In [19], an adaptive cross layer multichannel protocol was proposed to support energy-efficient, high throughput, and reliable data transmission in WMSNs. A cross layer solution for packet size optimization in wireless sensor networks was presented in [20].
However, these works mentioned above could not be directly applied to the video transmission over wireless multihop networks. The next section extends the analysis and proposes a cross layer transmission scheme.
3. Cross Layer Video Transmission Scheme
3.1. The Effect of Bit Error
Let P be the packet loss probability over the end-to-end wireless transmission. When a packet is lost, the probability that the packet is correctly received after k times retransmission is

In the wireless multihop networks, let n be the number of multihop links and e the BER of the wireless channel. For simplicity of analysis, we ignore the packet collisions. The relationship between P and e is

In accordance with (1) and (2), the proportion of total increased load over a n-hop wireless link, denoted by
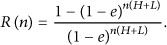
For different values of BER, the relationships between the increased proportion and the payload length are shown in Figure 1. Here, n is set to 3; H is set to 66 bytes including the overhead of IP layer, UDP layer, and the application layer. Figure 1 illustrates that the larger the payload length is, the greater

The increase of retransmission load over 3-hop wireless links.
3.2. Geographic Routing Metric
Selecting a high quality route to destination node is very important. Geographic routing sometimes leads to poor link quality due to the increased distance between the sending node and the relaying node.
For geographic routing, a good routing metric should consider both Packet Reception Rate (PRR) and the distance from destination. A routing metric of modified PRR is used over k-hop [21], which improves the packet delivery rate.
In the wireless multihop networks, all the nodes discover neighbors by the means of periodic exchange of Hello packets. Due to the unreliable wireless link, some Hello packets could be lost during transmission. Thus, we can use the number of received Hello packets to evaluate the link quality. In our scheme, it is assumed that the MAC layer sends the Hello packet only once; therefore, we can utilize the difference between the sequence numbers of two successively received Hello packets to indicate the quality of wireless link between the node and its neighbor. In this paper, we use the symbol

Then, the new metric for geographic routing, denoted by G, is given by

Due to that our routing metric is based on the product of link quality and distance to destination, it can efficiently improve the routing delay and energy efficiency in transmissions.
3.3. LT Codes
The LT codes are a class of packet-level FEC techniques, which can adapt to the time-varying transmission over multihop networks and are very suitable for the data recovery in the erasure channel. The encoding process of it is given as in Figure 2.

Example of LT coding.
For an original data with length F, it firstly will be partitioned into
Please note that the degree of encoded symbols should be high enough to ensure that each source symbol is involved in the encoding process; at the same time, most of the degrees should be low enough to ensure decoding process to continue. Thus, the design of degree distribution is the key of successful LT codes [8, 22].
Robust Soliton Distribution (RSD) [8] has been widely used in LT encoding. For the Robust Soliton Distribution, the probability that an encoded symbol has degree d,


According to [8, 22], in order to recover the data successfully with the high probability, the number of encoded symbols that need to be received by the decoder, denoted by M, is
The investigation in [23] points out that if the size of source symbol is small, the number of source symbols will be large and the decoding efficiency will be high.
Previous designs of LT codes mainly consider the situations that the value of K is bigger than 104, which will incur a large latency. Thus, they are not suitable for the real-time video transmission, and short-length LT codes are needed. When short-length LT code is implemented, video data can be divided into smaller source symbols; thus we can get larger number of source symbols. However, the overhead of encoded symbol, which includes encoding symbol ID, will be large inevitably, and as a result, the transmission load will greatly increase also. Therefore, how to choose an appropriate symbol size T is very important.
The increase of load for LT codes, denoted by
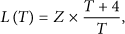
The relationship between the
The increase of load versus LT symbol size.
3.4. Adaptive Short-Length LT Transmission Scheme
From Figure 1, we can see that, during the real-time transmission of video, the length of payload has great influence on the overhead of transmission. In order to decrease the latency, we propose to use the short-length LT code in our transmission scheme. Furthermore, we also formulate the relation between the load increase incurred by LT code and the symbol size T and calculate the optimal value of T to minimize the load increase.
Based on the work above, we present a cross layer transmission scheme for video data, which could take the effect of payload length into account. According to the feedback of transmission quality and the hop count of geographic routing, this scheme can adaptively adjust the length of payload. More specifically, the scheme works as follows.
To generate LT encoded symbols, the video data to be transmitted is firstly divided into K source symbols. The value of K can be calculated by

Then, the encoder generates encoded symbols from these K source symbols. In order to recover the data successfully with high probability, the number of encoded symbols that need to be received by the decoder should be larger than M. As can be seen from Section 3.3, M is equal to
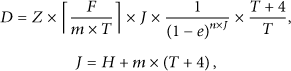
In the multihop route table of the sender, we can get the value of hop, namely, n. According to (2), the receiver can get e, and then back e to the sender. Thus, according to the quantitative relationship given by (10), we can compute the optimal m to minimize the total data traffic D and maximize the transmission efficiency.
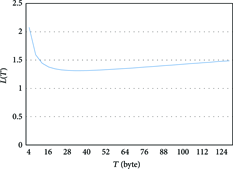
For different values of hop number, the relationship between the data traffic D and the payload length is illustrated in Figure 4. Here, the length of total data is set to 30000 bytes, the BER is set to 3 × 10⁻⁴, and the value of hop number is set to 1, 3, and 5, respectively. Figure 4 shows that there are relatively sharp troughs in transmission data traffic for larger hop while a more gradual transition is observed for smaller hop. For every case in Figure 4, there is a small range of payload lengths that can be selected to minimize the data traffic.

Data traffic versus payload length.
3.5. Discussion
Traditional geographic routing algorithms usually use one-hop greedy forwarding as their primary routing technique, and the node which is the nearest to the destination is selected as the relay. Because the quality of wireless link between the sender and the relay node is not considered, sometimes video transmission through the wireless link will result in large distortion. However, in our scheme, when the relay node is selected, we use the number of received Hello packets to evaluate the link quality, and the factor of distance is also considered in our routing metric design.
According to (2), the packet loss rate varies depending on the BER and the length of payload, and the BER will also change when the wireless environment changes. However, in traditional schemes, the length of payload is fixed, then when the BER increases, the packet loss rate will increase also. This will decrease the video transmission quality. In our scheme, the length of payload can adaptively change according to the feedback of transmission quality and the hop count of geographic routing. Thus, the packet loss rate can maintain a low level with the increase of the BER.
Video frame is usually fragmented into several wireless packets due to the Maximum Transmission Unit (MTU) in the wireless medium. If a video packet is lost during transmission, the frame cannot be reconstructed. However, in our scheme, before the video packets transmission, we employ the technique of short-length LT codes to encode them. Furthermore, we select the optimal symbol size. Thus, we can recover the video frame with a higher probability when some packets are lost.
4. Evaluation
4.1. Experiment Platform
In order to better evaluate the performance of our transmission scheme, we have developed the video capturing node, relay nodes, and the video server.
The video capturing node developed by our laboratory is an embedded module based on the S3C6410 ARM11 processor and Linux 2.6.28 operating system. In order to realize the real-time video capture, it photographs with OV3640 digital camera chip supported by Linux. Meanwhile, the H.264 encoder inside the ARM processor achieves real-time video compression. The node supports the IEEE 802.11b standard with the GM320 wireless chip. We also developed geographic routing based on metric proposed in Section 3.2 and ad hoc on-demand distance vector routing (AODV). The node can act as relay node as well as sink node.
The video server is developed based on the Windows operating system. Just like most video software, the server can decode the H.264 frames, display the video, and save YUV frames as log file.
Figure 5 shows the video capturing node. Figure 6 illustrates the function blocks of the nodes and video server.

Video capturing node.

Function block of the nodes and video server.
The deployment of the platform is illustrated in Figure 7. We deploy four video capturing nodes at four corners of the floor, one relay node, and one sink node. From the view of practical effect, the adaptive transmission is efficient for real-time video monitoring in the platform.

The deployment of the platform.
4.2. Simulation Environment
Our simulation experiments aim to study the performance improvement of cross layer video transmission scheme proposed in this paper. The simulation is based on the capturing nodes, relay nodes, and video server mentioned above.
On the capturing nodes, the YUV video sequence in the
Figure 8 shows how a video in the original YUV format is compressed, LT encoded, streamed, LT decoded, and converted back to the YUV format. Due to packet losses during streaming, some YUV frames are missing. The offset of YUV sequence between the sender and the receiver has great influence on the PSNR value. To handle the PSNR calculation issue caused by packet loss, the video server achieves the padding of previous YUV frames in the log file by the sequence number comparison, thereby ensuring the PSNR calculation.
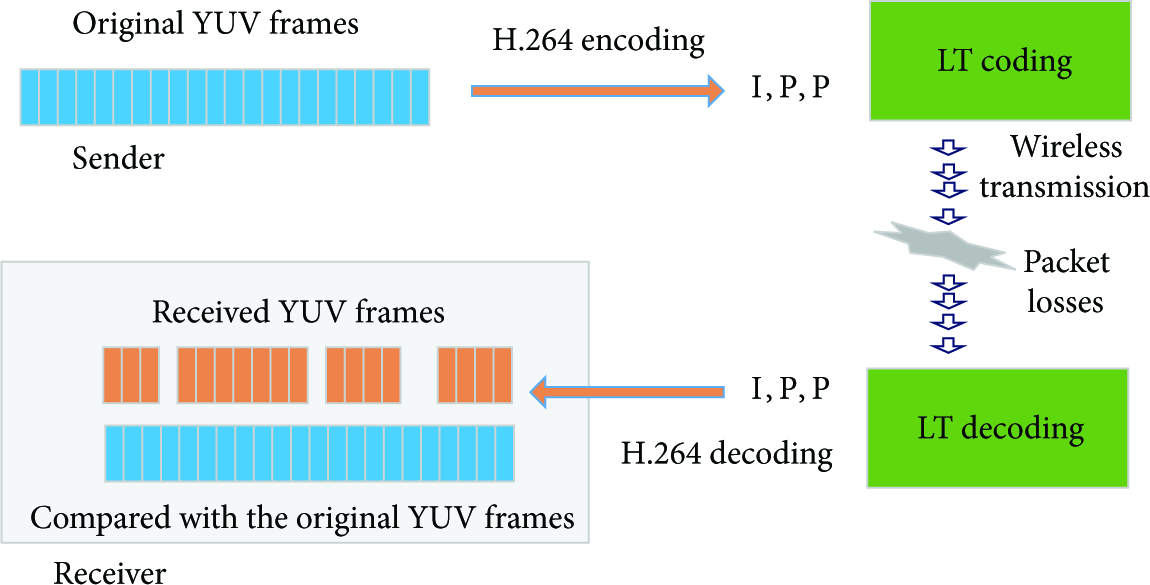
Illustration of video transmission quality evaluation.
We designed the simulation wireless channels based on Gilbert model, and thus the stable wireless channels are achieved.
In the simulation, the deployment area is 1200 × 800 m2, and the number of nodes is 30. We set three paths from source node to destination node. For the first path with 3 hops, BER and Gilbert burst length are set to 10−4 and 10, respectively. For the second path with 5 hops, BER and Gilbert burst length are set to 10−4 and 30, respectively. For the third path with 3 hops, BER and Gilbert burst length are set to 10−4 and 30, respectively.
In case 1, only path 1 works; T is set to 44. In case 2, both path 1 and path 2 work; T is set to 44. In case 3, all of path 1, path 2, and path 3 work; T is set to 48. In case 4, all of path 1, path 2, and path 3 work; T is set to 44.
We evaluate the performance of the different transmission scheme using the following metrics:
packet loss rate: the ratio of the number of lost packets to the total number of packets; decoding overhead: the ratio of the received encoded symbols number for successfully decoding to the source symbols number; decoding success rate: the ratio of the LT successful decoding number to the total number of data unit LT encoded; peak signal-to-noise ratio (PSNR): the simplest and the most widely used video quality evaluation method; structure similarity (SSIM): an image quality measurement method.
We first compare the performance of the cross layer scheme with the fixed payload length transmission. We further compare this proposed cross layer transmission scheme with traditional transmission based on AODV routing.
4.3. Simulation Results
To evaluate the strategies of selection length for short-length LT symbols size and payload length, in every case, video data is transmitted with fixed payload length from 100 to 1000 and adaptive short-length LT scheme, respectively. We first run the new geographic routing.
In case 1, source node only finds path 1 to transmit video data. In case 2, for geographic routing based on the product of link quality and distance to destination, source node selects path 2 to transmit video data. In case 3 and case 4, based on the same metric for geographic routing, source node selects path 3 to transmit video data.
Figure 9 illustrates the relationship between the packet loss rate (PLR) and the payload length for these four cases. For case 1, the great distance leads to poor quality. Considering the retransmission load, case 2 gets lower PLR. For case 3 and case 4, they select the best route. With the growth of payload length, the PLR starts to rise. The highest PLR reached 21% in case 1. The green dots mark the value of short-length LT transmission scheme. As can be seen from the green dots in Figure 9, the scheme adaptively selects the payload length, the PLR is low in these four cases. The reason is that our scheme selects the best route and at the same time adjusts the length of payload according to the feedback of transmission quality. As a result, the PLR decreases.

Packet loss rate versus payload length.
Figure 10 illustrates the relationship between the LT decoding overhead and the payload length for these four cases. As can be seen, the greater PLR leads to greater decoding overhead. With the reduction of payload length, the decoding overhead starts to decrease. The values of short-length LT scheme are marked with green dots. The green dots in case 4 show that the decoding overhead of adaptive short-length LT transmission scheme is near the lowest. Comparison between case 3 and case 4 shows that when T is set to 44, the performance is better. Because the short-length LT scheme decreases the PLR, and as a result, more packets are received successfully, then the decoding overhead for transmission is decreased also.
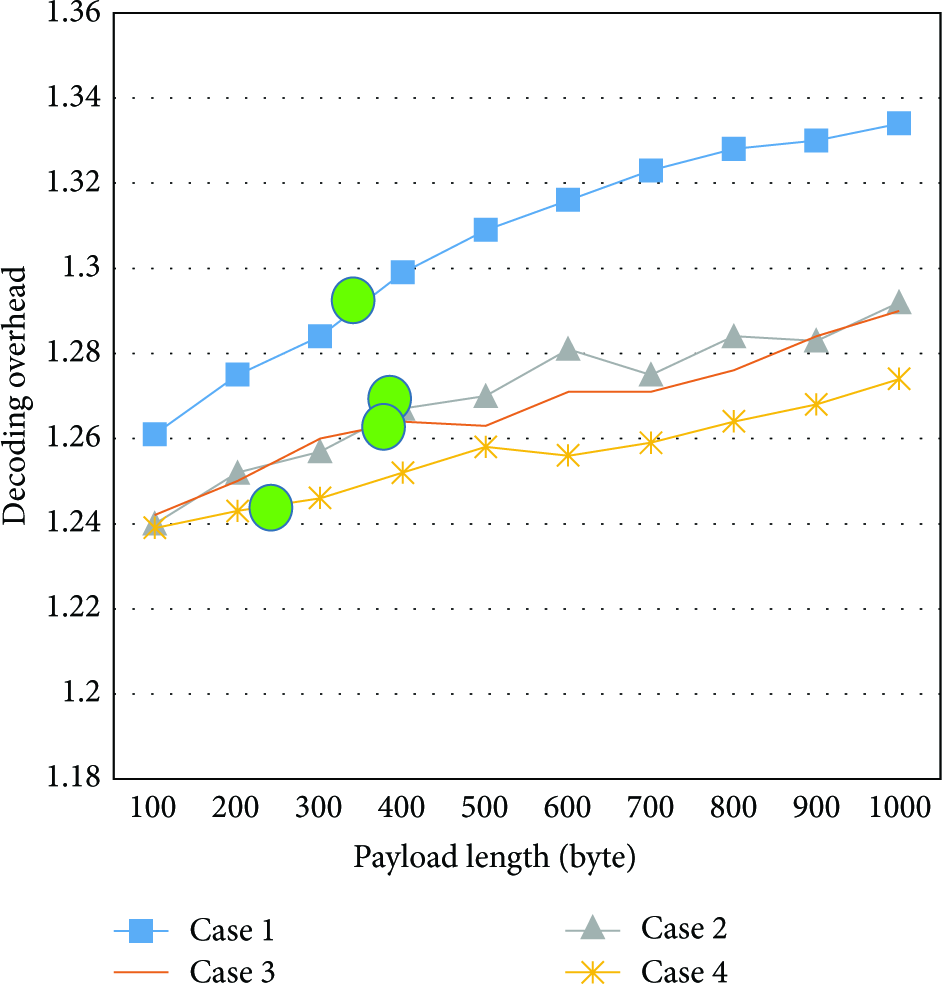
Decoding overhead versus payload length.
The relationship between the LT decoding success rate and the payload length for these four cases is shown in Figure 11. As can be seen, with the growth of payload length, the decoding success rate starts to decrease. The green dots in Figure 11 show that adaptive short-length LT transmission scheme can maintain a high decoding success rate. The reason is that, for the same BER, the larger the payload length is, the greater the PLR is. When the wireless link quality gets bad, our scheme can adaptively adjust the length of payload, and thus the PLR is decreased, which ensures the decoding success rate.

Decoding success rate versus payload length.
For different T value, Figure 12 shows the relationship between the size of total data and the payload length. Here, the size of the original data to be LT coded is 4163805 bytes, and the total data includes the overhead of IP layer, UDP layer, LT coding, and payload. Figure 12 illustrates that small payload length leads to a large overhead. The green dots show that the adaptive short-length LT transmission scheme can maintain a low size of the total data; T is set to 44; the total size is better. The reason is that, for a packet, due to the same size of overhead, the proportion of these overhead is large if the payload length is small. Thus, if we want to transmit the same amount of payload, we need to transmit more data traffic. On the other hand, although the large payload length can decrease the data traffic, it can result in high PLR. However, our adaptive scheme can deal with this problem and decrease the total data traffic while keeping the low PLR. Meanwhile, appropriate symbol size can decrease the data traffic.

Total data versus payload length.
Next, we further compare the cross layer transmission scheme with traditional transmission based on AODV routing in case 2.
Figure 13 shows the snapshots of three videos. Figure 13(a) is a snapshot of the original video. Figure 13(b) is a snapshot of the cross layer transmission video with the same YUV number. Figure 13(c) is a snapshot of the AODV transmission video with the same YUV number. Figure 14 shows the PSNR variation. Figure 15 shows the SSIM variation. As can be seen, the quality of AODV transmission is very poor. The short-length LT transmission scheme can ensure good video quality.

Snapshots of YUV frames.

Comparison of PSNR.

Comparison of SSIM.
The reason is that our scheme is designed based on the distance and the quality which can select the better path. Furthermore, it can recover the lost packets using the technique of LT codes. As a result, it can ensure the video transmission quality.
The relationship between SSIM and the payload length for case 1, case 2, and case 4 is shown in Figure 16. The average SSIM reached the peak when the payload length is very small. With the growth of payload length, the performance began to deteriorate. The green dots in Figure 16 show that adaptive short-length LT transmission scheme can reach higher SSIM. Because the larger the length of payload is, the greater the PLR is. Then, more video packets are lost, and the probability of video frame reconstruction is decreased. Our scheme can adjust the length of payload and decrease the PLR. Then, the quality of video transmission is improved.

Comparison of average SSIM.
5. Conclusion
In this paper, we first analyze the effect of bit error on retransmission load and design a routing metric based on link quality and distance from destination. Based on the BER, we also analyze the effect of payload length and LT symbols size on network efficiency and design the strategies of selection length for short-length LT symbols size and payload length, respectively. We further propose the cross layer transmission, which adaptively adjusts payload length to encapsulate short-length LT encoded symbols and selects routes based on the new routing metric. The simulation results show that the cross layer scheme can decrease the packet loss rate and the decoding overhead, while improving the video transmission quality.
Footnotes
Conflict of Interests
The authors declare that there is no conflict of interests regarding the publication of this paper.
Acknowledgments
This work is supported by the Key Technologies R&D Program of China under Grant no. 2013BAK01B02, the National Natural Science Foundation of China under Grant no. 61332005, no. 61173017, and no. 61272517, and the Specialized Research Fund for the Doctoral Program of Higher Education under Grant no. 20120005130002.