
Abstract
Indoor localization techniques using Wi-Fi fingerprints have become prevalent in recent years because of their cost-effectiveness and high accuracy. The most common algorithm adopted for Wi-Fi fingerprinting is weighted K-nearest neighbors (WKNN), which calculates K-nearest neighboring points to a mobile user. However, existing WKNN cannot effectively address the problems that there is a difference in observed AP sets during offline and online stages and also not all the K neighbors are physically close to the user. In this paper, similarity coefficient is used to measure the similarity of AP sets, which is then combined with radio signal strength values to calculate the fingerprint distance. In addition, isolated points are identified and removed before clustering based on semi-supervised affinity propagation. Real-world experiments are conducted on a university campus and results show the proposed approach does outperform existing approaches.
1. Introduction
Localization techniques are essential for increasingly popular location-based services in pervasive computing and Internet of Things. In indoor environments, GPS signals cannot penetrate, so Wi-Fi based localization methods become the dominant positioning technique. Fingerprinting based on received signal strength (RSS) is the most popular method of indoor positioning that was first proposed in the radar system [1]. This technique includes an offline training phase and an online location estimation phase. The offline phase detects Wi-Fi signal strength from surrounding APs and collects location fingerprints to create a radio map. In the online phase, a Wi-Fi enabled mobile device obtains a vector of signal strengths in real time. These signal measurements are then compared to the fingerprints in the radio map. The location of the best matching fingerprint is used as the estimated location.
The Wi-Fi fingerprinting based method has two problems.
APs mismatch: we have found that the visible Wi-Fi access points (APs) set varies over time and space, which implies that there might not exist a perfect match for current location when trying to find a match in the fingerprint database. Existing work typically uses one of the two methods to work around this issue. One is to select the APs shared by online radio measurements and reference points (RPs) in radio map, and then these APs with the strongest RSS will be used for final matching [2–4]. The other method is to assign a small RSS value to a nonobserved AP [5–7]. However, both methods fail to completely represent signal characteristics at a certain location due to the addition or deletion of some information, which ultimately affects the accuracy of fingerprint distance estimation. Clustering inefficiency: to compare multiple locations and select the one that best matches the observed signal strength, weighted K-nearest neighbors (WKNN) method is often used due to its simplicity. However, due to the inherent time-varying nature of wireless signal, K-nearest neighboring points are not always close to a user's real position. Consequently, directly using K-nearest neighbors may lead to bad estimations. To address this problem, clustered WKNN algorithms have been developed [8–13], and most of them either use c-means [10] or K-means [12] as the clustering algorithm. However, they need to prespecify the clustering number, which is unsuitable for classifying RPs whose distribution is initially unknown. In fact, ideally the cluster should have low similarity to other clusters.
In this work, we aim to tackle these two problems in Wi-Fi fingerprinting based localization method: we address the APs mismatch problem by combining AP sets similarity and RSS distance when calculating fingerprint distance and we address the clustering inefficiency issue by enhancing semi-supervised affinity propagation clustering algorithm in combination with detection of isolated points. Hence, we call the improved algorithm semi-supervised affinity propagation based WKNN (WKNN-SAP). WKNN-SAP has been implemented on a server and evaluated through real-world experiments performed in a teaching building.
The rest of this paper is organized as follows. We discuss related work in Section 2. Section 3 provides an overview of WKNN-SAP, followed by algorithm details in Section 4. Results of performance evaluation are analyzed in Section 5 and finally Section 6 concludes the paper.
2. Related Work
Research in Wi-Fi fingerprinting localization recently has been mainly focusing on how to improve the collection of signal fingerprints and how to improve localization accuracy. For fingerprint collection, various alternatives have been proposed and they include using a signal propagation model, ray-tracing [14], interpolation, and even unsupervised crowdsourcing using the inertial sensors and indoor floor plans [15]. To improve localization accuracy, researchers have adapted to heterogeneous Wi-Fi clients [16, 17], used historical tracks, and fused other positioning techniques such as PDR [18, 19] or acoustic ranging [20, 21]. In our work, we focus on two specific issues in current method: APs mismatch and clustering inefficiency.
The visible APs are often different during online and offline stages. In existing work, researchers simply select these common APs with the largest signal strength for matching [2–4] or set the corresponding RSS entity to a small value (e.g., −110 dBm) if no RSS reading is found for an AP [5–7]. In fact, these approaches either introduce some false information or omitted some useful information. Thus, they cannot accurately describe the signal characteristic of surrounding Wi-Fi environment.
Due to the time-varying nature of indoor radio propagation, received signal measurements in online stage are different from the fingerprints collected in offline stage. To eliminate this adverse impact, researchers used clustering technique to partition the neighbors into multiple clusters and the one with the most members and/or the lowest average RSS distance is chosen as delegate for calculating the position of target. Ma et al. first proposed the cluster filtered KNN (CFK) method [9], using hierarchical clustering to partition the nearest neighbors of RPs. The results show that KNN is improved when clustering technology is used. Altintas and Serif [12] improve this method by replacing hierarchical clustering with K-means to gain a higher positioning accuracy. Likewise, Sun et al. [10] developed a KNN-FCM hybrid algorithm. They use fuzzy c-means (FCM) clustering method to divide K-nearest neighbors into several clusters and one cluster is chosen to calculate user position. As a consequence, this method has better results than KNN when the distance error is less than 2 meters. However, it is difficult to specify K value for K-means and fuzzy c-means, while hierarchical clustering cannot make sure that obtained clusters achieve the greatest sum of distance between all clusters. From a different perspective, Tian and Au et al. [13, 22] both used affinity propagation to cluster fingerprints in the offline stage. First, a coarse-grained position which is normally represented by one or more clusters is estimated through clustering matching in online stage, followed by a fine-grained positioning. The disadvantage is that clustering all the RPs in offline stage takes more time, and in fact only a small part of RPs contributes to accurate positioning.
3. Algorithm Overview
Figure 1 depicts the overall flow of WKNN-SAP. We first create an offline radio map and then collect RSS vectors in real time for any point that we need its location. For each point, we calculate the AP sets similarity and the average RSS distance between this vector and all the reference points in the radio map. We then estimate fingerprint distances to all the reference points with our proposed fingerprint distance model. To get more suitable neighbors for comparison [23, 24], K-nearest neighbors are dynamically selected according to a signal distance threshold before eliminating isolated points. The neighbors are then partitioned into several clusters with semi-supervised affinity propagation (SAP) and one cluster is chosen as the delegate. The user's position is then calculated by WKNN.

Flow of WKNN-SAP.
4. Details of WKNN-SAP
4.1. Calculation of Fingerprint Distance by Combining AP Sets Similarity and RSS Distance
In the online stage of the Wi-Fi fingerprinting based localization method, trying to find an exact match of visible AP sets in the radio map constructed offline is a challenge. Several factors contribute to the differences in AP sets.
Limited coverage of an AP: scattered deployment of Wi-Fi APs at different physical locations and limited signal coverage of each AP will inevitably lead to only partial APs being visible at certain locations of indoor buildings. Signal interference: wireless signals are vulnerable to multipath and shadow effects as well as people's movement. Even performing multiple scans at the same position, visible AP sets are not always the same. Insertion or removal of Aps: some damaged APs may be removed manually, or new APs may be added into the environment, which will cause the difference of AP sets between RPs and observed signal vector.
To represent the similarity of two AP sets, we use Jaccard similarity coefficient [25]. Jaccard coefficient measures similarity between two sets and is defined as the size of the intersection divided by the size of the union of the sample sets:
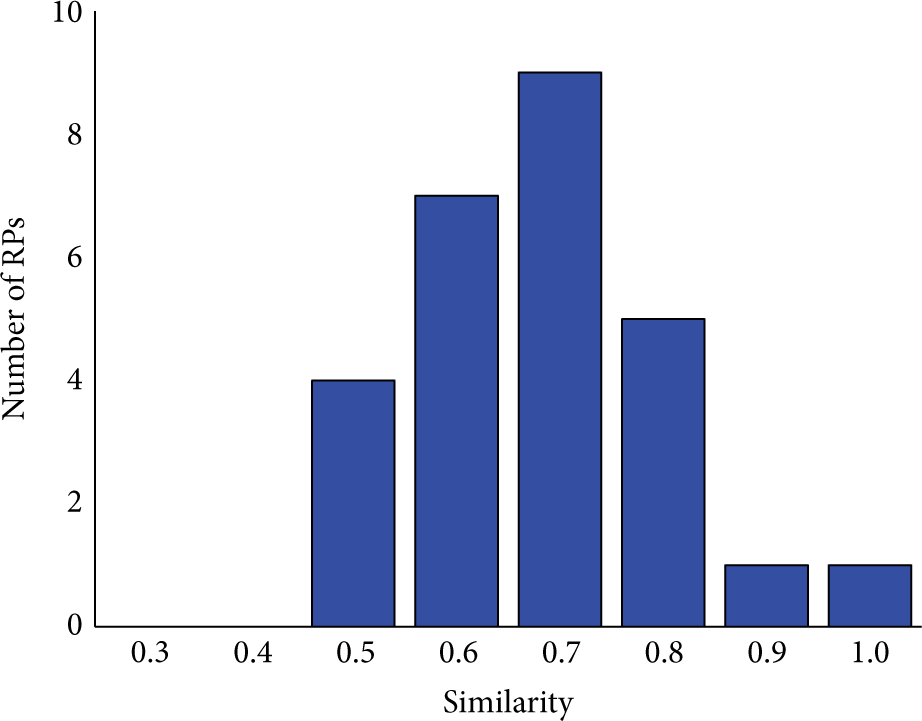
Our experiments have validated the causes of APs mismatch described above. In an area of about 30 m2, we choose an RP as the base point and calculate the Jaccard similarity of AP sets between base point and other 39 RPs. Figure 2 shows the histogram of the similarity: the number of RPs whose AP set is the same as the base point (i.e., similarity equals 1.0) is small. In other words, visible APs at different positions differ considerably, even if these positions are physically close. In addition, we conducted continuous scan at a certain position to capture multiple signal vectors and then choose one signal vector as the base point. We calculate the AP sets Jaccard similarity between base point and other signal vectors. The results in Figure 3 show that it is very rare to have the same visible APs at different times even at the same position.

Histogram of AP sets similarity at different positions.
Histogram of AP sets similarity at different times.
Using AP sets similarity or RSS distance alone to represent fingerprint distance results in undesirable outcomes: AP sets similarity only provides coarse-grained information about two reference points, while RSS distance may delete some useful signal characteristics [2–4] or add artificial information [5–7]. Therefore, we propose to combine AP sets similarity and RSS distance to calculate the distance between two fingerprints. Fingerprint is defined as
We denote RSS average distance of common APs between observation signal vector and RPs using

Typically, a small similarity of AP sets means a larger distance between two fingerprints, while a small RSS distance implies small distance between them, and vice versa. To find a reasonable model describing the relationship between the two independent variables (i.e., AP sets similarity and RSS distance) and a dependent variable (i.e., fingerprint distance), we use 1stOpt [26] to fit their linear or nonlinear relationships. 1stOpt is a set of mathematical optimization analysis software packages specializing nonlinear regression, curve fitting, and parameter estimation of misaligned complex models. This modeling problem can be described as follows: based on the AP sets similarity sim and RSS average distance of the AP intersection set, derive the real physical distance between two RPs. Therefore, we seek a function that minimizes the difference between the estimated distance and the physical distance. If the AP sets similarity and RSS distance between two reference points are 1 and 0, respectively, the estimated distance should be 0.
Based on the fitting results, we use the following model to compute fingerprint distance


4.2. Isolated Points Identification Based on Nearest Neighbors
With our proposed fingerprint distance model and a fingerprint distance threshold, we can obtain K-nearest RPs to user position. The next step is to detect and delete isolated points among these nearest RPs. An isolated point is defined as one that has very few neighboring points in physical space. The accuracy of clustering is always affected by the presence of isolated points in the data set. We design an isolated points identification algorithm that considers nearest neighbors. Assuming the training data set is
Isolated points detection works in two steps.
4.3. Cluster Neighbors Based on Semi-Supervised Affinity Propagation
After calculating the fingerprint distances between the online signal measurements and all the reference points in the fingerprint database, traditional WKNN uses the K-nearest reference points to estimate user position, where a commonly used weight c is the inverse of the RSS distance:

An example to demonstrate the effectiveness of clustering.
Different from K-means clustering algorithm that randomly selects K initial points, the main idea of affinity propagation clustering [27] is using preference to label RPs. The preference of

The pairwise similarity
The most important factor that affects the performance of affinity propagation is the similarity matrix. In other words, if the similarity matrix can accurately capture relationship among data, affinity propagation can achieve excellent clustering. We, therefore, try to modify similarity matrix in our proposed semi-supervised affinity propagation algorithm.
If two RPs are very close to each other, they should be assigned to the same cluster. We use M to denote the set of such RPs with a must-link relationship: If the sizes of the two clusters are equal, compute Otherwise, the cluster having more members will include the other point that did not belong to this cluster before.

4.4. Delegate Cluster Selection
After partitioning nearest RPs into several clusters, one cluster should be chosen as the delegate region. Previous work selects candidate cluster mainly based on the number of members in clusters [9] or the average fingerprint distance [12], and only when one criterion cannot pick out the candidate cluster, the other will be used. Our empirical findings show that depending too much on either criterion would result in large errors, so we propose a unified selection rule considering both the criteria. Given the maximum number of members of all the clusters is N, when the size of a cluster exceeds
5. Performance Evaluation
We implement WKNN-SAP and test it in real-world environments. We compare its performance against existing approaches from several different angles, including impact of isolated points removal, semi-supervised clustering, delegate cluster selection, clustering, and fingerprint distance model. We next describe our experimental setup and results.
5.1. Experimental Setup
To evaluate the performance of WKNN-SAP, we collected Wi-Fi RSS data using a Huawei C8650 smartphone on the first floor of the third teaching building of China University of Geosciences in Wuhan. The dimension of the building is

The layout of the experimental testbed.

Aruba APs deployed in classrooms.
We collected data twice, one for building the radio map and the other for testing it. The training data was collected from 160 distinct locations with 2 m spacing between each reference point. There are 30 temporal RPs and we recorded RSS values at a rate of 1 Hz for each location in the radio map. During the testing, RSS samples were collected at 77 test points with a 3 m separation. The test points were placed on and off the training points and 10 samples per location are recorded for testing. Figures 7 and 8 show the graphical user interface used for offline data collection and online positioning, respectively.

GUI for offline Wi-Fi fingerprint database construction.

GUI for online position estimation.
5.2. Experimental Results
5.2.1. Impact of Isolated Points Selection
In this experiment, we set the distance threshold value as 4 meters, which means if the distance between two points is less than 4 meters, then they are each other's nearest neighbors. Figures 9 and 10 show the positioning experiment at one test point, in which 6 initial nearest reference points are selected by using dynamical selection algorithm based on RSS threshold. As shown in Figure 9, if we do not detect the isolated points, 6 RPs are grouped into one cluster. WKNN is then used to estimate the position with the 3 nearest RPs. Figure 10 shows that after isolated points (point 3) are identified and deleted, the remaining RPs are divided into two clusters. The cluster containing RP 1, 4, and 5 has the largest number of members as well as the smallest average fingerprint distance compared to the other cluster. Therefore, this cluster is selected as the delegate, and the final estimation has been improved compared to the previous result without removing isolated points.

Result of clustering without removing isolated points.

Result of clustering after removing isolated points.
5.2.2. Impact of Semi-Supervised Clustering Based Affinity Propagation
In this experiment, we select one test point as an example and compare the performance of affinity propagation and semi-supervised affinity propagation. We define that two points satisfy the must-link relationship, only if their distance is below 2 meters. We use color and shapes to distinguish different clusters. Figure 11 shows that when using the original affinity propagation idea, points 1, 6, and 9 belong to the same cluster which is selected as the delegate due to its smaller average fingerprint distance compared to the other clusters. However, using our proposed semi-supervised affinity propagation approach, point 1 is adjusted to another cluster as shown in Figure 12. The estimated position is much closer to the actual position due to this adjustment.

Result of clustering using affinity propagation.

Result of clustering using semi-supervised affinity propagation.
5.2.3. Impact of Delegate Cluster Selection
To demonstrate how delegate cluster selection affects the position estimation, we show two results. When there is a cluster whose size exceeds

Delegate cluster selection based on cluster size.

Delegate cluster selection based on the average fingerprint distance.
5.2.4. Impact of Clustering Techniques
In this experiment, we compare WKNN-SAP with classic K-means clustering and WKNN without clustering. Four metrics are compared, including standard deviation of error, mean error, median error, and 67% CEP (circular error probability). The CEP is defined as the radius of the circle that has its center at the true location and contains the location estimates with a probability. The location error is defined as the Euclidean distance between the estimated position and the real position of the client device. For fairness, the three methods use the same fingerprint distance estimation scheme that combines AP sets similarity and signal distance, and the parameter p is set to be 1. For WKNN-SAP, we set the values of several parameters as follows: the fingerprint distance threshold of selecting the nearest neighbors is set to 0.4, which means we will choose those RPs whose fingerprint distance to the measurement of target location is at most 0.4 more than the smallest fingerprint distance. When detecting isolated points and if the physical distance between two RPs is below 4 meters, then we consider one as the nearest neighbor of the other. A pair of RPs have must-link relationship, only if the physical distance between them is less than 2 meters. As for K-means clustering, we select 13 nearest neighbors, which yields the best location accuracy in our experimental environment. WKNN-SAP and K-means use the final remaining 3 nearest RPs in the delegate cluster to calculate the position of the target. For WKKN without clustering, the 3 nearest RPs are directly used.
The number of clusters is the key factor that influences the positioning results in clustering based WKNN approach, so we vary the number of clusters for both K-means and semi-supervised affinity propagation. For K-means, the clustering number
Four error measures for different algorithms.

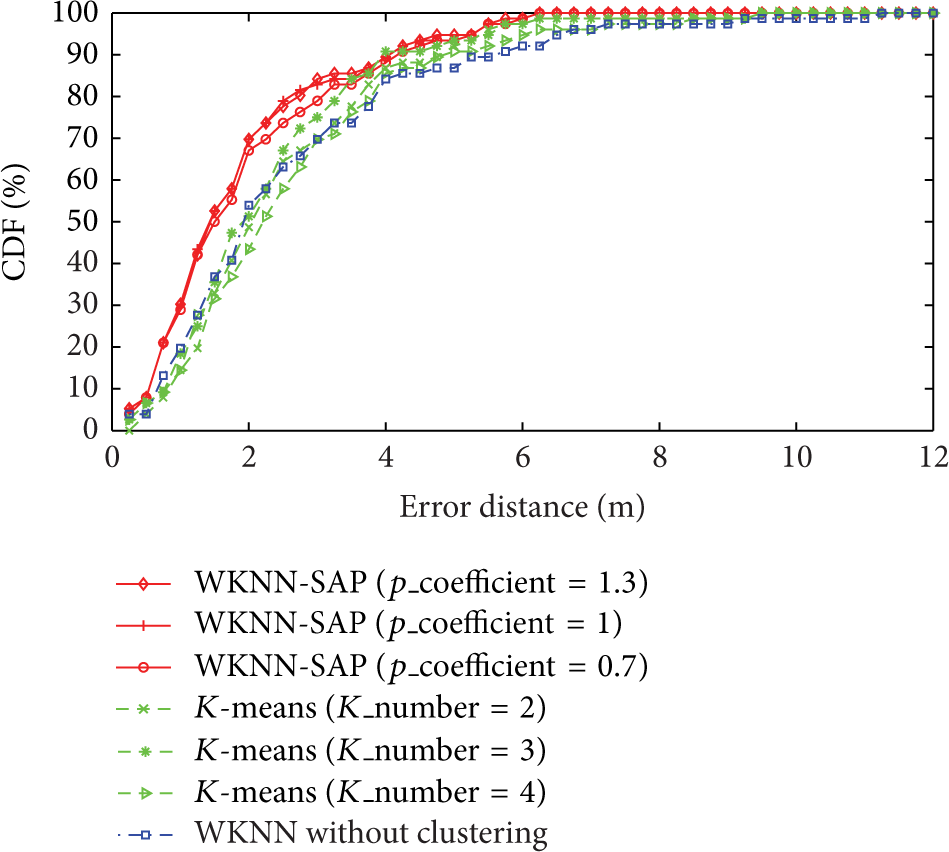
Comparison of positioning accuracy based on different clustering strategy.
5.2.5. Impact of Fingerprint Distance Estimation Techniques
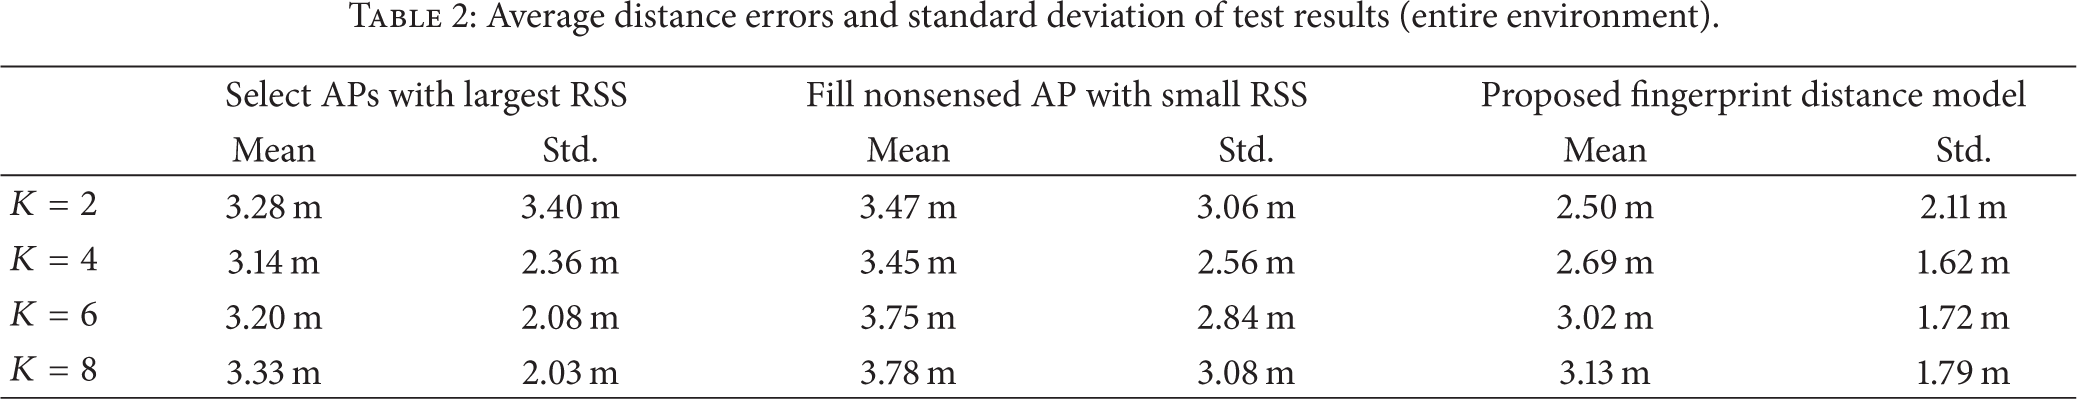
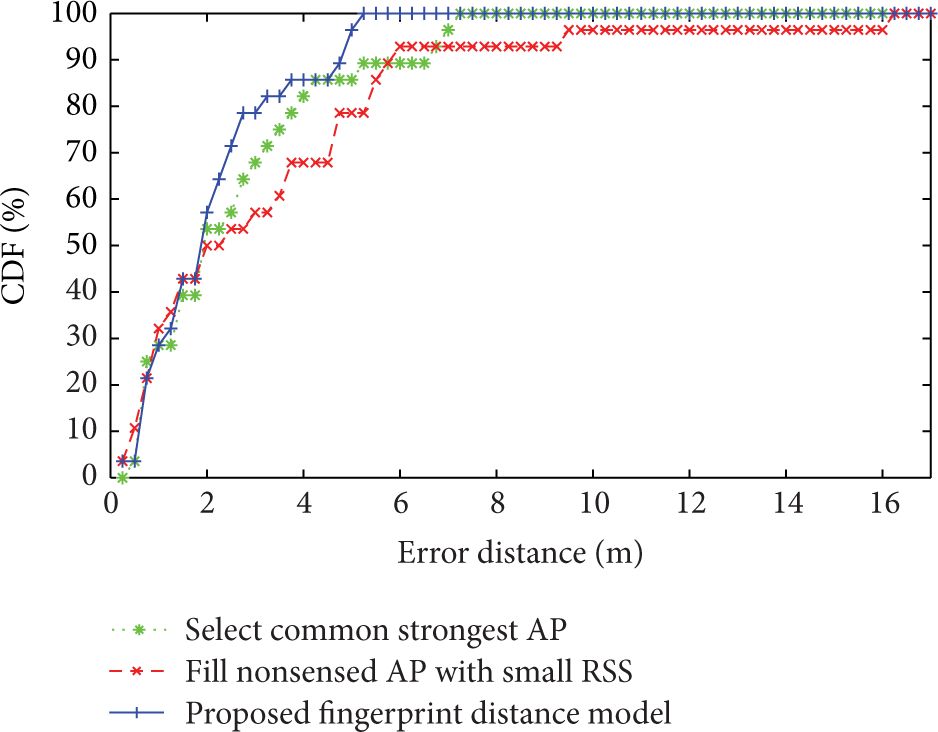
To evaluate the performance of the proposed fingerprint distance model combining AP sets similarity and average RSS distance, we compare it with traditional methods including selecting the shared APs with strongest RSS (beyond −85) and filling nonobserved AP with a small RSS value (−97). As for the proposed distance model, the parameter p is set to be 1. For fairness, three methods use the same WKNN method. K is set to be 2, and positioning result is shown in Figure 16. To consider the effect of different K values for WKNN algorithm, we test the positioning results when K is equal to 2, 4, 6, and 8, respectively. The results in Table 2 demonstrate that proposed fingerprint distance model used in WKNN-SAP provides better positioning performance compared with traditional approaches. This can be explained by the capacity of capturing the absence or appearance of APs in WKNN-SAP.
Average distance errors and standard deviation of test results (entire environment).

Comparison of positioning accuracy using different fingerprint distance models (entire environment).
In order to further evaluate the performance of the proposed fingerprint distance model in an environment with different Wi-Fi conditions, positioning results of two subspaces of the experimental environment are compared. As shown in Figure 5, the corridors outside the classrooms are divided into three parts, which have considerable difference in sensed AP sets because of the interference of walls. The other subspace is an open area located in the center of the experimental environment, and received AP sets at different locations are basically the same. We can regard this subspace as the normal Wi-Fi environment for traditional WKNN approach. The results are shown in Figures 17 and 18, respectively. We can conclude that proposed fingerprint distance model is superior to the traditional methods when the difference of AP sets is large. However, for normal Wi-Fi environment with small AP sets difference, the proposed approach achieves similar performance to the one selecting common strongest APs, which can also be derived from (3). When sim equals 1, (3) approximately evolves to the one selecting common strongest APs. This experiment shows that the proposed method can better adapt to the indoor environment with distinct AP sets, and the greater the difference is, the more superior the proposed method is to traditional methods.
Comparison of positioning accuracy using different fingerprint distance models (subspace: corridor).

Comparison of positioning accuracy using different fingerprint distance models (subspace: open area).
6. Conclusions
In this paper, we propose an improved Wi-Fi fingerprinting positioning algorithm called WKNN-SAP. WKNN-SAP centers around two major contributions. First, we propose a new fingerprint distance estimation model using AP sets similarity and RSS distance to deal with the observation that visible AP sets are often different in offline and online stages. Second, we design a semi-supervised affinity propagation clustering algorithm coupled with isolated points removal to gain a more reasonable clustering result and eliminate some outliers. Our evaluation results indicate that both SAP and K-means clustering can be used to improve the localization accuracy of traditional WKNN, while SAP outperforms K-means in both the accuracy improvement and stability because the former one is less affected by the clustering number. Moreover, proposed fingerprint distance model can better adapt to the indoor environment with distinct AP sets, and the greater the difference is, the more superior the proposed method is to traditional approaches.
As for future work, the difficulties of radio map building in the offline phase can be reduced by using calibration free radio map generation technique, such as crowdsourcing. Also, PDR (pedestrian dead reckoning) can be integrated to improve timeliness and accuracy. Last, location model based positioning technique can utilize spatial contexts (e.g., walls and obstacles) and connectivity between indoor entities (e.g., rooms and corridors) to constrain users' movement in indoor environment.
Footnotes
Conflict of Interests
The authors declare that there is no conflict of interests regarding the publication of this paper.
Acknowledgment
This work is supported by the National Natural Science Foundation of China (no. 41271440).