
Abstract
Malware remains a major threat to nowadays Internet. In this paper, we propose a DNS graph mining-based malware detection approach. A DNS graph is composed of DNS nodes, which represent server IPs, client IPs, and queried domain names in the process of DNS resolution. After the graph construction, we next transform the problem of malware detection to the graph mining task of inferring graph nodes' reputation scores using the belief propagation algorithm. The nodes with lower reputation scores are inferred as those infected by malwares with higher probability. For demonstration, we evaluate the proposed malware detection approach with real-world dataset. Our real-world dataset is collected from campus DNS servers for three months and we built a DNS graph consisting of 19,340,820 vertices and 24,277,564 edges. On the graph, we achieve a true positive rate 80.63% with a false positive rate 0.023%. With a false positive of 1.20%, the true positive rate was improved to 95.66%. We detected 88,592 hosts infected by malware or C&C servers, accounting for the percentage of 5.47% among all hosts. Meanwhile, 117,971 domains are considered to be related to malicious activities, accounting for 1.5% among all domains. The results indicate that our method is efficient and effective in detecting malwares.
1. Introduction
Malwares such as Trojans, worms, spyware, and botnets are rampant and have seriously threatened user privacy, social economy, and national security. As the key part of Internet infrastructure, DNS has been widely exploited by malicious software. The well-known IP-Flux, Domain-Flux, and DNS tunnel are those tightly related to DNS. It has become an exploding research to detect malware based on DNS technology for these years, and we highlight the reason as follows. First of all, independent of C&C protocols, DNS-based detection is very useful to detect various kinds of malwares. Second, DNS-based malware detection systems can be easily deployed onto large-scale networks because the detection cost associated with DNS is trivial compared with those based on the analysis of the entire Internet traffic. Finally, DNS-based detection is also applicable to detect malwares that encrypt their control communications.
Among those malwares that leveraged DNS, Fast-Flux has been used by botnets to build malicious content distribution networks by rapidly changing IP address [1, 2]. Domain-Flux malware can generate a large number of pseudorandom domain names in order to escape domain blacklists [3, 4]. Dietrich et al. [5] discovered and analyzed a botnet C&C based on DNS tunnel, a special DNS exploit but with a very limited number of detectable types of malwares. Overall, all of the above malware detections are dedicated to specific kinds of malwares and thus with the limitations of detecting only such kind of malwares alone.
There do exist related works utilizing machine learning methods to design a generic malware detection system. Notos [6] designed a dynamic domain reputation system based on these three features: network addresses, DNS zones, and malicious clues. EXPOSURE [7] recognizes malicious domains such as malware, phishing site, by a classification algorithm based on DNS traffic features (including query time, response content, TTL, and domain). Kopis [8] took advantage of the information of upper authoritative domain server to mine malicious domain based on the distribution of the requesters, the properties of the requesters, and the reputation of the resolvers.
In this paper, we propose a graph mining-based malware detection algorithm. Specifically, we first build the DNS graph by the relationship of domains and IPs. Next, we compute the reputation of those domains and IPs by using the belief propagation algorithm on the DNS graphs. Finally, we use the computed reputation scores to identify those malicious domains, control servers, and victim hosts infected by malware. During the above three steps, we use client IPs, domain names, and the result of domain resolution as the data source to construct DNS graph, exploit the inner relationship between IP and domain to find the homogenization relationship on DNS graph, and finally infer reputation of nodes by applying the belief propagation algorithm.
Compared with the aforementioned approaches [1–8], the malware detection approach proposed in this paper makes the following contributions. (1) The DNS graph in this paper includes both servers and clients, and thus our approach can comprehensively detect malware servers and the associated victims. (2) The DNS graph can cover all domains, and our approach has the ability to identify the overall architecture of the detected malwares.
The rest of this paper is organized as follows. In Section 2, we describe the DNS graph model. Section 3 presents the DNS graph mining algorithm. Section 4 presents the dataset, evaluation method, and the experimental results. Section 5 discusses related works. Finally, Section 6 presents our conclusion.
2. DNS Graph Model
As the base of our graph mining algorithm to detect malwares, we first describe the DNS graph model. Given a DNS graph
2.1. DNS Query Response Graph (DQRG)
By analyzing DNS traffic between clients and recursive DNS servers, we build a DNS query response graph
In the graph
2.2. Passive DNS Graph
Passive DNS graph (PDG) can be constructed using resource records of DNS response traffic or from a passive DNS database. Passive DNS [9] collects data or resource records in DNS system by monitoring DNS traffic. It is widely used in security researches. ISC (Internet Systems Consortium) and other organizations have implemented and deployed passive DNS systems. The passive DNS data do not contain client information, which may leak privacy info of users.
PDG
In order to illustrate the construction of DQRG (referred as
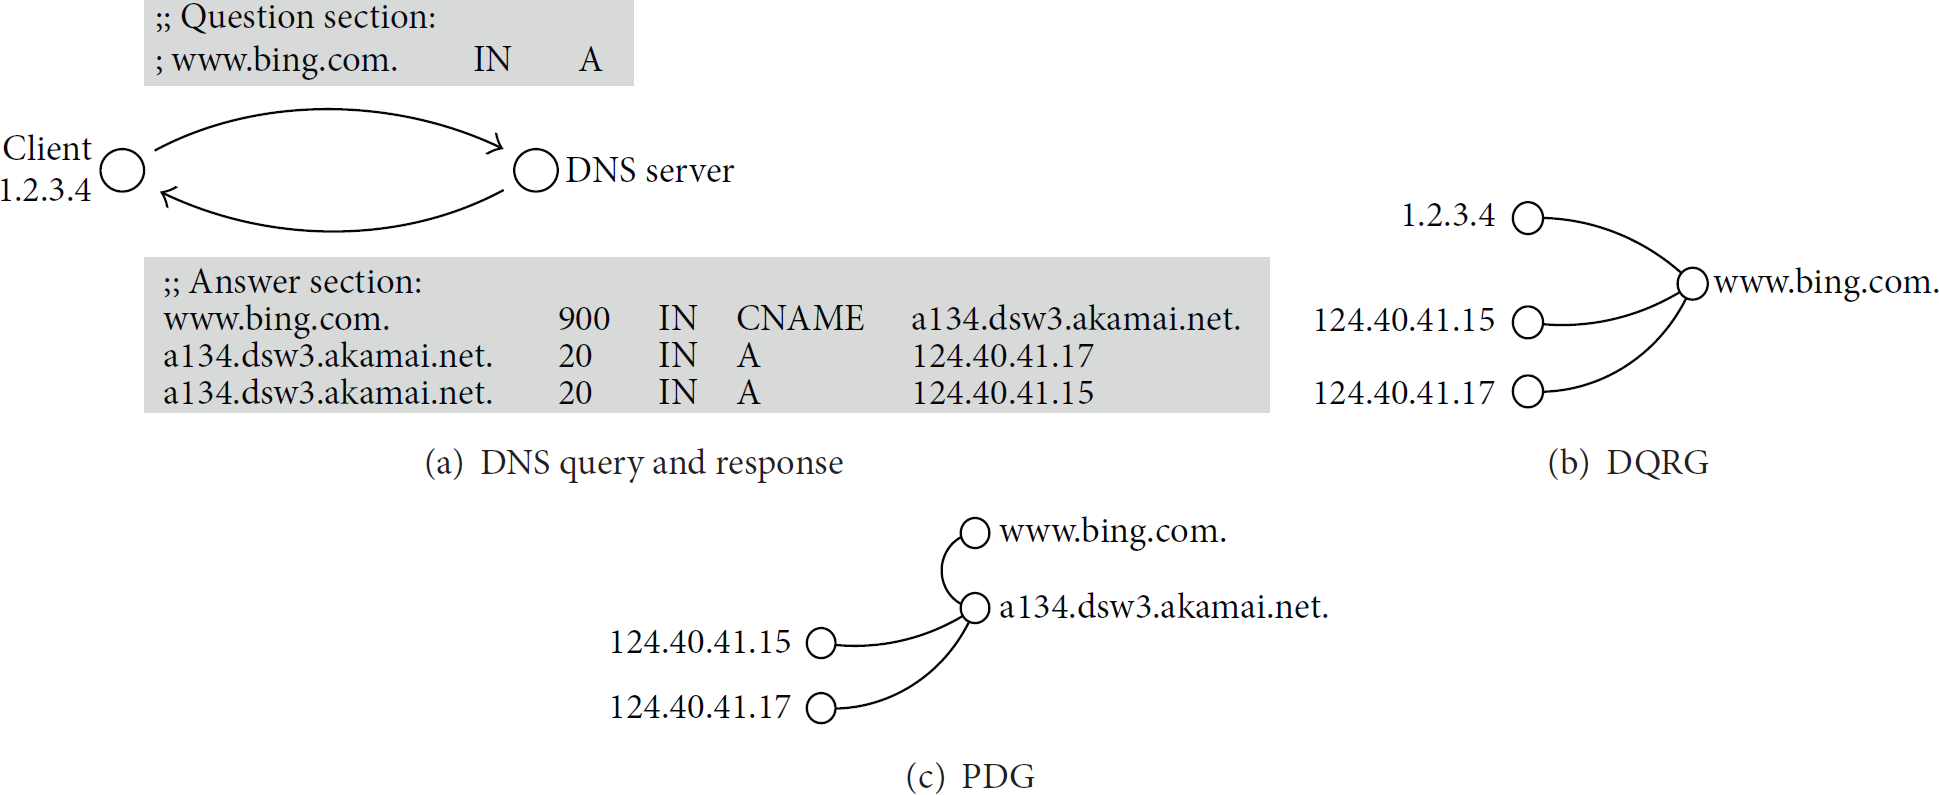
Demonstration of the construction of a DNS graph.
In
3. DNS Graph Mining Algorithm
In this section we first introduce Markov Random Field model, with the extended DNS graph marking the reputation of each node (host or domain name). On the basis of the Markov Random Field, we use the belief propagation algorithm to explore the relationship between malware host and domain name, thus conducting reputation inference of DNS graph nodes.
3.1. Markov Random Field
Markov Random Field (MRF) is a set of random variables with Markov properties described by an undirected graph. A MRF contains an undirected graph
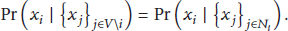
That is, the random variable
Let us apply the MRF model to DNS graph. Each vertex of DNS graph corresponds to a random variable, which represents the category of host or domain name. For malware detection, we define the label set
3.2. Belief Propagation Algorithm
Calculating the marginal probability or vertex labels described in Section 3.1 is NP-hard. The time required to calculate the reputations is exponential to the number of vertices. By heuristic method, belief propagation [11] (BP) algorithm approximately calculates marginal probability by iterative message passing, and its execution time only linearly increases with the number of vertices [12]. The BP algorithm has been widely used in artificial intelligence, image processing, and coding.
The basic idea of the message passing algorithm is that every vertex in the graph told its neighbor what it thinks its neighbors' labels are. Or, more precisely, it told its neighbors the probability of obtaining each label. Suppose that each vertex is associated with
Firstly, according to prior knowledge, the probability of each label
The principle of BP algorithm is based on message passing. The message is essentially the viewpoint of vertex i on the possibility of its neighbor vertex j holding a label


Message passing.
With this method, message delivery can be carried out in parallel on all edges. In the beginning of calculation, for all
In practice, messages need to be normalized. Otherwise, after many message delivery iterations, the value of the message will overflow or underflow (become smaller gradually and turn to “0” under the floating-point precision range). Message normalization is conducted at the vertex receiving messages:
In each iteration, the belief calculation of vertex is based on the messages received from neighbors, specifically:

BP algorithm starts with the initial belief sets which are given by the prior knowledge for some vertices; then messages are continuously iterated until the belief of the vertex is convergent (variation is less than a certain threshold) or algorithm running iterative time reach the limit.
3.3. Definition of Inferred Relationship
DNS graph provides the relation of host querying domain names and the domain name resolving to some IP addresses. By understanding the relationship among hosts infected by malware, malware domain, and C&C server, intuition tells us that the connected edge between IP address and domain name in DNS graph represents the potential homogenization laws:
Host infected by malware will proactively query malware domain, and, in general, the malware domain is only queried by the infected host. Thus, we call it relevance between infected host and malware domain. It is rare that legitimate domain will resolve to malicious IP addresses. We can just see that the IP address of malware domain is related to C&C server. We call it relevance between malware domain and C&C server. A nonmalicious domain is often associated with nonmalicious server or CDN (Content Delivery Network) service, and the CDN usually only serves legitimate websites. It is highly impossible that IP addresses of C&C server are in the range of IPs owned by a large website. Therefore, we call it relevance between nonmalicious domain and nonmalicious server.
The above laws mean that the message delivery mechanism of BP algorithm ideally suits for malware mining based on DNS graph. The purpose of mining malware is to let the infected hosts, the malicious domains, and C&C server's IP addresses have a lower reputation, in other words, have a high probability
In the BP algorithm, in order to express this homogenization relationship, we define the inference function
Obviously, it is consistent with the meaning of above three laws that the definition of inference probability matrix denotes that the adjacent nodes of the legal nodes (domain or host) are more likely to be legitimate. And the adjacent nodes of malware nodes are also more likely to be malicious. In the implementation, ε takes the smallest value

3.4. Prior Knowledge
Prior knowledge is a preset reputation
Considering the requirement of detecting malware based on DNS graph, we use the following domain and IP prior knowledge of BP algorithm.
3.4.1. Domain Prior Knowledge
Domain prior knowledge that we use contains a collection of well-known legitimate domains, a collection of known malicious domains, and domain reputation based on Alexa ranking and freely registerable subdomains.
Sources of known malicious domains include DNS-BH and MDL (Malware Domain List) and other domain lists for malicious software publicly available on the Internet, as well as those C&C domains for Zeus, Palevo, and SpyEye tracked by abuse.ch. For malicious software in China, we also use domain source like CNCERT/CC and ANVA. Malicious domain in blacklists receives an initial reputation of 0.01.
At the same time, in the experiment, we collect domain suffixes used by DDNS provider such as No-IP, DynDNS, and 3322.org, as well as ccTLDs often exploited by malware authors, as the clue of suspicious domains.
In the legitimate part, we use the Alexa ranking data as reference. Top 100 Alexa ranking domains are considered as legitimate, with initial reputation set to 0.99. For domains ranked 101 to 10,000, we set the reputation value based on their ranking using a nonlinear mapping function shown in Figure 3. The lower the ranking is, the closer the reputation is to 0.5 (the unknown state).

Alexa reputation function.
3.4.2. Host Prior Knowledge
The principle of host prior knowledge is similar to that of domains. We collect a list of known legal or malicious IP addresses for initial host reputation.
Tracking systems run by abuse.ch provide C&C IP addresses of Zeus, Palevo, and SpyEye botnets. Also, MDL provides blacklist for active malware IP addresses. DROP (Do not Route Or Peer) list by Spamhaus includes network segments hijacked or controlled by hacker groups. IP addresses on the blacklists are considered known malicious; thus, the initial reputation is set to 0.01.
OpenBL.org and Brute Force Blocker report IP addresses conducting various kinds of Internet attack. In this paper, these attackers' IP addresses are used as clues for low reputation (
In the terms of legal IP addresses, all IP segments assigned to Google and Microsoft are considered to be legal, which can be obtained from DNS SPF records.
4. Experimental Evaluation
4.1. Data Collection and Algorithm Implementation
DNS data used in this paper are extracted from mirrored traffic of 5 DNS servers in Shanghai Jiao Tong University campus network. More than 250 million DNS queries are processed by these servers daily (3000 QPS on average).
In order to build DNS graph from real-time traffic, we built a program to analyze the DNS query and response packets and store them in the form of vertices and edges into a database directly. Vertices are stored as
We monitor the traffic for 7 consecutive days to produce DQRG. By recording all the DNS queries and responses, the final DQRG has 9,335,270 vertices and 102,004,729 edges. In order to get more complete and comprehensive observation results of DNS data, we take 3 months to collect data for PDG. The resulting PDG consists of 19,340,820 vertices and 24,277,564 edges. Simply comparing it with DQRG, we can find that PDG was relatively sparse, which means that the average number of queried domains by a client machine is much higher than the number of domains mapped to a single server.
We show the statistics of the two DNS graphs in Table 1. The database size is the data size after storing in a MySQL database (does not include the index), while the graph file comprises an edge list and a vertex weight file (does not include domain name or IP address strings).
Statistics of DNS graphs.

Since the number of vertices and edges in the graph is huge, the efficiency of DNS graph mining algorithm is critical. According to the analysis in Section 3.2, the message delivery process for BP algorithm can be parallelized; we use a parallel computing framework, GraphLab [13], to implement the algorithm. The structured prediction programs contained in the GraphLab toolkit include a reference implementation of Loopy BP. The BP implementation in GraphLab divides the algorithm into three operations, Gather, Apply, and Scatter, which maps to message receiving, belief calculating, and message passing, respectively. Since GraphLab provides two types of operation for the message receiving (Sum and Max), operations of BP algorithm is done in Log-space. In Section 3.3, we use 
The machine in the experiment is equipped with two Intel Xeon E5620 processors and a total of 24 GB physical memory. Each processor has 4 cores with hyperthreading enabled, running the 2.4 GHz. The server runs 64-bit Ubuntu Linux Server, and the version of GraphLab is 2.1.4434. We run the algorithm on a single machine, using 16 threads in parallel.
4.2. Evaluation Methods
On PDG and DQRG collected in Section 4.1, first we use prior knowledge in Section 3.4 to label the vertices' initial reputation.
The statistics of the distribution of vertex reputation is shown in Table 2. 22.8% vertices in DQRG and 31.9% vertices in the PDG are covered by blacklists, whitelists, and other reputation data from Section 3.4. But only 1/4 of these vertices are in the known blacklist or whitelist (with initial reputation 0.01 or 0.99). The results show that the prior knowledge data in Section 3.4 have a desirable effect in the initialization for DNS graph. Meanwhile, more than 90% of all vertices are not in a blacklist or whitelist, on which our algorithm has positive significance in reality to detect and judge.
Initial reputation of vertices.

In the evaluation, we adopt true positives (TP) and false positives (FP) as the main evaluation metrics. To accurately evaluate the effect of the algorithm, we use 10-fold cross validation for the test. First, we randomly divide the vertices in blacklist and whitelist into ten equal pieces. Then we operate belief propagation for ten rounds. In each round, we choose one out of ten pieces as test set. To test set, we do not simply remove these vertices from DNS graph but update its initial state as 0.5 (unknown state), and then we set the threshold to distinguish between legitimate and malicious vertex and evaluate TP and FP of malware detection.
4.3. Evaluation and Analysis
The legitimate and malicious node is classified according to the calculating result of node's reputation with the selected threshold. The threshold is denoted as
The threshold is variable; therefore, detection algorithm can trade off between true positive rate and false positive rate. ROC (Receiver Operating Characteristic) curve reflects the detection effectiveness with different threshold. We draw ROC curve in Figure 4(a) for DQRG and PDG. The larger the area under ROC curve (AUC (Area Under the Curve)), the better the result. ROC curve shows that the overall effectiveness of detection on passive DNS is better than that on DQRG.

ROC curve of DNS graph mining.
With the ROC curve, under different requirements, we can balance the true positive rate and false positive rate to select the most appropriate threshold. We enlarge the top left corner of the ROC curve and show it in Figure 4(b) and mark several most ideal combinations of true positive rate and false positive rate.
For DQRG, our algorithm can achieve 78.07% true positive rate with 0.058% false positive rate (threshold
For PDG, we discuss two types of application scenarios. When our mining algorithm is used for standalone malware detection, to reduce the disturbance of false alarms, it is usually required to have a very low false positive rate. With
Vertices in DNS graph are of two types: hosts and domains. In previous experiments, we suppose they are using the same threshold. In order to investigate the difference between two types of nodes, we draw ROC curves for the domain and host nodes in DQRG and PDG separately. The result is shown in Figure 5. According to the ROC curve, the reputation evaluation of domain nodes is more accurate than that of host nodes.
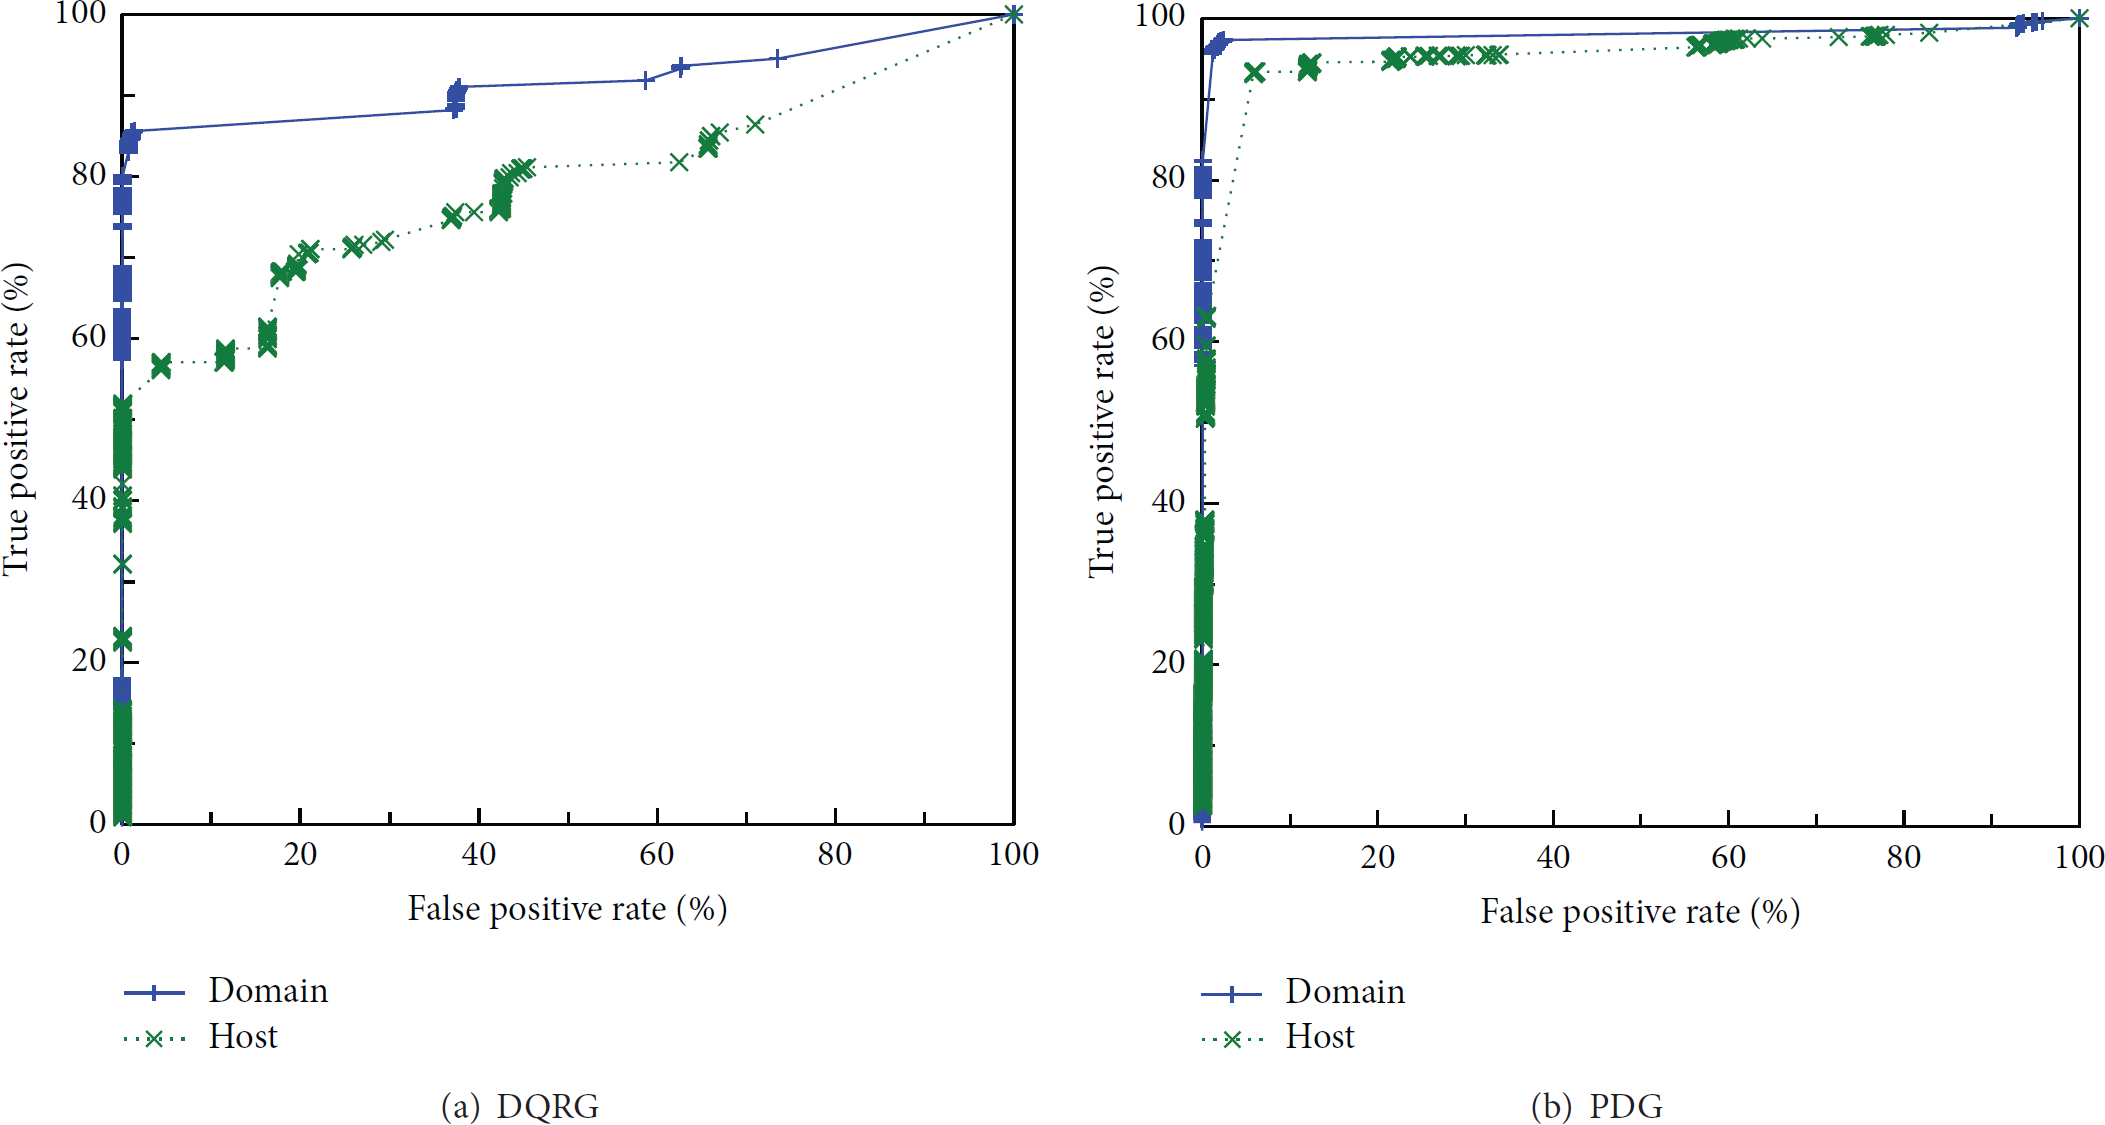
ROC curve comparison for host and domain.
We interpret these results as follows:
By analyzing false positives and false negatives, we summarize the main reason for these errors. The inferred reputation of most false alarms or misses is still 0.5 after belief propagation. It is because these nodes are not connected to any nodes that have prior knowledge. Therefore, the prior knowledge cannot affect the reputation of these nodes during message passing. As the result, reputation of these nodes remains 0.5 after the computation. This also explains, to achieve low false positive, why the threshold we selected is Comparing the difference between DQRG and PDG result, we find the cause of weaker performance on DQRG. There are a large quantities of client hosts in DQRG. Although we suppose that client host nodes in DQRG is credible, some client host nodes are faked due to IP spoofing, an attacking technic sending DNS packets with forged source IP address. As a result, it degrades the performance of DQRG. However, it would not affect the performance of PDG because there have not client host node in PDG. To overcome this shortcoming, the filtering method [16] of IP spoofing can be applied. Comparing the detection result difference between host and domain, we find out why detection of host nodes on two DNS graphs is weaker than that of domain nodes. We give the conclusion that the acquisition of prior acknowledge is an important reason. Observing the statistics of prior knowledge shown in Table 2, there is not any “good reputation” for hosts and the whitelist because IP address only includes IP segments of Microsoft and Google, an obvious small coverage, which gives rise to a great limitation on host detection. Therefore, it would effectively improve the detection performance if we expand the data source of host prior knowledge, for example, adding more IP addresses to whitelist.
4.4. Algorithm Efficiency
Since the algorithm efficiency is also an important metric, we evaluate it based on hardware environment mentioned in Section 4.1. The server used in the experiment has 16 logical processors and we maximize the parallelization to 16 threads to accelerate the calculation. The result was summarized in Table 3.
Performance test result.

The belief propagation calculation on DQRG took about 8 minutes, and the memory consumption is 21.4 GB. The calculation on PDG took less than 2 minutes, and the memory required is 10.0 GB. The result shows that our implementation of the algorithm has excellent efficiency and can be feasibly applied to much larger dataset.
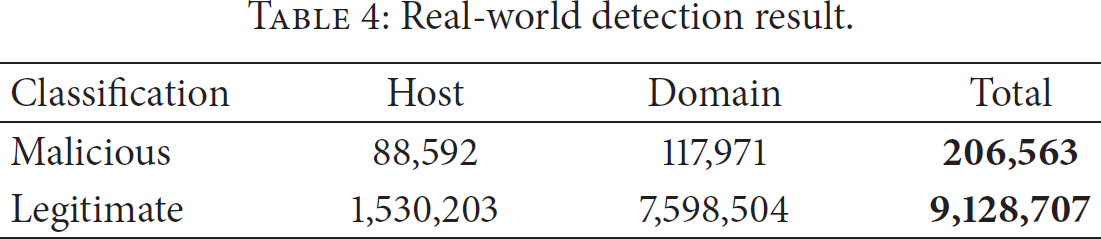
4.5. Real-World Application
The evaluation in Section 4.3 is based on the test dataset with known black and whitelist. In this section, we will use the real-world dataset described in Table 1 with all initial prior knowledge to conduct reputation inference.
First, we test actual detection effectiveness on the DQRG, which is used to evaluate the performance of reputation algorithm in real-world. We choose the DQRG because it can not only detect the malicious domains and C&C servers but also identify the client machines infected with those malware in local network, which has more significance for network administration.
According to the results in Section 4.3, we use the threshold
Real-world detection result.
We call the node that is not covered by prior knowledge “unknown node” and their initial reputation is 0.5. Figure 6 shows the reputation distribution of these unknown nodes after inference.
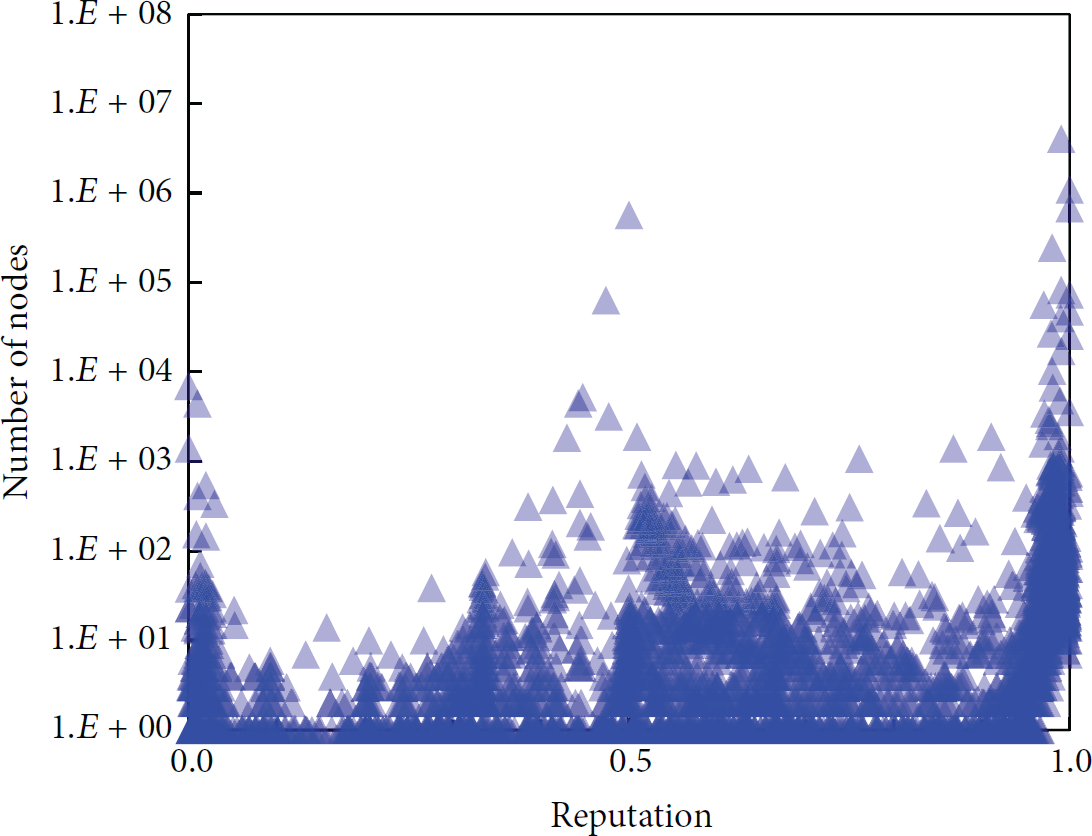
Reputation distribution of previously unknown nodes.
In the DQRG, the total number of “unknown nodes” is 7,203,945. After the reputation inference, 6,651,349 vertices (92.3%) get the reputation evaluated; namely, the reputation is no longer the initial value 0.5. The result shows that the belief propagation algorithm on DNS graph can effectively infer the reputation for most of unknown nodes.
Among these previously unknown nodes, 6,552,754 are determined as legitimate, while 98,595 are determined as malicious, accounting for 1.37% of all unknown nodes.
In real-world application, PDG is more suitable to explore the internal data structure and association of DNS system, because the PDG does not contain any client information and is constructed only with DNS resource record.
Because all host nodes in PDG are IP address from domain resolution, we can get the distribution of C&C server as shown in Figure 7. Meanwhile, domain nodes in PDG are all from valid resource records, unlike in DQRG where invalid and nonexistent domain node may exist; we can more accurately get the TLD distribution of malware domains based on the detection result on PDG, as shown in Figure 8.

Geographical distribution of malware servers.

TLD distribution of malware domains.
Also, we use GeoLite City [17] database to look up the country, city, and coordinate of IP addresses and find that the USA, China, and Russia are top 3 countries where malware servers are located. Meanwhile, some ccTLDs are often used by malware, which is consistent with our assumption in Section 3.4.1. Moreover, we found that the number of malicious domain was evenly distributed to some ccTLDs. We believe this phenomenon is due to Domain-Flux of malware, where malware authors do not register all DGA domains but just expect that at least one of them is effective so that malicious software can connect to the C&C server. Sinkholes deployed by the Internet security agencies hijacked some DGA domains such as Conficker to a specific IP address, so they can collect statistics on malware infections. For example, the Conficker sinkhole 221.8.69.25 deployed by CNCERT/CC has been associated to 3,887 random domains under.cn, and the sinkhole addresses 149.20.56.34, 149.20.56.32, and 149.20.56.33 deployed by another organization has been linked to 58,216 domains in our DNS graph.
Fast-Flux botnets make special groups in PDG. The most distinguishing feature of them is that one or more domains connecting to a large number of hosts, and hosts nodes are largely overlapped for domain names controlled by the same FFSN (Fast-Flux Service Network). As an example, one connection component in PDG has 161 domains and 938 IP addresses; however, the number of the edges between these domains and IP addresses is as much as 46,039, which means that the average number of IP address associated with each domain is 286.
We choose another FFSN with fewer nodes for visualization [18]. The result is shown in Figure 9. Apparently the objective of the malware is to host phishing or advertising website for diet pills. The reputation of those nodes is all lower than 10−9. The upper part of Figure 9 shows the relationship between malicious domains and FFSN hosts, while the lower part shows NS (Name Servers) of these domains, which clearly shows that the FFSN is a Double-Flux botnet and has IP address overlapped among NS and A records.

Visualization of a Fast-Flux service network.
5. Related Works
Several papers used graph mining techniques in network security researches. RiskRank [19] constructs graph model based on network communication among hosts, then assigns edge weight according to suspicious TCP/UDP port, and finally evaluates host risk with PageRank and HITS [20] algorithm. BotCloud [21] also constructs graph model based on IP Flow, mining P2P-botnet nodes with PageRank algorithm with prior knowledge of malicious hosts acquired with honeypots. Polonium [15] of Symantec Corp. firstly builds bipartite graphs of machine-files collected from Norton security product users and then detects malicious files with belief propagation algorithm. NetProbe [22] uses belief propagation algorithm to detect auction fraud on eBay. Our method in this paper is another exploration of graph mining for network security. We use belief propagation in a way similar to Polonium and NetProbe. However, our method is different in terms of graph construction and the application scenario. We focus on the protocol properties of DNS to dig out the potential exploit by malwares, which provides a new route to detect various types of malwares with protocol-independency.
Gao et al. [23] proposed an algorithm to detect malware domains with time correlation clustering. Its detection is based on initially known malicious domains, which is similar to our method in some ways. But our method is obviously superior where the malware domains detected by our approach do not need to have strong correlation with initially blacklisted domains. Both Notos [6] and EXPOSURE [7] focus on DNS-based malware domains detection with machine learning. They also need the initially known legitimate or malicious domains and hosts to calculate the reputation for unknown nodes. However, our method has two main differences. (1) Our method does not need to extract any domain properties but just constructs DNS graph with the relationship between host and domain. (2) Notos is based on passive DNS and EXPOSURE needs monitoring clients' queries; our method is more adaptable so it can be applied to both environments or data sources by means of PDG or DQRG. On the other hand, operation of Kopis [8] needs traffic data from large DNS service providers or TLD servers, which is a huge limitation for the common application.
6. Conclusions
In this paper, we presented the approach of mining malware domains, servers, and hosts based on DNS graph, which is scalable and effective for malware detection. We made the following contributions:
We propose the detection algorithm-based DNS graph. With two type of DNS graph representing the relationship between domains and its resolving IP addresses, we infer the reputation of graph nodes using belief propagation. Our test on real-world traffic achieves a true positive rate of 80.63% with a false positive rate as low as 0.023%. With a false positive of 1.20%, the true positive rate improves to 95.66%. The result shows that our method is an efficient and effective way for malware detection in realistic application. Our method detects not only malware domains and C&C server but also the victim clients as well. It is also easy to do statistical analysis of malware infection in different aspects, which is more insightful. With the DQRG, victim client nodes can be clearly identified, while, with the PDG, the distribution of C&C servers and TLDs of malicious domains can be figured out. Our method does not tie to a specific C&C protocol and is independent of specific DNS technique. Thus, it has a feature of good generality for detecting various types of malware. Moreover, our method can effectively find the structural information of the malwares such as DGA-malware and FFSN-malware, all in a visualized way. We evaluated our algorithm performance on real-world data collected from campus DNS servers lasting three months. We constructed a large DNS graph consisting of 19,340,820 vertices and 24,277,564 edges and the calculation on the graph only takes a few minutes. We detailed the construction of DNS graph and its' features. Furthermore, we analyzed the reason of false positive and false negative and proposed the responding countermeasures.
In summary, our experiment and positive results with this work have demonstrated one promising solution to the problem of detecting malware. Currently, we just construct DNS graph with A and CNAME resource records. In the future, we will extend the record types to include NS, MX, and PTR and so forth, so as to enhance the relationship among nodes and assess the detection effect after these improvements.
Footnotes
Conflict of Interests
The authors declare that there is no conflict of interests regarding the publication of this paper.
Acknowledgments
This work was supported by The National Key Basic Research Program (973 Program) of China (2013CB329603), National Natural Science Foundation of China (no. 61271220), and the Open Project of Shanghai Key Laboratory of Integrated Administration Technologies for Information Security. Weixiong Rao's work is partially supported by Shanghai Science and Technology Commission (15ZR1443000), IBM Faculty Award 2014, and Open Lab of 360 Inc., China.