
Abstract
A combination method of statistical filtering (SF) and the ant colony optimization (ACO) is proposed for automatic decision of optimum symptom parameters and frequency bands for machinery diagnosis. The noise of vibration signals is canceled by using SF. Similarity factor Ipq is defined to evaluate the filtering performance; the significance level α is optimized by genetic algorithms (GA). The optimum symptom parameters in different frequency bands, by which the states of rotating machinery can be sensitively distinguished, are automatically and sequentially selected by ACO based on the Mahalanobis distance between different machine states. Finally, the Mahalanobis distance is used to identify failure types based on the sequential diagnostic method. The new method proposed in this paper has been used to diagnose a centrifugal pump system for faults which often occur in the pump, such as impeller unbalance, shaft misalignment, and cavitation. The verification results of the condition diagnosis for a centrifugal pump show that the new method has good performance.
Introduction
When the vibration signal is used for condition diagnosis of rotating machinery and measured at an early stage of machine failure or at a distant location from the faulty part of the machine, the optimum decision of symptom parameters and distinction of the fault types are difficult, because the failure signal is strongly contaminated by noise. It is important to cancel the noise from the vibration signal as cleanly as possible in order to increase the sensitivity of the condition diagnosis [1–3]. For noise cancelling, many methods have been proposed, for example, band pass filter [4], adaptive filter [5], Wiener filter [6], Kalman filter [7], and so forth. However in the field of machinery diagnosis, these methods cannot always be applied to failure signal extraction, due to the following adverse conditions. Firstly, in the case of the band pass filter, the wide band noise cannot be cancelled. Secondly, when applying the adaptive filter for noise cancelling, the reference noise must be simultaneously measured with the signal. Simultaneous measurement of the reference noise is not easily realized in most cases of fault diagnosis. Finally, the noise cannot be effectively removed by the Wiener filter and Kalman filter if noise and signal do not follow the normal distribution. In order to overcome the problems above, we propose a new extraction method of the fault signal from the vibration signal measured in the abnormal state of a machine by using genetic algorithms (GA) and statistical information.
Rotating machines are used in a variety of applications. To increase the availability and safety of them, continuous and effective condition monitoring is required. Up to now, a lot of intelligent diagnosis methods were presented for this purpose. Particularly artificial neural networks, fuzzy logic, and failure tree were employed for condition monitoring and diagnosis of rotating machine [8, 9]. When an intelligent diagnosing method is used for diagnosis of plant machinery, symptom parameters are required to express the information indicated by the signal measured for diagnosing machinery faults [10]. However at present, there are few accepted methods for deciding the optimum combination of symptom parameters, by which many machine faults can be sensitively and precisely detected. In many cases, this has been done merely by trial and error.
As one of the intelligent algorithms, ant colony optimization (ACO) is tending to develop towards pattern recognition and parameter optimization domain and gaining popularity. ACO is used for optimally clustering
To sum up, in this paper the combination method of statistical filtering with GA and the ant colony optimization with Mahalanobis distance is proposed for deciding optimum symptom parameters and frequency bands automatically, and the Mahalanobis distance is used as the objective function for selecting the symptom parameter. On the other hand, in order to adapt to different failure types, the signals in different frequency bands are extracted by band pass filter before using the statistical filter (SF). The method proposed in this paper was used to diagnose a centrifugal pump system for distinguishing faults which often occur in the pump, such as impeller unbalance, shaft misalignment, and cavitation, as verifying example.
The procedure of the condition diagnosis using the proposed method is follows:
measuring vibration signals in each state; dividing the vibration signals into three bands from low frequency to high frequency, as 0 Hz~1000 Hz, 1000 Hz~5000 Hz, and 5000 Hz~25000 Hz, respectively; automatically extracting the feature spectra in each frequency band by using spectrum statistical filter and genetic algorithms (GA); calculating the value of symptom parameters in time domain and frequency domain; automatically and sequentially deciding the optimum symptom parameters and frequency bands for distinguishing each state by using ant colony optimization (ACO) and Mahalanobis distance; verifying the effectiveness of the proposed method with sequential diagnosis method and new vibration signals measured in each state.
In Section 2, the principle of the proposed method is described. Section 3 describes the experimental setup and procedures. After that, the specific experimental process and results are presented in Section 4. Finally, Section 5 states conclusions.
The Flowchart of the Proposed Method
The flowchart of the method proposed in this study is shown as Figure 1. This study used band pass filter, SF, GA, ACO, and the Mahalanobis distance for fault diagnosis through statistical feature extracted from vibration signals of normal and abnormal states. The vibration signals are acquired by accelerometers set on the examined part of the rotating machine.

Flowchart of the study.
Fault characteristics of structural failures, such as unbalance, looseness, and shaft misalignment, mostly focus on low and middle frequency areas. The characteristic frequency area of cavitation is more widely distributed than that of other faults. Resulting signals of failure brought about by self-excited and impact vibration can be found in high frequency area, such as bearing flaw and shock and rubbing. For this reason, this paper introduced a feature extraction method called multiband analysis.
Feature extraction was firstly employed by band pass filter. The signals induced by four different states were, respectively, divided into three frequency ranges from low to high, as 0 Hz~1000 Hz, 1000 Hz~5000 Hz, and 5000 Hz~25000 Hz.
Then the optimum symptom parameters in different frequency bands, by which the states of rotating machinery can be sensitively distinguished, are automatically and subsequently selected by ACO based on the Mahalanobis distance between different states.
Finally, the proposed method was used to diagnose the condition of a centrifugal pump for verifying its effectiveness.
SF is based on hypothesis testing in the frequency domain to eliminate the identical component between the reference signal and the primary signal. The basic principle is originated from significant difference testing based on statistics [18, 19]. A theoretical flow chart of the statistical filter method using GA is shown in Figure 2.

The theoretical flow chart of SF.
The primary signal
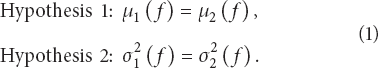
Hypothesis testing based on statistics states with the level of significance
Figure 3 shows the preparatory process of the statistics filter using GA. The statistics filter has been explained in theory, and it will be described in more detail during signal analysis. An example would be the case of an unbalanced signal. Measured normal signal and unbalanced signal can be divided into

The preparatory process of statistics filter.
In order to determine whether there is significant difference between the spectrums of normal and diagnosis state at the frequency

The specific process of hypothesis testing.
In the study, the coefficient optimization model is based on the basic theory of GA. A high value of the objective function is an indicator of the system's success. Then the optimal value of significance level α is automatically found.
Population size of GA is

Genes’ list and the encoding process.

Similarity factor 
In the early 1990s, ACO was introduced by Dorigo and his colleagues as a novel nature-inspired metaheuristic solution for TSP problems. The TSP problem can be described as the problem of finding the minimal distance in a closed tour which visits each town once. In the following parts, we will simply explain about the basic mathematical theory on ACO in solving TSP [21].
The medium used to communicate between ants is pheromone. In the feeding process, the moving ants lay some pheromone on the ground to mark the path. When other ants encounter a previously passed trail, they will detect the pheromone and decide with high probability to follow it and thus add their own pheromone on the trail. The process is thus characterized by a positive feedback loop, where the probability with which an ant chooses a path increases with the number of ants that chose the same path in the preceding steps [22]. After arriving at the food source, ants return to the nest following the same route.
Pheromone on the previously passed route will evaporate along with time. After each round, the route may change depending on the evaporations of the pheromone and the pheromone applied by the new ants. Pheromone evaporation mechanism makes the ants ignore the poor path selected before. As a result, the algorithm converging to local optimization early can be avoided.
The intensity of pheromone on path-
The transition probability for the 
The field of algorithms of the ant system can be divided into three categories determined by the way the trail is updated: ant-cycle, ant-quantity, and ant-density algorithms; the formulas are given by formulae (6)–(8) [21]. In ant-cycle model, ants lay their pheromone in the end of the round, but the other two models updated the pheromone after each step. Ant-cycle is widely used, and the other two models have been gradually eliminated.
ANT-quantity:
ANT-density:
ANT-cycle:


In this study, the evaporation coefficient
Clustering analysis is often based on the measurement of the distance between objects. The Euclidean distance and the Mahalanobis distance are the most commonly used distances. The Euclidean distance metric assumes that each feature of data point is equally important. On the other hand, the Mahalanobis distance takes into account the correlation of the data [23]. It is calculated using the inverse of the variance-covariance matrix of the reference data. These will be illustrated with a simple example in two dimensions. 

Experiment Device
Rotating machinery can be found widespread in industrial applications, which operates by means of bearings and other rotating parts [24–26]. It is well known that faults of rotating parts would cause invalidations and breakdowns of a machine. Consequently, the detection of their defects at early stage turns to be increasingly important. Centrifugal pump, one kind of rotating machinery, is used to transport fluids by the conversion energy from kinetic energy of a motor to hydrodynamic energy of the fluid flow. It is not only used as water upgrade machine but also used in food industry, plants, agriculture, oil and gas industry, paper and pulp industry, and so on. The key elements in centrifugal pump are bearing, seal, and impeller. These are exactly rotating parts and directly affect the working performance of the centrifugal pump. On another hand, the faults that are presented in pump systems are usually cavitation, leakage, impeller unbalance, and shaft misalignment. These would cause a series of troubles such as abnormal noise, high vibration, deterioration of the hydraulic performance, and pitting or erosion [27–29].
In this work, a centrifugal pump system for condition diagnosis is shown in Figure 5(a). The flow rate of pump can also be adjusted through the valve control system. The series of the motor is SF-JRO. It is employed to drive the pump through a coupling, and the rotating speed can be varied through control panel. The experimental pump made by the HONDA Company is type HAS, having output of 3.7 kW and capacity of 7.5 m3/h [30]. Five accelerometers are used to measure vibration signals for fault detection as shown in Figure 5(b). Two sensors are placed at the pump inlet, two sensors are placed at the pump outlet and the other one is placed at the pump housing. The radial direction signals of inlet are used to diagnose fault in this paper.

The experiment device: (a) the centrifugal pump system and (b) the position of the sensors.
The signals are measured at the rotation speed of 3000 rpm (rotating frequency is 50 Hz). The sampling frequency is 50 KHz, and the sampling time is about 10 seconds. Defects have been artificially introduced. The types of measured signals are the normal state and three typical faults, namely, cavitation, impeller unbalance, and shaft misalignment.
At the beginning of the experiment, the valves in the suction and delivery lines were fully opened. The valve in suction line was set at position 425. The flow in delivery line was 19 m3/h. In this condition, pump was in the best operating situation, which can be regarded as normal state. Then, the opening valve in the suction line was made to keep turning down slowly as a few bubbles appeared. In this status, the condition of the pump turned into cavitation state. With the valve in suction line having been turned down, the degree of cavitation was gradually aggravated. When the valve in suction line was set at position 375, cavitation signal used in this paper was measured. In the case of impeller unbalance, the damage areas caused by the impeller are 100 mm2. The shaft misalignment signal has the deviation of 1.0 mm.
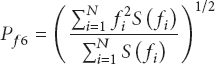
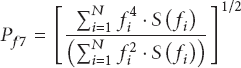
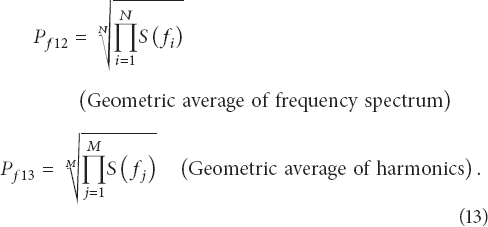
This paper used 13 symptom parameters in time domain and frequency domain. When time-domain symptom parameters and frequency-domain symptom parameters are used together, they must be nondimension parameters.
Five of them are time-domain symptom parameters, shown as formulae (11), and the remaining eight are frequency-domain symptom parameters as formulae (12) and (13). (Average characteristic frequency factor) (Average frequency in unit time) (Waveform stability index)


(Crest factor of frequency spectrum)

(Change rate of frequency spectrum)

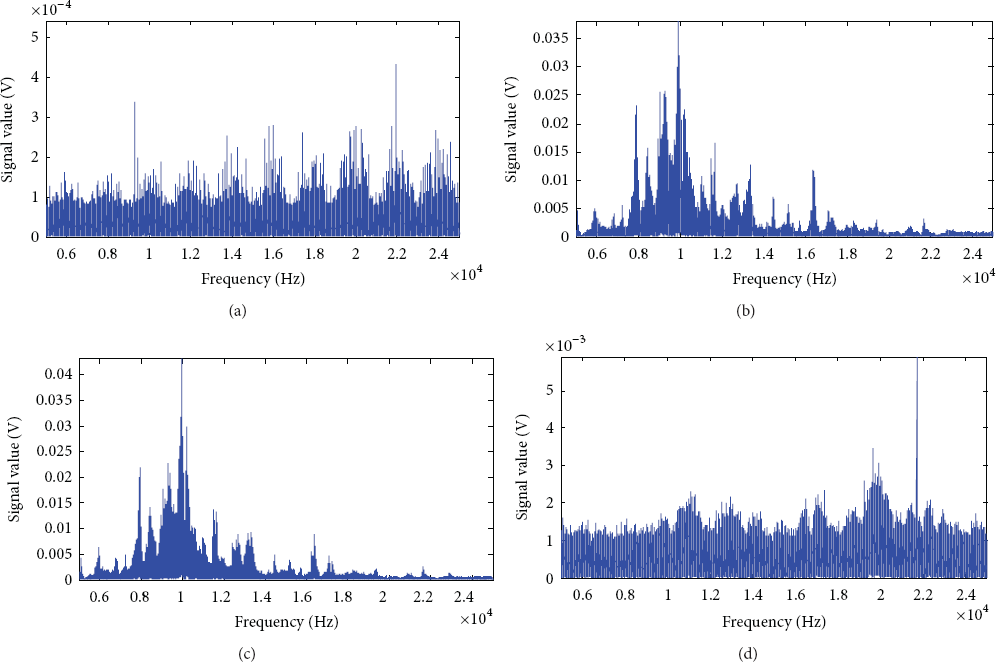
In the experiments, vibration signals in four states are measured, which are normal (N), impellers unbalance (U), shaft misalignment (M), and cavitation (C). The spectrums of raw signals are shown as Figure 6. Feature components for diagnosing each state are not obvious enough in these spectra.

The spectrums of signals before processing. (a) Normal, (b) unbalance (c) misalignment, and (d) cavitation.
It has shown that the feature frequencies of unbalance and misalignment are mostly focused on low and middle frequency bands. And the feature frequencies of cavitation may distribute widely in all frequency bands. Therefore, band pass filters of three frequency ranges were processed, respectively. The three frequency bands are 0 Hz~1000 Hz, 1000 Hz~5000 Hz, and 5000 Hz~25000 Hz. Spectra of the signals in different bands are shown as Figures 7, 8, and 9. After band pass filter was applied, the feature information obtained from the spectra was also insufficient and unclear.

The spectrum of signals in the low frequency band after band pass filter. (a) Normal, (b) unbalance, (c) misalignment, and (d) cavitation.

The spectrum of signals in the middle frequency band after band pass filter. (a) Normal, (b) unbalance (c), misalignment, and (d) cavitation.
The spectrum of signals in the high frequency band after band pass filter. (a) Normal, (b) unbalance, (c) misalignment, and (d) cavitation.
SF method requires lots of data. The larger the amount of data used, the better the performance of the filtering. But the more the data that has to be processed, the more the computing time that will be spent. This is one of the difficulties of the experiments. In this study, the computing time and filtering effect have been considered. Each part of the statistics filter data contains about 65536 points. And the total number of the parts is 6.
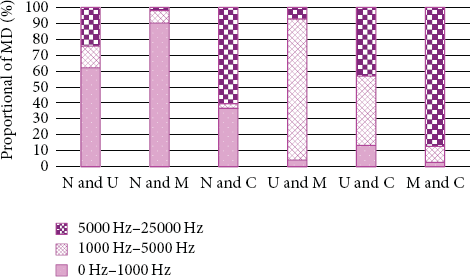
The coefficient optimization model is based on the basic theory of GA as shown in Section 2, with the population size 6, gene length 6, an iteration of 3, mutation rate 0.5, crossover rate 0.3, and random crossover point. High fitness is the indicator of the success of the system. The optimal value of significance level α is found as Table 2 in each state and frequency band.
Significance level
.
Significance level
13 nondimension symptom parameters are calculated after SF, as formulae (11) to (13).
The failure types that have to be identified are multiple, and it is hard to find one group parameter that can identify all of those types at once. However, the symptom parameters for identification of two types are relatively easy to find. Therefore, the automatic and sequential selection method of optimum symptom parameters using the ACO and Mahalanobis distance for sequential diagnosis is proposed in this paper. In the sequential diagnosis, we should distinguish only two states in one step [8].
The selecting model of optimum symptom parameters was inspired by the ACO system that used to solve the TSP. The current model is suitable under the condition that the number of selected parameters is known. But it can be improved to a variable number condition in a follow-up study. The symptom parameters selection course is considered as travel between cities. The number of the directed line segments is considered as the number of cities. And each directed line segment has its pheromone matrix whose dimension is the number of all symptom parameters. The pheromone matrix is set as a tiny number during initialization. Firstly, the machine ants randomly select symptom parameters out of the list that included all the parameters in this frequency band. Then the pheromone matrix is updated according to the Mahalanobis distance. And the symptom parameters with high pheromone are selected with larger probability during the following process. Finally, the sensitive symptom parameters are automatically selected by ACO.
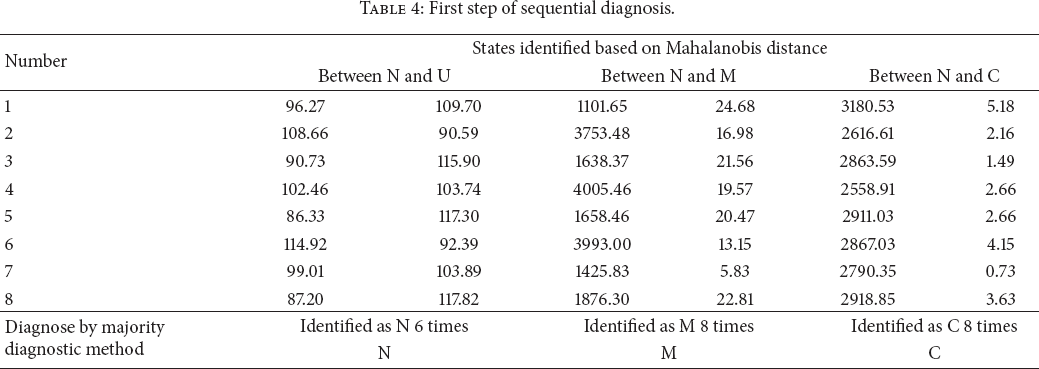
The results of selection in different frequency band are shown in Table 3. The proportional comparison figure of Mahalanobis distance between each frequency band is shown as Figure 10. The results are the same as expected beforehand. The defect information of unbalance and misalignment is mostly focused on low frequency, and cavitation leads to a relatively wide distribution in the frequency domain.
Selection results of different condition in different frequency band.

Selection results of different condition in different frequency band.
Mahalanobis distance (MD) proportional compared in different condition and different frequency band.
As shown in Figure 11, the first step of the sequential diagnosis can be used to distinguish the normal state (N) from impellers unbalance (U), shaft misalignment (M), and cavitation (C) using the sensitive symptom parameters selected by ACO. Normal state and unbalance are identified by symptom parameters [4, 5, 12, 13] in the low frequency band. Normal state and misalignment are also coincidentally identified by symptom parameters [4, 5, 12, 13] in low frequency band. Normal operation and cavitation are identified by symptom parameters [3, 6–8] in high frequency band as shown in Table 2.

Flowchart of sequential diagnosis for pump in the paper.
According to the result of first step, the second step can be used to distinguish the impellers unbalance (U) from shaft misalignment (M) and cavitation (C). Then the last step is used to distinguish shaft misalignment (M) and cavitation (C). This is the most difficult condition; if the state is identified as [U, M], [U, C], or [M, C] in the first step, then the second step is taken to judge the exact one of the two states which confirmed in the first step. The flowchart of sequential diagnosis in the paper is shown in Figure 11.
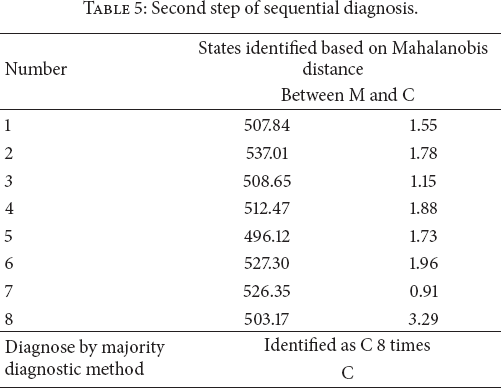
The practicality of the proposed method is verified by applying it to testing signals. The tests have shown that the algorithm is capable of detecting four different states in the centrifugal pump. The testing signal of cavitation is taken for an example. Eight vibration signal samples are used for the diagnosis. The type of testing signal will be identified as the state that the majority of sample signals belong to. In the first step, the diagnosis result is N, M, and C, as shown in Table 4. According to Figure 11, in this case, the states are identified as M and C. And the second step distinguishes between M and C. The diagnosis result of the second step is shown in Table 5. Finally, the state is identified as C.
First step of sequential diagnosis.
Second step of sequential diagnosis.
This paper presents a method combining statistical filter (SF) with GA, the ant colony optimization (ACO), and Mahalanobis distance for automatic decision of optimum symptom parameters and frequency bands, which can be effectively used in machinery diagnosis. In order to prove the effectiveness of the methods, it is applied to diagnose the condition of a centrifugal pump system. The considered fault types are cavitation, impeller unbalance, and shaft misalignment, which often occur in pump system. Because the feature information of different fault types focuses on different frequency bands, the band pass filter is processed to extract fault information roughly. The three bands are 0–1000 Hz as low frequency, 1000–5000 Hz as middle frequency, and above 5000 Hz as high frequency. The noise of vibration signals is optimally canceled by using the statistic filter (SF). In this step the similarity factor
Footnotes
The authors declare that there is no conflict of interests regarding the publication of this paper.
Acknowledgments
This project is partly supported by National Natural Science Foundation of China (Grant nos. 51375037 and 51075023), and Program for New Century Excellent Talents in University (NCET-12-0759).