
Abstract
We propose a ZigBee-based localization method that estimates the distance between ZigBee nodes employing the strength of wireless signal. It enables us to track the location of a user by means of trilateration, using the distance between fixed nodes deployed at predetermined locations and a mobile base station. In addition, we propose a method to determine the optimal placement of the fixed nodes using minimum Bayes error estimation based on Gaussian distributions. As a result, this method can accurately estimate the position of the mobile base station with a minimum number of fixed nodes.
1. Introduction
In recent decades, positioning systems such as GPS, dead reckoning techniques, and intensively installed RFID tags have been used to localize a user continuously. Although GPS localization is a popular method, it is not suitable for pedestrians since the accuracy of GPS data is relatively low (more than 10 m). Therefore, we propose a more accurate localization method using the signal strength between ZigBees, instead of GPS.
We use range-based ZigBee as landmarks and apply trilateration using wireless sensor network with those nodes to estimate the position of the user. Although arranging of the numerous landmarks improves the accuracy of localization, it increases the cost. Accordingly, we propose an efficient localization method using minimum Bayes error estimation for optimal placement by generating and modelling the signal. In order to verify the availability of the proposed method, we applied it to a guidance system for visually impaired person that was developed in our previous studies [1]. As a result, the method helps pedestrians arrive at their destination safely.
We summarize related research in Section 2. In Section 3, we describe the ZigBee-based localization method and the optimal placement of sensors in detail. In Section 4, we present the experimental results while applying the proposed method to the prototype system. Finally, we conclude our study in Section 5 and discuss future work.
2. Related Works
Localization methods can be categorized according to the underlying wireless-communication systems such as methods using Wi-Fi, ZigBee, and UWB (Ultra wideband) [2–5]. In addition, these methods are classified into several types depending on the implementation method such as Cell-ID location technique, screen analysis method, triangulation, and stochastic modelling method [6, 7].
While using Wi-Fi, it is unnecessary to install other devices and it provides position data because of the access points (APs) that have been placed for communication. However, the accuracy of the method is lower than that of other methods and it may cause more interference [8–10]. An alternative is ZigBee, which can be implemented with small-sized tags and its installation is simple. However, it requires an accurate propagation model and a detailed map [11–13]. UWB provides relatively high precision and low power consumption, but it is not suitable to be used as an outdoor landmark because it requires a large bandwidth and has a short transmission range [14, 15].
The Cell-ID location technique called the proximity method is the simplest technique for localization [16]. It determines the position of a user by checking whether that user is in a specified area called a cell. However, the cost of the method increases as the density of cells increases and the accuracy of localization depends strictly on the size of the cell. Triangulation is the most common method for localization by means of the angles from three positions to the user [17–19]. Its accuracy varies depending on existence of obstacles and the radio environment such as the reflection and refraction of radio wave. Another position estimation method is fingerprinting, which is based on a probabilistic model. It selects a large number of sample points and stores the signal characteristics of these points in a database. It estimates the position of user by searching for a sample point with similar characteristics to the signal of the user [20, 21]. This method shows the highest accuracy compared to other methods since it estimates position based on the location of the facilities as well as the orientation of the user. However, this method must acquire various signal characteristics for many sample points several times and update them whenever the location of obstacles changes. Further, searching the database is very complicated.
Our proposed method does not require many hardware devices and only uses range-based ZigBee with relatively high accuracy compared to universal ZigBee. In addition, we propose an optimal placement method based on Gaussian distribution that is able to cover the entire area with a minimum number of ZigBee nodes. Consequently, it provides exact position tracking with low cost. Furthermore, we verified that it helps persons with visual impairment to arrive at their destination safely outdoors by applying this method to a portable guidance system that we proposed previously [1].
3. A Localization via Efficient Placement of Wireless Sensors
In this section, we explain the trilateration technique for tracking the position of users and the optimal placement method of landmarks.
3.1. Localization Based on Wireless Sensor Network
Position estimation methods are categorized into range-based method that uses the distances of nodes and range-free method that uses inferred distances among neighbor nodes. We exploit the range-based method as it is regarded as being highly accurate when compared to other methods. We use SDS-TWR (symmetrical double-sided two way ranging) technique to measure the distance from the fixed node to the mobile (portable) base station [22]. We define ranging frame (frame) that means a special packet transmitted to measure the distance between two nodes. As shown in Figure 1, to measure the distance between node A and node B in the sensor network, we evaluate propagation time

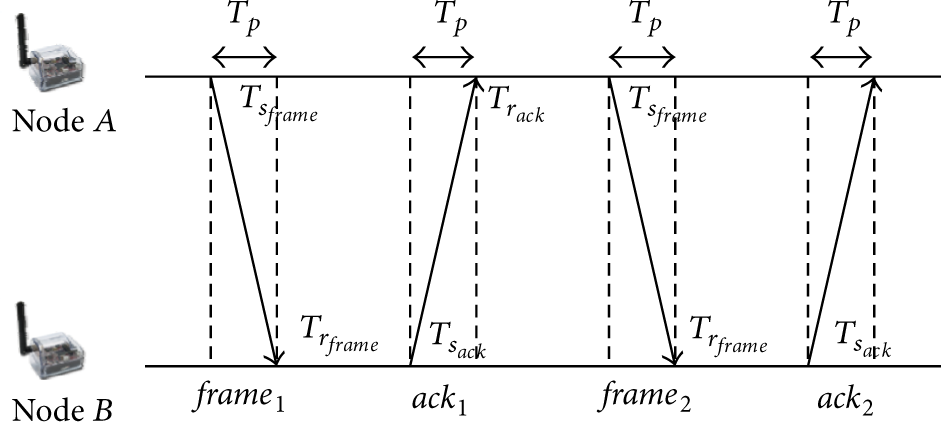
Symmetric double-sided two-way ranging (SDS-TWR) methodology.
We use a centralized star network topology since the fixed nodes only communicate with the mobile base station. After the closest three nodes from the mobile base station are selected, we perform trilateration to determine the relative position of the mobile base station. The position is measured by three fixed nodes and equations for the three circles derived from them [23]. As shown in Figure 2, the position of the mobile base station M is calculated from distances

Trilateration: location tracking of mobile base station using three fixed nodes.
We use a grid-based map building method that can be implemented easily in order to estimate the location of the user [24]. The map building for visually impaired person is required for accurate modeling of hazardous objects in surrounded environment. As shown in Figure 3, we have implemented the map authoring tool. It enables us to display detail information such as position of the fixed nodes, departure point, destination, POI (point of interest), and obstacles.

An example scene of the map authoring tool.
Figure 4 shows the concept of the proposed localization method. The fixed nodes used as outdoor landmark are installed by applying Bayes error estimation (see Section 3.2). Map database presents the position coordinate and ID (identification) of fixed nodes. Localization of mobile base station is estimated by means of trilateration and map building method.

Localization concept: (a) layout of replaced ZigBees to be served as POIs, (b) a map indicating POIs and obstacles, (c) trilateration method using adjacent three ZigBees of user, and (d) localization algorithm to estimate position of user.
3.2. Optimal Placement Based on Minimum Bayes Error Estimation
In order to estimate the position of the user accurately with a minimum number of fixed nodes, we use minimum Bayes error estimation based on Bayesian decision theory with Gaussian distribution. We virtually arrange fixed nodes densely on all possible paths. The method finds the layout with maximization of cumulative minimum Bayes error (MCMB) by sequentially removing the node with a maximum error at each stage.
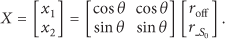
We generate a signal so as to reflect the characteristics that strength of ZigBee signal decreases depending on the distance. We consider simulated signals from an ith ZigBee node as a bivariate Gaussian distribution that is modelled by parameter with N (M, Σ), as shown in Figure 5(b). The signal is circularly radiated with the given distribution as described in Figure 5(c), which can be applied to the Bayes error estimation method to measure optimal displacement. As depicted in Figure 5(a), the signal range of a node in polar coordinates is defined as a circle with radius r as follows:


Signal generating simulation: (a) signal generation in polar coordinates, (b) signal model based on the Gaussian distribution, and (c) signal simulation for the MCMB.
The signal consists of m concentric circles with offset

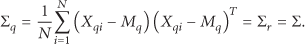
In this case, the covariance matrix is denoted by Σ because we use homogeneous modules with no constraints in each node and hence the values of
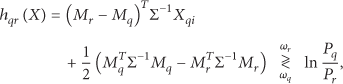
Equation (4) satisfies the minimum Bayes error criterion to determine the decision boundary between the signal points from two nodes. As shown in Figure 6(a), the example case of the signal points of two nodes are represented by the classes,

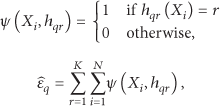

Decision boundary for estimating minimum Bayes error in one-dimension (a) and two-dimension with a linear decision boundary when
The MCMB is determined by detecting node which has maximum

An example of optimal nodes selections for trilateration: (a) the signal points of nodes and (b) the signal range boundary of nodes.
4. Experimental Results
4.1. Accuracy Estimation Using Range-Based ZigBee
We carried out experiments with two different types of ZigBee modules to verify of the effectiveness of the proposed method. One module measures the distance by means of the SDS-TWR method (NanoLOC), and the other calculates the distance using only the RSSI (received signal strength indicator) value (Xbee). Xbee requires additional computation to convert the signal strength to distance. NanoLOC measures the distance using the difference of signal transmission time. Figure 8 shows the accuracy of the distances measured with the two types of modules. The horizontal axis represents the actual distance and the vertical axis displays the distance measured by the modules. Xbee shows a larger error than NanoLOC, as the RSSI signal is susceptible to interference from other signals. The accuracy of NanoLOC is much better than that of Xbee even though it does not use additional filtering operations.

Distance accuracy comparison between the two modules: the horizontal axis represents the measured distance by the module and the vertical axis represents the actual distance.
4.2. Analysis of Factors Influencing Sensor Placement
For accurate localization with minimal cost, we determine the factors that affect the accuracy of localization and evaluate how much each factor influences the accuracy. We select the factors as the sampling rate of the fixed node and the interval between consecutive nodes.
The first factor to have a strong influence on localization accuracy is the sampling rate of the node. In order to measure the accuracy with respect to the sampling rate, we set the sampling rate as manipulated factor and other variables as controlled factors. Specifically, we fix the interval of nodes as 20 m and the number of nodes is not considered since it does not affect sampling rate.
Table 1 shows the accuracy of distance measurement and signal loss depending on the sampling rate. We analyze 300, 600, 1200, 1500, and 3000 output data while changing the sampling rate to 10, 20, 40, 50, and 100 Hz during the 30 seconds. Signal loss is the percentage of lost data from the total sampled data at specific sampling rate. Accuracy is the ratio of error between the actual distance and the measured distance including lost data. In these experiments, maximum error bound is set to within
Comparison of distance accuracy according to sampling rate.

Determining the distance between nodes is very important for the optimal placement. In these experiments, the distance between nodes is selected as the second factor for evaluation. In order to determine the signal coverage of the module, the distance between nodes is set to manipulated factor and the sampling rate of node is set to controlled factor which is determined by previous experiments.
To evaluate the accuracy with respect to the distance between nodes, we measure the data while arranging the node at regular intervals in a location where the interference of other signals is minimized. The error rate in this experiment is the percentage of erroneous data to total received data. We regard a data as an error when it is greater than 1 m which is tolerable distance in consideration of walking speed. Rate of signal loss is the percentage of lost data during a span of time.
Figure 9 shows the error and loss rates of the received data with respect to the distance between the two nodes. We analyze the result for 1200 packets acquired from one node installed per unit distance, which is measured for 30 seconds at 40 Hz (optimal sampling rate determined in the previous experiment) in simulation. The results show that there are no error packets until the distance becomes greater than 40 m, as shown in Figure 10. Furthermore, the results show that the data loss linearly increases with the increase of the distance between the two nodes. We determine that optimal distance between the two nodes is about 40 m, which is the maximum distance without erroneous data with minimum cost. The data loss rate at 40 m is about 25%, but this does not influence the accuracy of trilateration considering the sampling rate and walking speed.

Error and data loss rates according to the distance between nodes.

Example of testbed: 2D map (a) and LANDSAT image (b).
We select two factors to analyze the characteristics of range-based ZigBee module by performing a heuristic approach based on statistical analysis. We can find the optimal placement with experiments on the basis of these two factors even if the ZigBee is changed.
4.3. Optimal Placement Using Proposed Method
To find the optimal placement of nodes, we virtually arrange them with the determined factors which are described in the previous subsection. The experiment is performed in a 600 × 500 m area that includes a pedestrian road, as shown in Figure 10. We assign 52 POIs (red points) and 9500 candidate locations where the nodes can be replaced.
Table 2 shows the results of cost savings and rate of unreached area in accordance with MCMB. The cost saving means the percentage of optimal nodes in total nodes (9500). The rate of unreached area represents the percentage of the area where the signal has not reached. The number of optimal nodes is determined according to MCMB. We arrange 9500 nodes in order to cover entire region.
Cost saving and rate of unreached area dependence on MCMB.

As shown in Table 2, the minimum number of nodes for trilateration is increased as MCMB is increased. When MCMB is more than 2.0, the number of optimal nodes rapidly grows and cost saving is significantly reduced. The unreached area rate has decreased by increasing MCMB. If MCMB is more than 2.0, rate of unreached area becomes less than 1%. Based on the experimental results, we determine optimal MCMB as 2.0 in consideration of the cost and unreached area rate.
To verify the availability, we implemented an overlapping area estimation method and compared it with our method. The overlapping area method selects the minimum number of nodes required for trilateration by sequentially removing the node with the largest overlapping area. The sum of the overlapping area means the total area overlapped by other adjacent ZigBees, and an RN represents the node with maximum sum. In (9), 
The optimal placement method consists of two steps. In optimization step, the proposed method determines an RNC (removable node candidate). In verification step, the RN is decided after we determine whether the RNC is required for trilateration (see Algorithm 1).
sortedList ← sortByBayesError() sortedList ← sortByOverlapArea() stopFlag ← true remove the indexed node flag ← false save all nodes in the output image
after the indexed node is removed threshold ← the maximum value that can reliably measure distance by ZigBee node tempNode ← indexed node returnValue ← true remove the indexed node in the sortedList d← distance between the current position and node count++ returnValue ← false add the tempNode in the sortedList
Table 3 shows the results of the two methods. The minimum number of nodes for trilateration was determined to be 76 nodes by our method and 112 by the overlapping area estimation method. The cost saved by the proposed method is up to 99.20% and the cost saved by overlapping area method is 98.82% at most. In addition, the unreached area rate shows that the proposed method is 0.17% and overlapping area method is as high as 6.74%.
Optimal number of ZigBee nodes using two methods.

Figure 11 shows the optimal placement of nodes using both methods. The placement of nodes that is determined by the proposed method is displayed as black points and the arrangement of nodes using the overlapping area method is indicated as both the white and black points. The overlapping area method requires more nodes and shows high unreached area rate in comparison to the proposed method, as shown in Figure 11. Therefore, the proposed method can achieve an efficient localization over an area with a smaller number of nodes as well as save significant amounts of cost and time.

Optimal placement of ZigBee nodes using proposed method: POIs are presented as red points, the placements of nodes determined by the proposed method are displayed as black points, and the arrangement of nodes determined by the overlapping area method is indicated as white and black points.
4.4. Localization Success Rate According to Interference
We have evaluated success rate of localization according to the rate of interference signals such as Wi-Fi. We measure success rate of arriving at the destination with four persons by using the proposed method. The interference rate is measured to relative interference strength by the number of access points (APs) of the Wi-Fi with the same frequency [27].
As shown in Table 4, the success rate is lower than 8% in places such as building with many Wi-Fi or other interference signal. In spots such as parks and playgrounds, the success rate presents as higher than 95% since other interference signal is less than 10% in the place. As a result, users can arrive at the destination if there is rarely an interference signal having same frequency band.
Experiments' relative comparison of success rate according to interference signal.

5. Conclusions
We proposed a localization method using the range-based ZigBee node. The ZigBee nodes were arranged at known places, and the position of a user with a mobile base station was accurately estimated by means of trilateration. In addition, we proposed a method of optimal placement of fixed nodes by applying Bayes error estimation based on Gaussian distributions. We verified the effectiveness of the proposed method that estimates the position of a user with high accuracy using a minimum number of fixed nodes.
Footnotes
Conflict of Interests
The authors declare that there is no conflict of interests regarding the publication of this paper.
Acknowledgments
This research was supported by Next-Generation Information Computing Development Program through the National Research Foundation of Korea (NRF) funded by the Ministry of Science, ICT and Future Planning (no. 2012M3C4A7032781). This work was supported by the Inha University Research Grant.