
Abstract
In reality, the cumulative effect of the many uncertainties in engine component performance may stack up to affect the engine overall performance. This paper aims to quantify the impact of uncertainty in engine component performance on the overall performance of a turboshaft engine based on Monte-Carlo probabilistic design method. A novel probabilistic model of turboshaft engine, consisting of a Monte-Carlo simulation generator, a traditional nonlinear turboshaft engine model, and a probability statistical model, was implemented to predict this impact. One of the fundamental results shown herein is that uncertainty in component performance has a significant impact on the engine overall performance prediction. This paper also shows that, taking into consideration the uncertainties in component performance, the turbine entry temperature and overall pressure ratio based on the probabilistic design method should increase by 0.76% and 8.33%, respectively, compared with the ones of deterministic design method. The comparison shows that the probabilistic approach provides a more credible and reliable way to assign the design space for a target engine overall performance.
1. Introduction
With the development of military and civil aircraft, the aeroengine users put forward severer and higher requirements for the aeroengine overall performance [1]. The users expect the aeroengine to have not only larger thrust, higher thrust-weight ratio, and lower specific fuel consumption, but also higher reliability, longer life, and lighter weight. However, there are many disadvantageous factors affecting the realization of these requirements. One of the most important factors is the uncertainty inevitably existing in the actual performance of each engine component compared with the theoretical design values, due to the uncertainties in manufacturing and assembly tolerances. Then the uncertainties in component performance ultimately lead to the uncertainties in the aeroengine overall performance. Another important factor is that the aeroengine may sometimes suffer uncertain fouling, erosion, damage, abrasion, and other problems during operation (fouling is caused by the adherence of particles to airfoils and annulus surfaces. The adherence is caused by oil or water mists. Erosion is the abrasive removal of material from the flow path by hard particles impinging on flow surfaces. Damage is often caused by large foreign objects striking the flow path components. Abrasion is caused when a rotating surface rubs on a stationary surface) [2–7]. These problems can not only lead to the uncertainties in component performance but also contribute to the deterioration of each component performance and eventually cause the uncertainties in aeroengine overall performance.
Actual experiments can predict the effects of the uncertainties in component performance on the uncertainties in the aeroengine overall performance parameters and give the proper component design margins. However, these experiments, being complex, will take a long period of time with low efficiency and high costs. Comparatively, the advantages of numerical simulation experiments are apparent. It can shorten the experimental period, improve the efficiency, simplify the procedures, and reduce the cost. Meanwhile, the design failure can be detected in advance in the stage of an aeroengine concept design. However, it is a sophisticated process to establish an accurate uncertainty aeroengine simulation model. The aeroengine simulation models currently used are deterministic and the estimates of uncertainties in component performances are achieved by introducing design margins based on hard-won experience in the stage of aeroengine concept design [8–10]. Sometimes, the margins may be either too small or too large, leading to either the dissatisfaction of the aeroengine overall performance targets or the waste of engine potential performance. Hence, the current aeroengine simulation models cannot meet the requirements of numerical simulation experiments. Therefore, to make the most of the component performance margins, some researchers applied the probabilistic design method to the procedure of researching and manufacturing engines. Wu et al. summarized the research mentality of reliability probabilistic design method in [11–13] and utilized the established nonlinear aeroengine model based on the probabilistic method to investigate the impact of the uncertainties in component performance on the commercial aeroengine overall performance. The results provided the criterion of cycle parameters selection and component performance margin design [8, 9]. Moreover, Tong took advantage of the probabilistic design method to assess the wave rotor-enhanced turbofan engine performance, especially the net thrust, specific fuel consumption, and engine weight [14]. In the assessing process, Tong quantified the relationships between the component efficiencies, mechanical design variables, and engine overall performance parameters [14]. However, from the literature stated above, the difference of engine cycle selection between the probabilistic method and deterministic method cannot be told.
This paper conducted a further investigation of the probabilistic method applied to the overall performance of a turboshaft engine and made a comparison with the deterministic method.
The investigation contained the following steps.
Establish a nonlinear turboshaft engine model based on Monte-Carlo probabilistic design method.
Analyze the effect of uncertainties in component performance on the mean and standard deviation of the engine overall performance parameters and provided the proper sample capacity of the Monte-Carlo simulation.
Quantify the impact of uncertainties in component performance on the turboshaft engine overall performance.
Study the influences of different standard deviations of component performance distributions and different deterioration ranges of component performance on the turboshaft engine overall performance.
Compare the probabilistic design method with the deterministic design method with respect to the effects of cycle parameters selection on the turboshaft engine overall performance.
2. Object and Hypothesis
The object of this study is a certain turboshaft engine consisting of an inlet, a combined compressor, a burner, a gas turbine, and a power turbine. Its configuration is shown in Figure 1.

Turboshaft engine configuration.
In this paper, the combined compressor, burner, gas turbine, and power turbine are selected as the main research components. The turboshaft engine overall performance parameters merely include the output power of the power turbine and the specific fuel consumption (SFC). To obtain the uncertain component efficiency values, the design-point efficiencies of these components are assumed to obey the normal distributions. The assumed values of the mean and standard deviation of the component design-point efficiencies are shown in Table 1. The design turbine inlet total temperature of the turboshaft engine is 1,650 K and the overall pressure ratio (OPR) is 18. The target of the output power and the specific fuel consumption are, respectively, 1891. kW and 0.256 kg/kW/h from the computed results in accordance with the design value of the component efficiencies and the design cycle parameters.
Means and standard deviations of design-point component efficiencies.

3. Monte-Carlo Probabilistic Design Method
The Monte-Carlo probabilistic design method in this paper consists of the Monte-Carlo simulation method and the probability statistical method.
3.1. Monte-Carlo Simulation Method
Monte-Carlo simulation method, also called statistical experimental method, differs from the determined numerical method in that it is an idea of solving mathematical problems by the simulation of random variables. In this study, the Box and Muller algorithm theory [15, 16] was used to generate random variables following normal distributions. Moreover, in order to avoid calling the trigonometric functions of C++ language and improve the computing speed, the simplified Box and Muller algorithm was utilized. The Box and Muller algorithm theory is briefly expressed as

where U1 and U2 are independent random numbers, uniformly distributed in interval (0, 1), and then (Z1, Z2) will be a pair of independent random variables from the standard normal distribution (mean 0 and variance 1). The means of getting uniformly distributed random numbers U1 and U2 from interval (0, 1) is like capturing random dots from the unit square. However, suppose that, instead of picking uniformly distributed U1 and U2 in the unit square, we instead pick X1 and X2 as the ordinate and abscissa of a random point inside the unit circle around the origin [17]. Then the sum of their squares is

which is uniformly distributed and can be used for U1, while the angle that (X1, X2) defines with respect to the X1 axis can serve as the random angle 2πU2. The cosine and sine in (1) can now be presented as

Of course, they avoid calling the trigonometric functions and improve the computing speed.
The method described above is called the simplified Box and Muller algorithm and only one of the two standard normal random numbers is used to generate the normal distribution (mean μ and variance σ) utilizing the following equation in this paper. The equation can be expressed as

where N is a normal distributed random variable with mean μ and variance σ. X is a standard normal random variable produced by the simplified Box and Muller algorithm.
3.2. Probability Statistical Method
The probability statistical method is utilized to analyze the effects of uncertainties in component performance on the mean and standard deviation of the engine overall performance parameters and determine the proper simulation sample capacity. The detailed statistics formulations used in this paper are expressed as
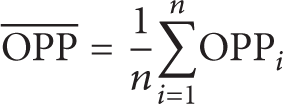

where
The objectives of (5) and (6) are to analyze the effects of uncertainties in component performance on the mean and standard deviation of the engine overall performance parameters and determine the proper simulation sample capacity via the stability of the values of
4. Nonlinear Turboshaft Engine Model Based on Monte-Carlo Probabilistic Design Method
The nonlinear turboshaft engine model based on the Monte-Carlo probabilistic design method consists of a Monte-Carlo simulation generator, a nonlinear turboshaft engine model, and a probability statistical model. The Monte-Carlo simulation generator is based on the Monte-Carlo simulation method. The nonlinear turboshaft engine model is developed at the School of Energy and Power Engineering, Beihang University [18–23], which has been verified by the turboshaft engine operation data and is used to simulate the turboshaft engine overall performance parameters in this paper. The probability statistical model is based on the probability statistical method mentioned in the above section. The data process flowchart and the program flow diagram of the nonlinear turboshaft engine model based on Monte-Carlo probabilistic design method are demonstrated, respectively, in the next part.
The basic data process flowchart of the model is shown in Figure 2. The Monte-Carlo simulation generator first generates values for certain design-point component efficiencies according to a set of user-defined input distributions whose values are passed to the nonlinear turboshaft engine model. The engine model then computes the target performance parameters (output power and specific fuel consumption) and the target performance parameters are then delivered to the probability statistical model. The probability statistical model will compute the mean and standard deviation of the engine overall performance parameters and collect the frequency of the computed engine overall performance parameters greater than the standard. Finally, the probabilities of the overall performance parameters meeting the targets will be calculated and the results will be exported in the specified file.

Data process flowchart of the model.
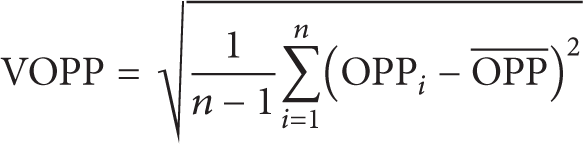
The program flow diagram of the model is shown in Figure 3. The program flow diagram corresponds to the data process flowchart. In the flow diagram, the computed value means the target performance parameter (output power or specific fuel consumption) simulated by the nonlinear turboshaft engine model. The loop times of the program are controlled by the number of simulations. When the number of simulations is greater than the set value, the program will stop computing and export the results into the specified file. The proper set value is determined by the variation characteristics of the mean and standard deviation of the engine overall performance parameters. If the variations tend to be gradual and the values of the mean and standard deviation of the engine overall performance parameters remain to be fixed, the instantaneous number of simulations is the proper set value.
Program flow diagram of the model.
5. Results
The detailed computed results are demonstrated and analyzed in this section. Firstly, the analysis of the effects of uncertainties in component performance on the mean and standard deviation of the turboshaft engine overall performance parameters is presented and the proper sample capacity of the Monte-Carlo simulation is also determined according to the analysis. Secondly, the quantification relationships between the uncertainties in component performance and the turboshaft engine overall performance are provided. Thirdly, the influences of different standard deviations of component performance distributions and different deterioration ranges of component performance on the turboshaft engine overall performance parameters are shown. Finally, the distinction between the probabilistic design method and the deterministic design method is discussed in accordance with the effects of cycle parameters selection on the turboshaft engine overall performance.
5.1. The Effects of the Uncertainties in Component Performance on the Mean and Standard Deviation of the Turboshaft Engine Overall Performance Parameters
5.1.1. The Variation Characteristics of the Mean and Standard Deviation of the Turboshaft Engine Overall Performance Parameters along with the Sample Capacity of the Monte-Carlo Simulation
The random component performance parameters are generated in the process of Monte-Carlo simulation, while the sample capacity determines the computational accuracy and speed. The larger the sample capacity is, the more accurate the computing is and the longer the computing time will be. In order to guarantee the computational accuracy and reduce the computational time, the variation characteristics of the mean and standard deviation of the turboshaft engine overall performance parameters along with the selected sample capacity are presented. The ultimate sample capacity depends on the tendency of the variations. The standard deviations of component performance distributions are assumed as 1% in this research.
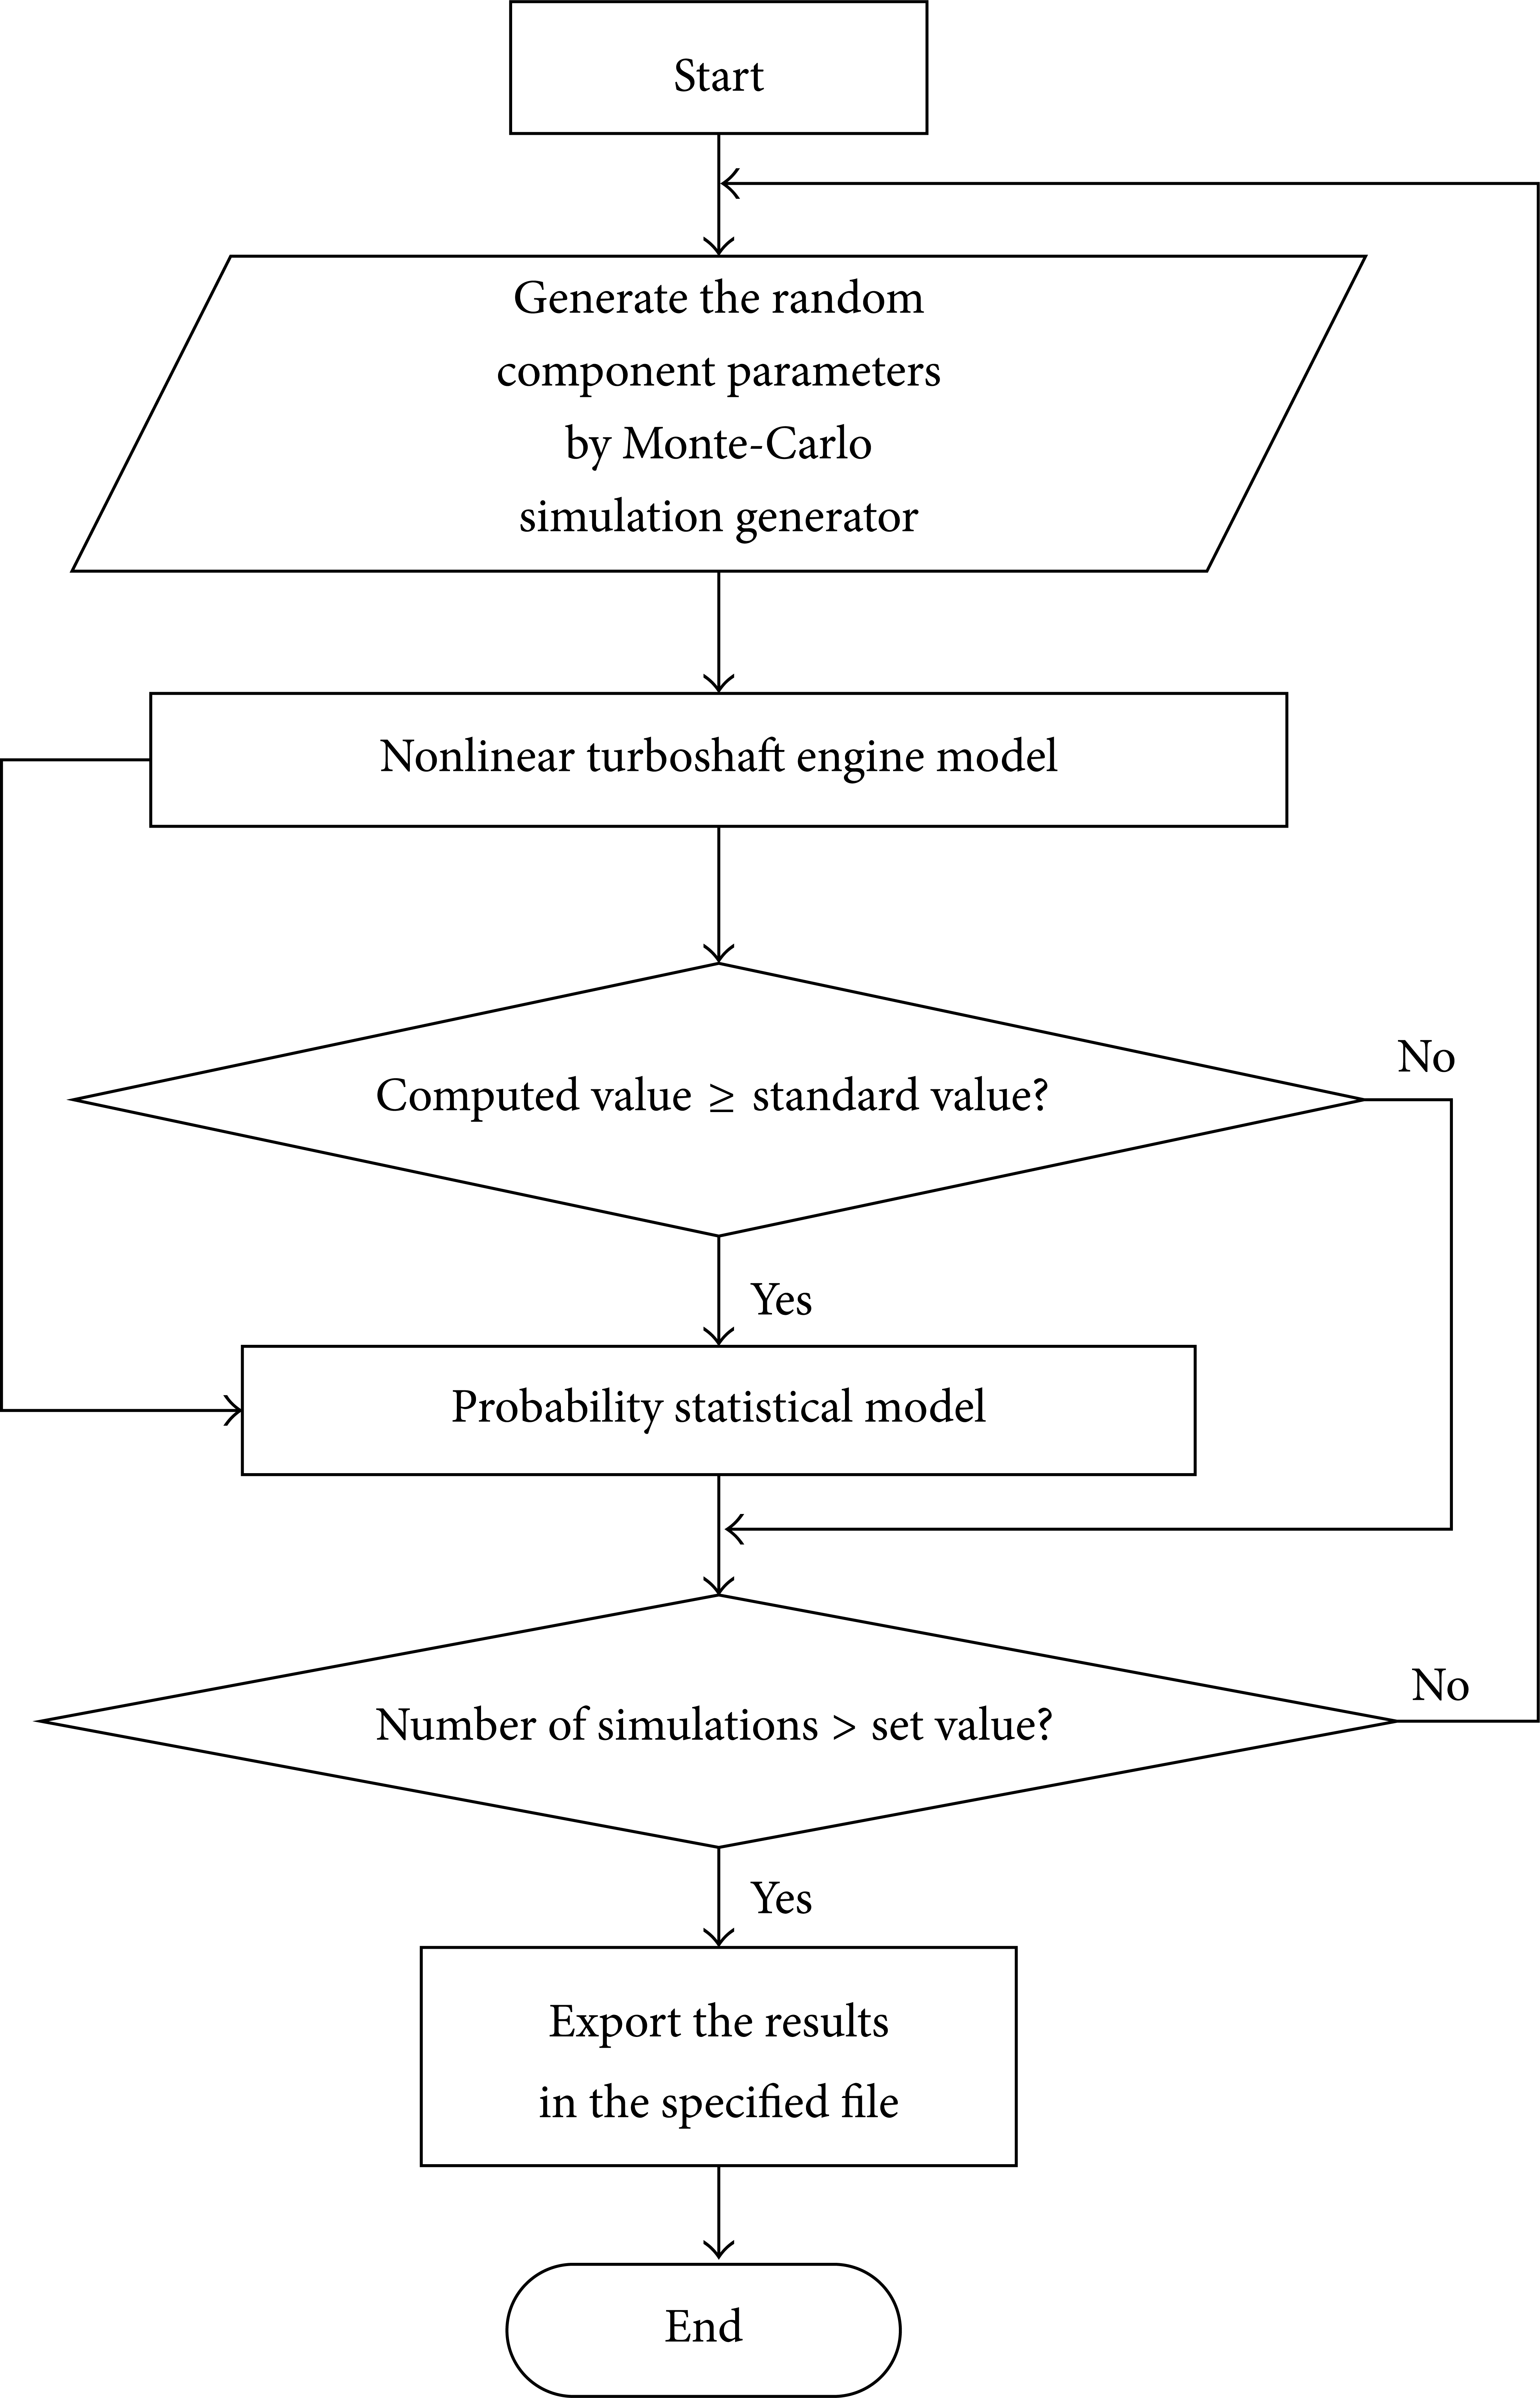
Figures 4, 5, 6, and 7 show the variation curves of the mean and standard deviation of the turboshaft engine overall performance parameters following the sample capacity change. According to these figures, while the sample capacity exceeds 14,000, the values of mean and standard deviation on performance parameters incline to remain constant. Therefore, considering the computational accuracy and speed, we believe 14,000 is the proper sample capacity of the Monte-Carlo simulation.
Mean of output power versus sample capacity (the standard deviations of component performance are 1%).

Standard deviation of output power versus sample capacity (the standard deviations of component performance are 1%).

Mean of SFC versus sample capacity (the standard deviations of component performance are 1%).

Standard deviation of SFC versus sample on capacity (the standard deviations of component performance are 1%).
5.1.2. The Quantification Relationships between the Uncertainties in Component Performance and the Mean and Standard Deviation of the Turboshaft Engine Overall Performance Parameters
The objectives of this part are to acquire the quantification relationships between the uncertainties in component performance and the mean and standard deviation of performance parameters. The results in Table 2 show that, as a single component, the burner, gas turbine, power turbine, and combined compressor have little effect on the mean of output power and SFC, which are, respectively, around 1891.2 kW and 0.256 kg/kW/h. The most influential component for the standard deviation of output power is combined compressor efficiency and the SFC is gas turbine efficiency. Doubtlessly, the combination of these components (combined components) has the greatest effect not only on the mean of output power and SFC but also on their standard deviations.
The quantification relationships between the uncertainties in component performance and the means and standard deviations of performance parameters.

Given all that, to improve the stability of the engine overall performance and satisfy the users, it is crucial to develop the technology of manufacturing and assembly of the combined compressor and gas turbine to decrease the tolerance and increase the turboshaft engine product quality. Moreover, if the payoff is sufficient, all of the components should be implemented.
5.2. The Quantification Relationships between the Uncertainties in Component Performance and the Turboshaft Engine Overall Performance
5.2.1. The Effects of the Uncertainties in Component Performance on Output Power
The effect of the uncertainties in component performance on output power is shown in Table 3. The relative power is the ratio between the computing value and the standard value. When the relative power is 100%, it means the engine output power can meet the user's target. On the contrary, if the relative power is less than 100%, the output power is then unable to satisfy the user's requirement.
The effects of the uncertainties in component performance on probabilities of the engine output power meeting the target.
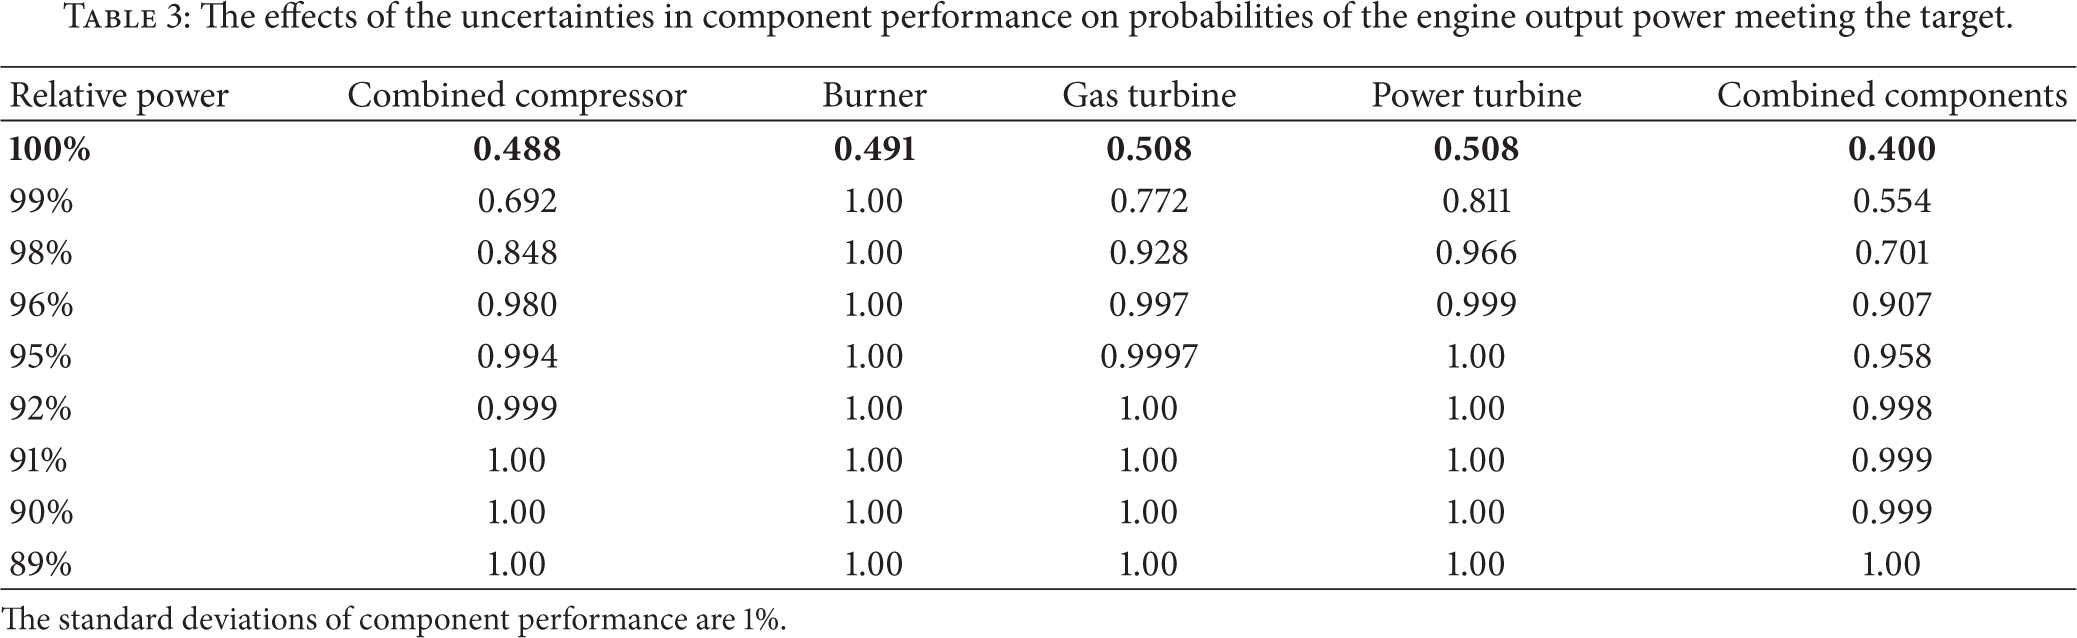
The standard deviations of component performance are 1%.
For single components, with the same deviation, gas turbine and power turbine have the highest probabilities of the engine output power meeting the targets simultaneously (0.5085). The burner is 0.4915 and the combined compressor is the lowest of 0.4883. Among all cases, there is no doubt that the lowest is the combined components, which is 0.4008. It is noteworthy that, for not only combined components but also the single components, the probability of the engine output power meeting the target gradually increases from the minimum value to 1.00 by reducing the relative power from 100% to 89%.
Table 3 also implies that the uncertainties in the combined compressor efficiency have the strongest effect on the probabilities of the engine output power meeting the target. Therefore, the results can help the engine decision makers to assign priorities to the development of combined compressors, thus increasing its actual performance.
5.2.2. The Effects of the Uncertainties in Component Performance on SFC
Table 4 shows the effects of the uncertainties in component performance on SFC. The relative SFC is the ratio between the computing value and standard value. When the relative SFC is 100%, it means the engine SFC can meet the target. If the relative SFC is greater than 100%, then the SFC cannot achieve the user's goal.
The effects of the uncertainties in component performance on SFC.

The standard deviations of component performance are 1%.
Table 4 indicates that the uncertainties in burner combustion efficiency, for single components, provide the highest probability of the engine SFC meeting the target, which is 0.5109. The gas turbine and power turbine are 0.5101 at the same time. The lowest is the combined compressor. As expected, among all the situations, the lowest is the combined components, which is 0.3975. Meanwhile, as the relative SFC increases from 100% to 107%, the probabilities of the engine SFC meeting the target gradually rise from the minimum value approaching 1.0000. The results above can also give advice to the engine decision maker to focus on the improvement of the combined compressor.
In summary, the quantification relationships between the uncertainties in component performance and the turboshaft engine overall performance can guide the designers to either decrease the standard deviations of component performance distributions or increase the design margins of component performance to obtain the better turboshaft engine overall performance. Thus the acquired results can provide proper standard deviations of component performance distributions and reasonable component performance design margins. Furthermore, if the quantification relationships between the manufacturing (or assembly) tolerance and the standard deviations of component performance distributions are already known, the proper manufacturing (or assembly) tolerance can also be provided indirectly. Therefore, the bridge between the manufacturing (or assembly) technologies and the engine overall performance can be constructed to optimize the engine overall performance on the level of manufacturing (or assembly) technologies. Finally, the designers can make a compromise decision between the cost of manufacturing (or assembly) and the engine performance during the engine preliminary design.
To obtain the tendency of the probabilities of the turboshaft engine overall performance meeting the targets along with different standard deviations of component performance distributions and cognize the change law, the influence of different standard deviations of component performance distributions on the turboshaft engine overall performance parameters should be investigated.
Meanwhile, it is hard to avoid component performance deteriorations during use. To predict the overall performance of the turboshaft engine accurately in the entire life cycle of the engine, we need to consider the influence of the uncertainties in the component performance. In the next section, the influences of different standard deviations of component performance distributions and different deterioration ranges of component performance on the turboshaft engine overall performance parameters are presented by means of numerical simulation.
5.3. The Influences of Different Standard Deviations of Component Performance Distributions and Different Deterioration Ranges of Component Performance on the Turboshaft Engine Overall Performance Parameters
5.3.1. The Influence of Different Standard Deviations of Component Performance Distributions on the Engine Overall Performance
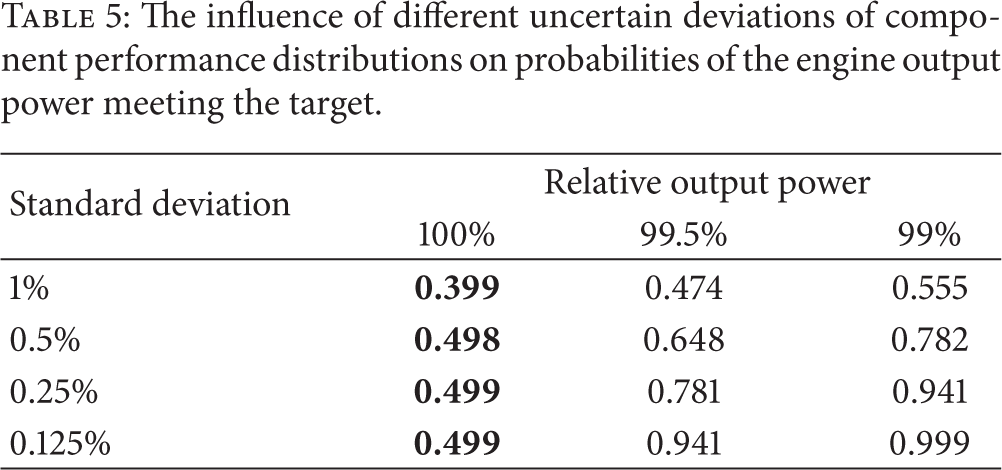
The technological level of manufacturing and assembly determines the deviation range between the component design performance and the actual performance. Therefore, the influence of different standard deviations of component performance distributions on the engine performance is investigated. The results are shown in Tables 5 and 6. The standard deviations used in this paper are, respectively, 1%, 0.5%, 0.25%, and 0.125%.
The influence of different uncertain deviations of component performance distributions on probabilities of the engine output power meeting the target.
The influence of different uncertain deviations of component performance distributions on probabilities of the engine SFC meeting the target.

Table 5 shows that the probability of the engine output power meeting the target, at 100% relative output power, increases from 0.3993 to 0.4991 as the standard deviations of component performance decrease from 1% to 0.125%. Moreover, the increasing range, as the relative output level decreases from 100% to 99%, rises obviously. Table 6 presents that, at 100% relative SFC, the probability of the engine SFC meeting the target improves from 0.3983 to 0.5131. In addition, the increasing range is similar to the situation of the output power.
The above results provide the change tendency of the probabilities of the turboshaft engine overall performance meeting the targets along with different standard deviations of component performance distributions. The change tendency implies that the smaller the standard deviations are, the higher the probabilities of the turboshaft engine overall performance meeting the targets will be. It also indicates that the lower the relative output power and SFC are, the higher the probabilities of the turboshaft engine overall performance meeting the targets will be. As seen from the above, the quantification relationships between different standard deviations and engine performance are easy to obtain by the probabilistic design numerical simulation, not only saving the cost but also reducing the cycle of the realistic experiments.
5.3.2. The Influence of Different Deterioration Ranges of Component Performance on the Engine Performance Parameters
The turboshaft engine may suffer uncertain fouling, erosion, damage, abrasion, and other problems in the course of utilization [2, 3]. These problems may contribute to the deterioration of each component performance and eventually cause the engine overall performance deterioration. In this case, the engine can no longer satisfy users. In order to predict the overall performance of the turboshaft engine accurately in the entire life cycle of the engine, we also need to consider the influence of the uncertainties in component performance distributions. Tables 7 and 8 show the influence of different deterioration ranges of component performance on the engine performance parameters. The deviations of component performance are taken as 1%.
The influence of different deterioration ranges of component performance on probabilities of the engine output power meeting the target.

The standard deviations of component performance are 1%.
The influence of different deterioration ranges of component performance on probabilities of the engine SFC meeting the target.

The standard deviations of component performance are 1%.
Table 7 reveals that the probability of the engine output power meeting the target decreases from 0.3553 to 0.0030, with all component performance deteriorating from 0.1% to 1.5%. The decreasing range, as the relative output level decreases from 100% to 99%, changes slightly. Moreover, in Table 8, the probability of the engine SFC meeting the target reduces from 0.3387 to 0.004 and the decreasing range is similar to the situation of the output power.
Compared with Section 5.3.1, the advantage of the probabilistic design numerical simulation is obvious. It cannot only simulate the deterioration of the component performance but also take into account the influence of the uncertainties in component performance. Therefore, the decision makers can keep the proper margins for the component performance and predict the status of the engine performance parameters meeting the targets in the entire life cycle of the engine.
5.4. Cycle Parameters Selection of the Turboshaft Engine
In previous sections, the probabilistic design method is used to analyze the probabilities of the engine performance parameters meeting the targets under the conditions of the uncertainties in component performance. In this section, a direct quantization comparison between the probabilistic and deterministic (not considering the uncertainties in component performance) design method is discussed through the use of probability and deterministic contours.
In selecting cycle parameters, the uncertainties in component performance are taken as 1%. The turbine entry temperature (TET) is in range (1650 K, 1750 K) and the engine overall pressure ratio (OPR) is in interval (16, 21). The standards of the output power and specific fuel consumption are, respectively, 1891.2 kW and 0.256 kg/kW/h. As shown in Figures 8 and 9, the “probability of success” represents the probabilities of the engine performance parameters meeting the targets. This paper derives that only when the probability of success is greater than or equal to 0.95, can the engine performance parameters satisfy the users.

Comparison between deterministic and probabilistic design methods (output power) (the standard deviations of component performance are 1%).
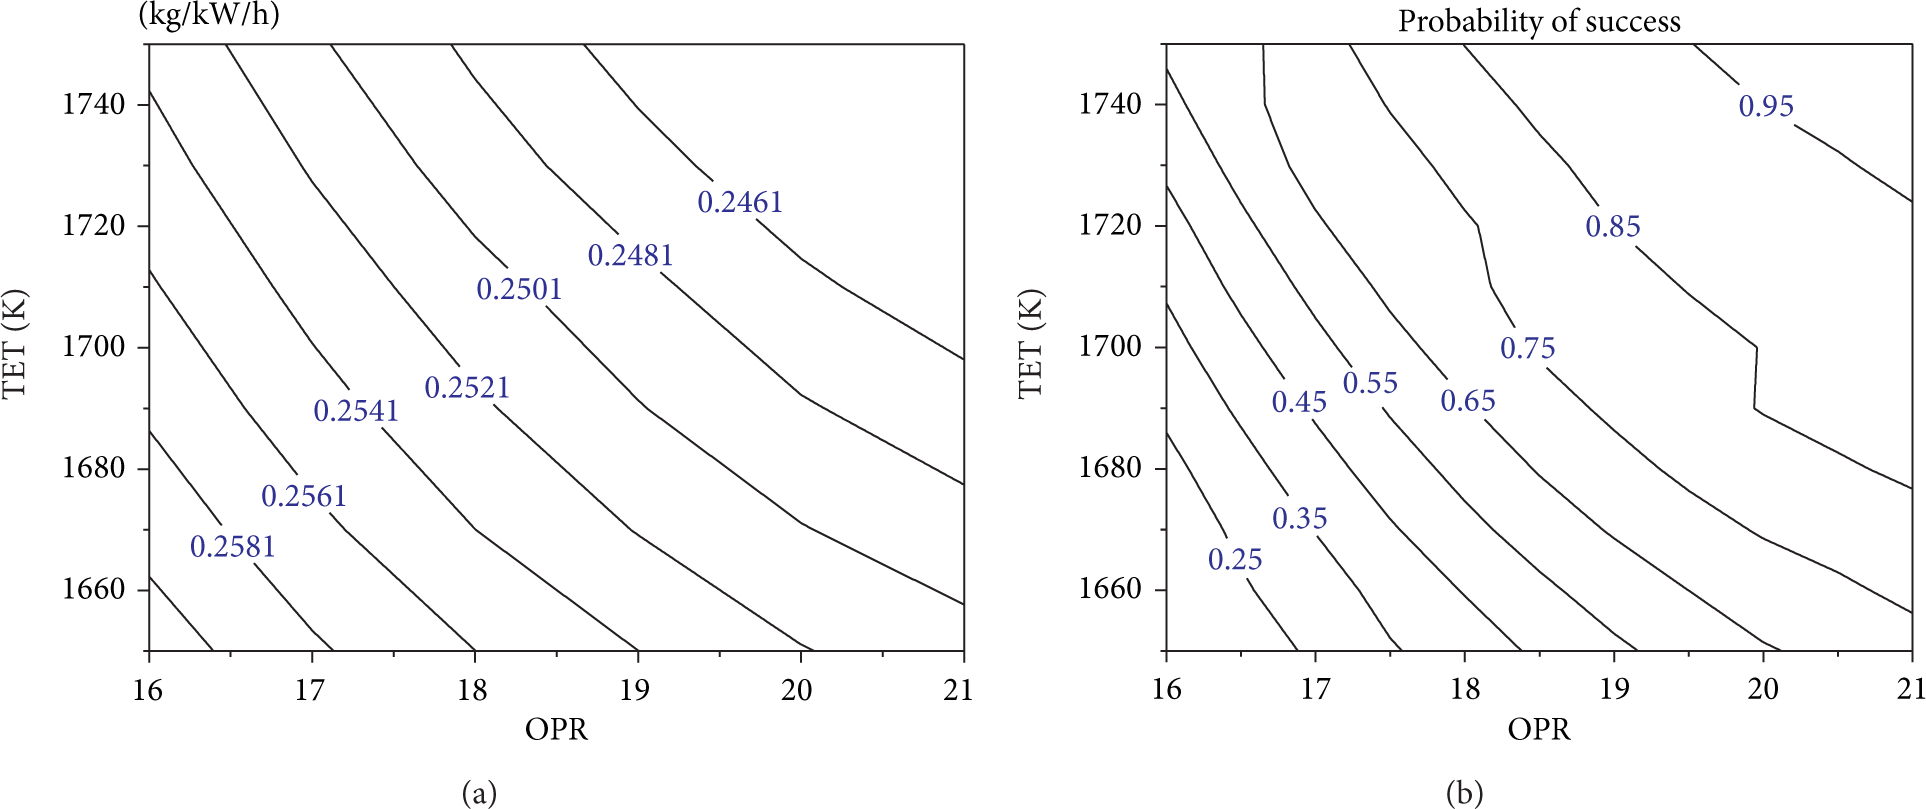
Comparison between deterministic and probabilistic design methods (SFC) (the standard deviations of component performance are 1%).
Figure 8 shows the contour plots for the engine output power. The plot on the left is the classical deterministic point of view showing contours of engine output power assuming fixed values for the four component efficiencies. According to these contours, the output power will meet or exceed 1891.21 kW so long as the cycle parameters are not taken in the lower right corner of the left plot of Figure 8. The plot on the right shows the same problem from the probabilistic point of view. The difference in this case is that the contours express the probability of the engine output power meeting the target. Namely, the contour plot in the right shows the absolute probability level, which is effectively an aggregate view of the contribution from all four uncertain component performance parameters to engine output power. Thus, for example, all points above the 0.85 probability of success contour have at least an 85% chance to meet the engine output power. In this paper, in accordance with the targets, all cycle parameters above the 0.95 probability of success contour can meet the requirement of the output power. In other words, only when the TET is above 1690 K and the OPR can be taken as any values in interval (16, 21), can the engine output power meet the target.
Figure 9 shows the contour plots of engine SFC. The plot on the left is obtained by the deterministic design method which assumes that the four component efficiencies are invariant. It should be noted that the engine SFC can meet or be less than 0.2561 kg/kW/h when the TET is above 1725 K and the OPR is no less than 18. The plot on the right shows the probability contours obtained by the probabilistic design method. According to the right contours, the engine SFC will meet the targets only when the cycle parameters are taken in the top right corner of the right plot of Figure 9. In other words, the engine SFC will meet the target as long as the TET is no less than 1725 K and the OPR is no less than 19.5.
Furthermore, the above analysis shows that the uncertainties in component performance have a significant influence on engine cycle parameters selection. Based on the deterministic design method, the intersection of the left plots of Figures 8 and 9 can meet the engine performance targets easily. Namely, when the TET is merely no less than 1712 K and the OPR is merely no less than 18, the engine output power will be greater than or equal to 1891.21 kW and the SFC will be less than 0.2561 kg/kW/h. However, based on the probabilistic design method, the intersection of the right plots of Figures 8 and 9 is smaller than the deterministic design method. That is to say, only when the TET is no less than 1725 K and the OPR is no less than 19.5, which has the same range of engine SFC to meet, the probability of success will be greater than or equal to 0.95 and the engine performance can satisfy the users.
In summary, compared to the deterministic design method, the TET and OPR of the probabilistic design method, which takes into consideration the uncertainties in component performance, increase by 0.76% and 8.33%, respectively. Hence, the engine designers cannot ignore the effects of uncertain manufacturing and assembly tolerance as well as the uncertain erosion, fouling, or the strikes of foreign objects in the course of utilization on component performance in the engine cycle parameters selection in the preliminary design. Meanwhile, the improvement of combined compressors, the amelioration of manufacturing and assembly technology, and the proper margins of the component performance should be given enough attention. The compromise decision between the cost and the effects should be made by the engine designers according to the results of Sections 5.1, 5.2, and 5.3. In this way, the engine can achieve better performance and meet the operating requirements during the life time of the engine.
6. Conclusions
To design a perfect aeroengine is difficult and complex, involving many uncertain factors, especially the uncertainties in component performance. In order to obtain the trades between uncertainties in component performance and the engine overall performance, this paper establishes a novel nonlinear turboshaft engine model based on Monte-Carlo probabilistic design method. Aided by this model, some useful conclusions can be drawn.
The most influential component on the standard deviation of the output power is combined compressor efficiency and the SFC is gas turbine efficiency. Certainly, the combination of the whole components has the greatest effect on not only the mean of the output power and SFC but also their standard deviations.
Second, the results show that, for single components, the uncertainties in turbine and power turbine efficiencies present the highest probabilities of the engine output power meeting the target and they are simultaneously 0.5085. For the engine SFC, the combustion efficiency has the highest probability which is 0.5109. The gas turbine and power turbine are 0.5101 at the same time. The results can also suggest that the engine decision makers assign priorities to the development of combined compressors, thus increasing its actual performance.
Third, the probabilities of the engine output power and the specific fuel consumption meeting the targets increase, respectively, from 0.3993 to 0.4991 and from 0.4739 to 0.9411 as the standard deviations of component efficiencies decrease from 1% to 0.125%. According to the above data, it is apparent that the probabilistic design method can allow the designers to obtain the probabilities of the engine performance meeting the targets by the numerical simulation, instead of the realistic experiments. The designers can make a compromise decision between the cost of manufacturing and assembly and the engine performance in the engine preliminary design.
Fourth, the results also show that the probabilities of the engine output power and the specific fuel consumption meeting the targets decrease, respectively, from 0.3553 to 0.0030 and from 0.3387 to 0.0004 with each component efficiency deteriorating from 0.1% to 1.5%. Given this data, the decision makers can keep the proper margins for the component performance and predict the status of the engine performance parameters meeting the targets throughout the engine lifetime.
Finally, for the turboshaft engine cycle parameters selection, only when the TET is no less than 1725 K and the OPR is no less than 19.5, will the probability of success be greater than or equal to 0.95 and the engine performance can satisfy the users. In other words, compared to the deterministic design method, the TET and OPR of probabilistic design method, which takes into consideration the uncertainties in component performance, increase by 0.76% and 8.33%, respectively.
Footnotes
Nomenclature
Conflict of Interests
The authors declare that there is no conflict of interests regarding the publication of this paper.
Acknowledgments
This work was supported by the Natural Science Foundation of China (NSFC) under Grant no. 51206005 and the Fundamental Research Funds for the Central Universities no. 3042014YWF-14-DLXY-007. This research was also funded by Beijing Youth Talent Plan YETP1076.