
Abstract
The problem of using lesser wireless sensor network nodes to achieve coverage and connection of certain areas under given coverage conditions is a priority and hotspot issue of WSN. For this reason, in this paper, an optimized strategy coverage control (OSCC) algorithm is proposed. First of all, a relation mapping model of sensor nodes and target nodes is established by OSCC which is based on geometric figure and related theories, probability theory, converge property, and so forth to complete effective reasoning and calculate certain network models. Secondly, OSCC makes efficient analysis of the calculating results figure out the least number of sensor nodes to cover specific monitoring area. Thirdly, OSCC picks out the optimal routing solution while conducting combinatorial optimization of routing path using ant colony optimization (ACO) algorithm, thus reducing the energy spending of whole network. In the end, this paper verifies OSCC algorithm by simulation experiment and proves it can use least sensor nodes to effectively cover target area. Also, OSCC helps greatly reduce network energy consuming, minimize network resources layout costs, and enhance network life cycle, simultaneously.
1. Introduction
Wireless sensor network (WSN) is a wireless self-organization network which consists of large number of cheap sensor nodes. It is a system having the capabilities of calculating, perceiving, and communicating which can be widely applied in national defense monitoring, environment detecting, mine wrecking, medicine, traffic realms, and so forth. The coverage problem, the connectivity problem among nodes or between nodes and station, and the energy consuming problem of nodes are all hotspot issues of WSN [1–4]. The coverage and connectivity problem not only directly affects the working of network, but also determines network energy consuming, network life cycle length, and network quality of service.
The coverage problem and the connectivity problem are fundamental questions in WSN. There are two ways of deploying sensor nodes: definite deployment and random deployment. Definite deployment concentrates on optimal deployment strategies of 2-dimensional and 3-dimensional space which satisfies different coverage demand and connectivity demand by handwork. However, while deploying large numbers of sensor nodes or deployment area is not appropriate for handwork, random deployment is adopted. By the way, most applications do not ask for full cover of sensor network. Instead, keeping sensor nodes cover certain rate of detected area to complete specific work is enough. The coverage problem and connectivity problem are important issues for WSN for they reflect the network state of detected area. The coverage control of WSN for specific application helps master node energy consuming improve quality of service in perceiving and extend overall life cycle. However, it will also bring problems such as increase in the cost of network transmission, management, storage, and computing. Also, network life cycle holds a critical part when coverage rate and connectivity rate are satisfied. Thus, how to meet certain coverage condition using least sensor nodes to complete coverage and connectivity of specific area while holding nodes energy consuming is a challenging project. Above all, this paper is organized as follows.
Related literatures are studied and different algorithms are concluded to find their advantages and disadvantages in applications. This paper puts forward an improved algorithm to make up the insufficiency of algorithms studied. A probabilistic model of WSN is established, giving out the function between nodes and their detected area and the relation of different parameters by geometrical theory. Though effectively reasoning and verifying of solved function with mathematics method, details of reasoning and verifying process are given to make sure the least nodes and most coverage of specific area. While making sure of the coverage of detected area, this paper adopts ant colony optimization of artificial intelligence and virtual force between nodes. Though vector theory to calculate node moving path and direction, and finally making sensor nodes to optimal location. The proof of routing path convergence speed under ant colony optimization is given which enhances the coverage of WSN. Simulation result shows that OSCC fulfill high-speed and effective and stable coverage of sensor network.
2. Related Works
In recent years, theories and solutions about the coverage problem and the connectivity problem in WSN have been proposed. Tamboli and Younis [5] suggested a method about the sensor coverage and connectivity restoration in removable sensor networks where the main idea is integrating the coverage problem and the connectivity problem. The Coverage C3R (conscious connectivity restoration) algorithm is used to recover one or more invalid nodes from neighbors', each neighbor node is relocated and invalid nodes are replaced to its initial position; thus the connectivity is recovered and the target nodes are detected at the initial position within the coverage region. Sheu and Lin [6] developed a CPP algorithm which made an improvement of the CCAP algorithm. The CPP algorithm employs working nodes as less as possible while keeping the coverage area. The centrally controlled approach adopted by CPP algorithm results in restricted scale of WSN. What is more, little work is done on three-dimensional sensor networks introducing probability coverage model. However, most applied WSN are located in 3-dimensional sensor networks, thus making it more precise for simulation. De Mello et al. [7] introduced an algorithm focusing on the issues of coverage and redundancy, which is based on the GA (genetic algorithm) to optimize the coverage and reduce energy consuming without losing coverage. Habib and Safar [8] established a model that lattices the coverage area where each lattice has a sensor located in the position of the lattices. According to the row and column position in the matrix, an optimal model on the consumption and the coverage rate of WSN is given. Finally, genetic algorithm (GA) is used to figure out the best solution. A virtual power algorithm put forward by [9] is frequently used in dynamic deployment of sensor nodes. The receiving information strength of nodes is regarded as a virtual power within sensor nodes. The process of dynamic deployment will not be finished until the balance of the virtual power each node finished. An algorithm based on the virtual power in combination with particle swarm optimization (PSO) [10] is applied in controlling coverage regions while ignoring the minimum consumption of nodes' energy. The maximum coverage, the minimum communication costs, and the energy depleted in nodes' moving were all considered by Wang et al. [11]. However, the searching space of a PSO would be in exponential growth with the increase of dimensions of optimize vectors, thus making computing time complexity be a bottleneck in the process of networks' optimization. All the algorithms mentioned above are able to solve the problem of coverage and connectivity to a large extent, but the process is complicated. Moreover, with the increase of nodes and change of coverage regions, the complexity of algorithms will be increased and the computing efficiently will be decreased. Tian et al. [12] introduced an algorithm based on simulate anneal arithmetic (SAA) to minimize the distance mistake. Each lattice has a sensor in initial. If node configuration cost does not reach the threshold given before, then loop the procedure as follows. First of all, delete a sensor node randomly, and make an evaluation of replacement cost. If replacement cost fails, move this node to another random position and then reevaluate. A coverage and connectivity method to cluster topology (CCC) in WSN algorithm was put forward by Wang et al. [13] that an optimal cluster should have 15 nodes and if the clusters make an equilateral triangle, the efficiency of coverage and connectivity is the best. According to the ideas mentioned, this paper puts forward a coverage algorithm using the linear relationship on topology control to establish a probabilistic model of WSN. Function relation about perception radius and monitoring regions is given though the path and direction of a moving node can be figured out by vector theory and compute an optimal solution by ACO. OSCC supports data's transmission after many-hop route. Finally, simulation results show that OSCC not only reduces sensor nodes energy consuming, but also improves the coverage with less nodes. What is more, interference is reduced effectively, the quality of WSN service is improved, and the life cycle of the network is increased.
3. Definition of the Problem and the Network Model
3.1. Definition of the Problem
Coverage control is a key topic in the research of wireless sensor network which directly affects the quality of the WSN coverage services. In this paper, the main idea is to build a WSN model through functions vector relationship with sensors movement and nodes final location. In the model, all pheromone on the path of nodes movements will be updated using ACO which will make dynamic balance within all sensor nodes.
The research on coverage and the connectivity discussed in this paper is based on regional local positioning algorithm and equipped with the following basic assumptions.
Hypothesis 1.
Both coverage radius and communication radius of each node are disc-shaped.
Hypothesis 2.
The sensor nodes can get its own location information through localization algorithms, such as RSSI locating algorithm and Euclidean locating algorithm.
Hypothesis 3.
Identification of each sensor node is unique.
Hypothesis 4.
The perception range of each sensor node is far less than the entire network coverage area, and all nodes are heterogeneous and independent and have the same initial energy.
Hypothesis 5.
While moving, the sensor has enough energy to complete the required distance.
Definition 1.
Given target set
Definition 2.
Suppose there are nodes
Definition 3.
In the monitoring area, each node is at least covered by K sensor nodes at the same time; then we called it the K-degree coverage, namely,
3.2. The Establishment of the Network Model
In a square monitoring area, N sensor nodes are randomly deployed. Eight were chosen as center nodes arbitrarily at the initial time. Then, divide the square into eight different areas whose intersection point is the center of the square based on the eight center nodes. Suppose there is a sensor named S and a hexagon whose center is S. Now arbitrarily choose four points from the hexagon's vertexes randomly and assume they are cluster head nodes; thus the associated attributes formed between each central node and cluster head node is

Schematic for associated attribute between cluster head nodes and center node.
3.3. Determination of the Relationship Vector
Definition 4.
The mobile node i in the position

Similarly, the attraction between node i and node j is defined as


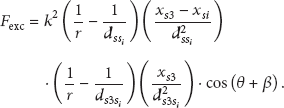
Mobile node is defined by the virtual force and vector relationship. Take Figure 1 for example, at the initial moment, the deployment of a sensor node is a random shape and its location is random. Virtual force exists between any two nodes, and each sensor node is looking for a stable state of equilibrium as for the regular hexagon which is the vertex positions of hexagon. At the initial moment, the direction of virtual force formed by six vertices of the hexagon centered on node S is transferred out in the form of news broadcast to look for its six neighboring nodes. Assuming that sensor node

β can be obtained in the same way; substituting formula (5) into formulas (1) and (3), repulsive force size and direction of sensor node
Theorem 5.
In the monitoring region, the maximum overlapped area of three arbitrary sensor nodes is
Proof.
In the monitoring region, the basic pattern of overlapped area of three arbitrary sensor nodes is that one in two others' coverage region, as show in Figure 2(a).
Situation 1. If three circles are circumscribed with each other, inanition will exist but without coverage which contradicts with the condition of full coverage, so the situation is abolished.
Situation 2. Figure 2(b) shows the model of WSN’ multiple coverage; the shadow is

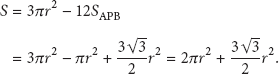
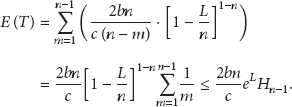
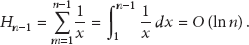
The expectation

The proof is over.

(a) Three circles intersection. (b) Three circles intersect into a point.
Theorem 6.
Suppose the probability of an event happened among the sensors coverage region is p, the target nodes are multioverlapped. Let
Proof.
Suppose X is the number of moving nodes in the first loop, Y is the number of moving nodes in the second loop. From the Theorem 6, we know that the target node is covered by sensor at the m time for the first loop. For the second loop, the target node is covered twice at the n time;


4. Optimized Scheduling Strategy
4.1. Ant Colony Optimization and Evolution of Probability
Coverage control plays a vital role in coverage efficiency of wireless sensor network. How to effectively deploy the sensor nodes to cover the monitoring area completely and how to reduce the energy consumption of sensors in the process of deploying in order to extend the lifecycle of the whole network are all hot spots including focusing on how to reduce redundant code during the transmission of data and increase the transmission ratio of communication channel. For this reason, this section introduces the ant colony algorithm (ACO) to optimize the deployment of sensor nodes, mainly because ACO is an intelligent algorithm for group pattern whose workspace is a continuous search space with which all the sensor nodes can be moved to the desired area by adapting function. Combining the own characteristics of wireless sensor network and the characteristics of local convergence and global search of the ant colony optimization, which make it more flexible to deploy the sensor nodes, thus, reduces the cost of network energy and prolongs the lifecycle.
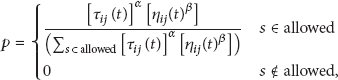
Definition 7.
In the process of traversal search, ant calculates the state transition probability according to the amount of information and the heuristic information on each path. Assume the transition probability between any two points is p, that is,

Theorem 8.
In the coverage area, any sensor node moves between the path
Proof.
In order to illustrate the problem better, using the incremental pheromone of the ACO to represent the incremental coverage of adjacent iterations, equations (14) and (15) show that, the value of

Theorem 8 shows, in the cowering area, that the limit of incremental coverage of mobile nodes within a limited number of iterations is 1, so as to achieve the purpose of complete coverage of the area.
Theorem 9.
Assume in the coverage area that the coverage rate of sensor nodes is p, the maximum upper bound of iteration is N, and the expected number of sensor nodes is
Proof.
Assume X is the number of transfers at the first time to cover the target node; the possible values of


The proof is over.
Corollary 10.
Assume, in the coverage area, the coverage rate of sensor nodes is
Proof.
Using mathematical induction to prove it, in the area of coverage, each sensor node is not independent of each other when the sensor node works. Therefore, the probability that two sensor nodes work is


The proof is over.
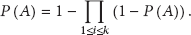
Corollary 11.
Generally, assume when sensor node covers some area, the minimum probability of making the whole network work normally is

Proof.
According to Di Morpho Laplace central limit theorem


The proof is over.
4.2. Dynamic Parameter Settings and Update Policies
In the process of wireless sensor network optimization coverage, the process of moving of mobile node could be quickly completed after the introduction of the ACO, thus reaching the determined final position. There are a number of parameters of the ACO; each parameter has its own practical significance. Reasonable parameter settings can improve the convergence speed, Enhance the global search capability, effective inhibition appears premature stagnation. When α is too large, it will cause a positive feedback enhancement in the local optimal path. Consider


For ACO, when the ants move to the next position in a unit of time, the pheromone of path will increase substantially, making the most of the ants choose the same path. When the number of ants that choose the same path reaches a certain quantity, stopping traversal due to the current distance exceeds the length of previous optimal path, thus making the chance of other ants to choose the other paths increase, and the solution obtained by search tends to be diverse. The update policies of pheromone update according to (15).
4.3. OSCC Algorithm Description
Through geometric theory, the sensor nodes are deployed in key target node range and ensure that the concerned target nodes are covered by at least one sensor node; we find out the associated properties relationship of the working sensor nodes in a sensor node collection. Through the ACO iterative relations and event probability function, we find the optimal subset of iterative optimization after applying the iterative optimization to divided subregions. Thus making the entire network nodes have been optimized, obtaining the minimum number of coverage nodes. Computational cost and complexity of OSCC algorithm is low, which can save energy effectively, extend the life cycle of the network, and improve the performance. (See Algorithm 1 and Procedure 1).
Begin
IF (When N is empty) S = emptyset (
End IF
While (N) {Do
Do
{switch (n)
Set each ant colony transition probability;
Update the ant probability formula;
{ Dynamic parameter Settings} IF (
continue;
end IF
transfer (Update probability formula) IF (flag) flag = 1
else
flag = 0
end IF
end For
Procedure 1
Step 1. Initialize the target monitoring area, generate the initial velocity and the initial position of each node, and set the size of the network N. Step 2. Assess the effective coverage performance; give the probability of each node by formula (14), then update the local optimum of each node particle and the global optimum of entire particle swarm by the comparison of formula (15). Step 3. According to the formula (29) and formula (30), update the dynamic parameters respectively in order to find suitable comparison relationships. Step 4. After some effective iteration for Step 2, if the change of optimal value obtained by OSCC algorithm is not obvious, go to Step 2, otherwise, continue. Step 5. When the distance between the sensor nodes to the minimum is the minimum or the coverage rate is the maximum, the algorithm terminates.
Algorithm 1
Compared with the traditional single coverage or coverage under other controlled forms, the OSCC algorithm has stronger search capabilities and faster convergence in the process of node optimization and deployment. However, the ability to identify the precise direction for sensor nodes is needed and more energy consumption during the node deployment.
4.4. OSCC Algorithm Complexity Analysis
In order to verify the complexity of the algorithm in this paper, we will describe some parameters:
α: information heuristic factor; β: expectation heuristic factor; ρ: pheromone volatilization coefficient; n: number of sensor nodes; m: collection of connected edges of nodes; τ: values of pheromone; t: iteration time; p: transition probability;
Assuming the number of sensor nodes is n, the number of edges between any two sensor nodes m,

5. Algorithm Evaluations
To better evaluate the validity and stability of OSCC, MATLAB7 is used to be experimental platform and parameter settings are shown in Table 1.
Data parameter list.

According to the parameters setting in the previous section, sensor nodes are randomly scattered in a square area of
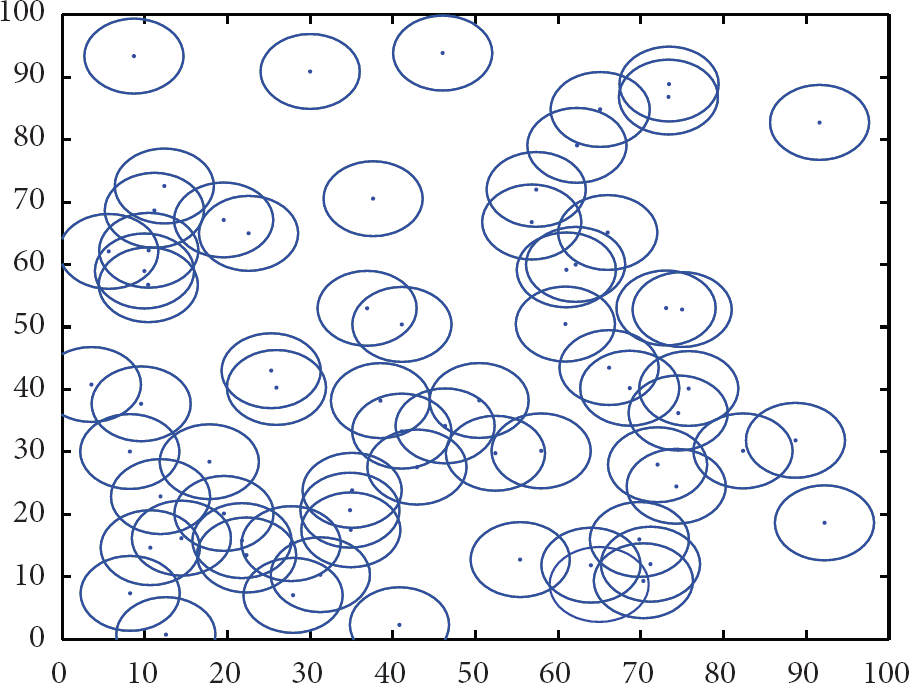

The deployment of nodes after executing OSCC algorithm.
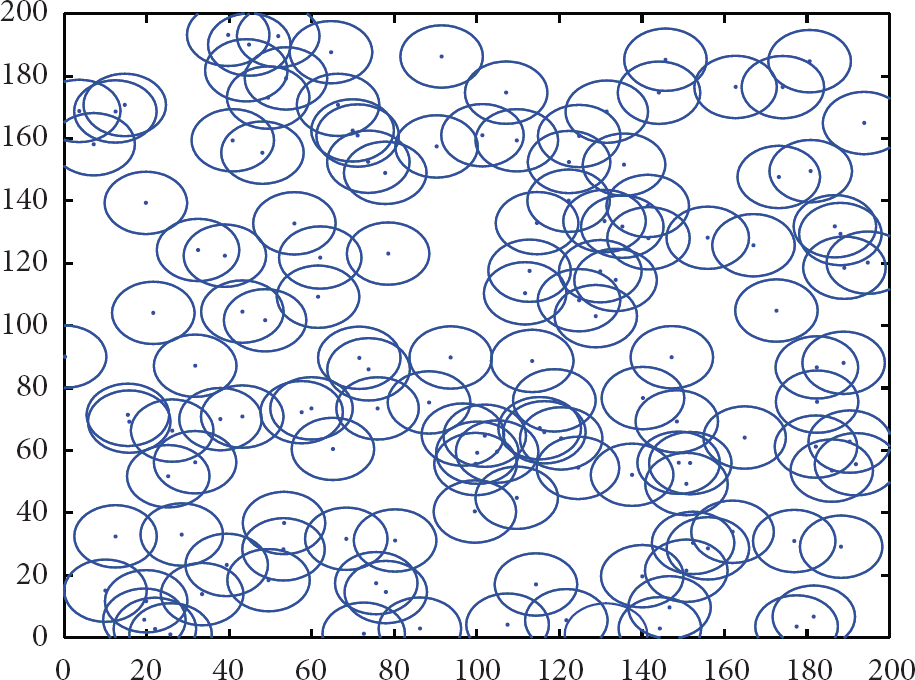

The deployment of nodes after executing OSCC algorithm.


The deployment of nodes after executing OSCC algorithm.
Comparing the deployment of network nodes with Figures 3, 4, 5, 6, 7, and 8 where can be seen that network coverage with OSCC is significantly higher than that of random deployment, and the distribution of nodes is more evenly deployed. When a target area is
To better evaluate validity of OSCC algorithm, simulation is done in MATLAB7 under Windows XP operating system while selecting three different coverage areas to do a comparative experiment about coverage rates. The curve between coverage rates and sensor nodes is shown in Figure 9.

The number of nodes and coverage rate graph.
Figure 9 reflects the relation between the number of nodes and coverage. Three curves, respectively, represent the degree of coverage rates with different sensor nodes. With the expansion of network size, the nodes needed to be deployed increase to meet the needs of network coverage, and the higher the network coverage rates are, the faster the nodes increase, meaning that full coverage is choosing different coverage areas to complete coverage with different sensor nodes. It is true that coverage of different target areas needs a different number of sensor nodes, when different areas have different coverage rate. Under certain coverage rate with the same nodes base,
This is a comparative experiment among OSCC algorithm, SCCP algorithm mentioned in [14], and PHOA algorithm mentioned in [15]. When the coverage rate is 99%, it is considered to be full coverage. The coverage area is
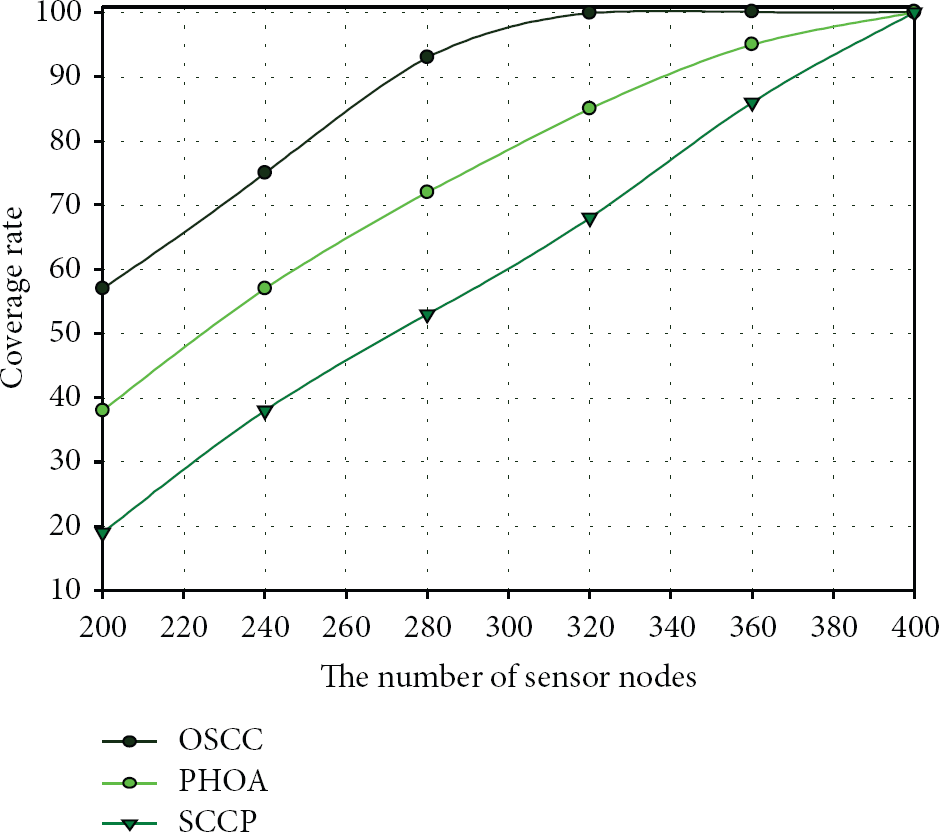
Three algorithms coverage variation curve under different node number.
In Figure 10, with the increasing of sensor nodes, the coverage rate increases. When

Three algorithms coverage variation curve under different times.
6. Conclusions
Firstly, this paper gives a brief introduction of WSN applications. Secondly, literatures on coverage of WSN are studied and their algorithms are analyzed to introduce what this paper is concerned about. Thirdly, a network model is built in which the relation between sensor node and target node is given, including vector relations of different parameters. Also, the proof and derivation of maximum coverage rate and expectation in a full coverage WSN model is given. Then, the proof and derivation of coverage condition and coverage rate of multi-overage model is studied. Fourthly, this paper introduces a local fast research of ant colony optimization to improve its research performance which accelerate coverage speed of detected area and improve its coverage. What is more, the proof and derivation of coverage rate increment and expectation of target coverage is given, thus getting the coverage rate of specific detected point. Fifthly, to avoid the influence of some dynamically changed parameters on global research, this paper makes adjustments on some parameters to give out a better algorithm description. Sixthly, Simulations on different coverage areas and comparison simulations with other algorithms verify the effectiveness of OSCC. There is still some work on scheduling of multicoverage nodes and minimum set of covering surface and so on.
Footnotes
Conflict of Interests
The authors declare that there is no conflict of interests regarding the publication of this paper.
Acknowledgments
National “863” High Technology Research and Development plans to fund Projects under Grant nos. 2011A01A204 and 2012AA01A306. Also this work is supported by the National Natural Science Foundation of China under Grant no. 61170245, Science of Technology Research of Foundation Project of Henan Province Education Department under Grant no. 2014B520099, Natural Science and Technology Research of Foundation Project of Henan Province Department of Science under Grant no. 142102210471, Natural Science Foundation for Young Scientists of Shanxi Province under Grant no. 2013JQ8024, Scientific Research Program Funded by Shaanxi Provincial Education Department Project no. 2013JK1139, and China Postdoctoral Science Foundation Project no. 2013M542370.