
Abstract
In present time, the guidelines on warning sign position in the China National Standard lack detailed and standard regulations of placing warning signs on sharp curves, which may cause road safety problems. Therefore, this paper briefly discussed how to optimize the position of a warning sign on a sharp curve through a driving simulator experiment. This study concluded that a warning sign placed at different positions prior to a sharp curve will have different influence ranges for drivers approaching and negotiating the curve. Meanwhile, different positions of a warning sign imposed different effect obviously on the adjustment of vehicle's lane position on sharp curves with the same radius, especially at the midpoint of a sharp curve. The evaluation results of five positions (0 m, 50 m, 100 m, 200 m, and 400 m in advance) showed that only when the warning signs were placed 100 m or 200 m prior to sharp curves, can they achieve positive influence on driving behavior. On this basis, the authors look forward to providing rationalization proposals in selecting the best position of a warning sign on a sharp curve for the engineering implementation and national standard.
1. Introduction
As one of the main road alignments, horizontal curves in rural roads have become a research focus of road safety issues, due to high crash rates in horizontal curves [1–3]. Compared with tangents, sharp curves contribute a 34% increase to crash frequency per kilometer for single vehicle crashes [4, 5]. Thus it is necessary to apply more effective crash preventive measures on horizontal sharp curves for driving safety.
At present, setting warning signs is one of the most important treatments to prevent crash, which helps drivers obtain warning information of the potential hazards in advance [6, 7]. In order to provide reference to practice, the China National Standards of Road Traffic Signs (GB5768.2-2009) and Manual on Uniform Traffic Control Devices (MUTCD, 2011) offer their standards, guidance, and options for the set-method of general warning sign position on sharp curves, respectively.
The curved segments of roadways are more hazardous than tangents because of the additional centripetal forces exerted on a vehicle. So drivers are in requirement of much more detection, recognition, reaction, and decision to negotiate curves. However, the set-method of warning sign on sharp curves in China National Standards may not be suitable for every curve. For example, it did not offer a recommended advance distance for warning sign position when the posted speed or the advisory speed of tangents prior to sharp curves is very low. It only regulates that “warning signs on sharp curves should be placed in the outside of curve entry” [8]. In MUTCD, no suggested distances are provided for warning signs before sharp curves when the advisory speed of sharp curve is rather low. Similarly, when the aforementioned situation occurs, it suggests that warning signs' positions should be based on the guidance with the addition of engineering judgment [9]. Above all, the current national standard failed to offer practical application method for a warning sign placed prior to sharp curves on low-speed rural road. In addition, rural roads serving as an important road category are widely used in practice. Thus, it is an urgent task to optimize the positions of warning signs on sharp curves.
Numerous studies have been conducted to evaluate the optimal position of road signs. In 2000, Persaud et al. [10] raised new models to develop guidelines for applying curve-warning treatments. In 2006, Ren and Li [11] established a calculation formula of traffic signs' placement on roadside by adopting mathematical theory. In recent years, investigators started to explore the issue on the perspective of visual characters. For example, Feng et al. [12] researched the placement of roadside traffic signs on the basis of driver's visibility distance. Jian et al. [13] explored the method of confirming a reasonable location of signs along highways from driver's visual response and cognitive features. It can be seen that latest researches optimized the position of general warning signs from the perspective of mathematical methods and cognitive features.
Based on crash analysis in previous studies, it is acknowledged in many countries that different road departures represent different proportions of road casualties [14]. It is well known that a negative relationship can be found between curve radius and accident rate on sharp curves, especially run-off-the-road accident rate [15]. Therefore, further studies are needed about the essential factors leading to crashes on curves, such as poor lane position of vehicles [16]. Many studies have successfully applied lane position as an important index of drivers' behavior to evaluate the safety of a sharp curve [10, 17]. So this paper took vehicles' lane position as the main indicator to analyze and evaluate the safety impact of warning sign position and sharp curve on diving behavior.
As an extension of previous researches, this paper conducted a driving simulator experiment to locate the optimal position of warning signs on sharp curves. Meanwhile, this study also analyzed drivers' dynamic behaviors and evaluated the driving safety in different sign positions on the perspective of road traffic safety. It is a better choice to use a simulation experiment in this study due to three main advantages: (1) keeping all trials under the same conditions; (2) making an experiment repeatable; (3) protecting participants from risk.
2. Methods
2.1. Participants
Thirty male participants were recruited by announcement in order to avoid the influence of gender difference on results. Another reason is that female drivers take only a small proportion in all licensed drivers in China [18]. All drivers possessed their licenses for at least two years (average = 3.28, SD = 1.15). The age of test drivers ranged from 20 to 29 (average = 26.3, SD = 2.13). None of the subjects suffered color vision deficiencies, and all of them were reported to have normal or corrected-to-normal vision.
2.2. Apparatus
The experimental apparatus was the AutoSimAS simulation system in Beijing University of Technology, as shown in Figure 1. The hardware consisted of a renovated vehicle, eight networked computers (one is the master computer; one possessed a connection with the vehicle system, and the other six are used to display six different real-time views), a motion control device, and other equipment (such as videos and audio devices). In addition, there are three main types ofsoftware for the simulation experiment: Evariste (for creating experimental scenarios), Simword (for controlling scenarios), and Scancer (for collecting data and generating car motion). During the experiment, the simulator can record data such as action of the accelerator/brake pedal, steering wheel, and vehicle speed. The frequency of recording is 30 Hz.

Driving simulator with example view.
2.3. Experimental Scenario
This experiment had two independent variables. One is position of a warning sign prior to a curve entry (the main variable with five levels of 0 m, 50 m, 100 m, 200 m, and 400 m) and the other is curve radius (the secondary variable with five levels of 20 m, 30 m, 40 m, 50 m, and 60 m). To ensure the differences of driving performance are only caused by one/both of the two variables, the roads in scenarios were all single-lane rural roads (the lane width was 3.5 m) and were devoid of other traffic.
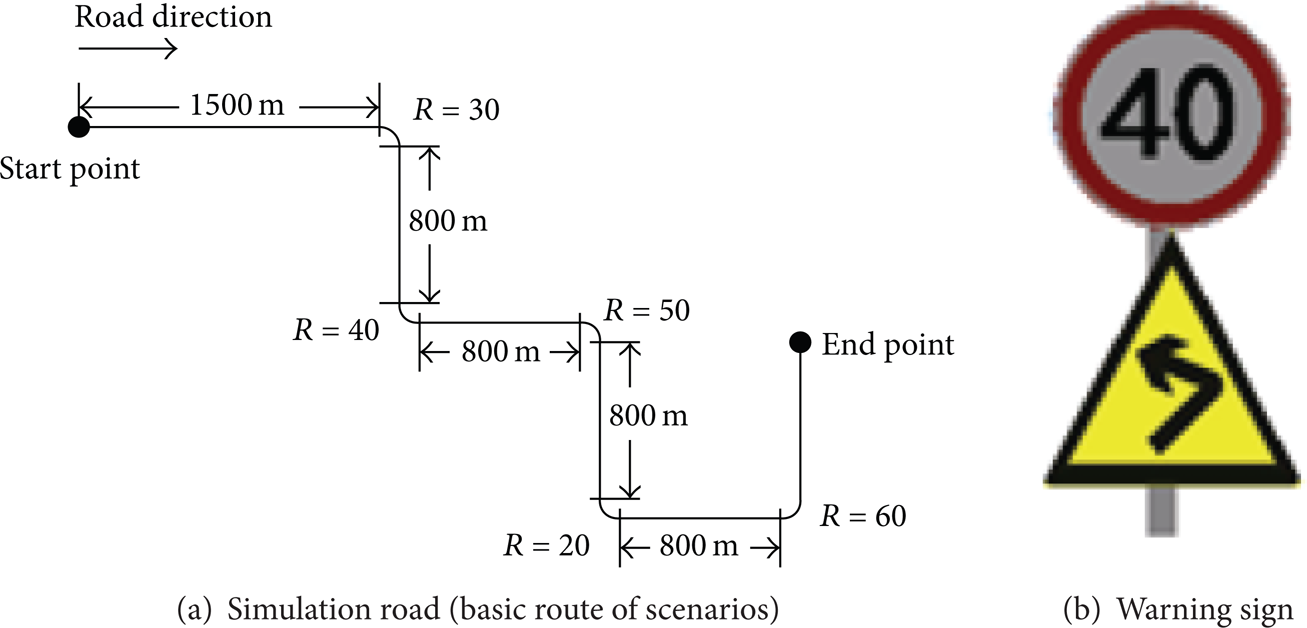
Five scenarios were designed for the formal experiment (A, B, C, D, and E), as shown in Table 1. All scenarios shared the same basic route (Figure 2(a)). In the basic route, five curves had different radii (30 m, 40 m, 50 m, 20 m, and 60 m in the direction) and all tangent sections, except the first one, were 800 m in length prior to the curve (shown in Figure 2). All participants drove in the same direction.
Position of warning signs of each curve in different scenarios (in meters).

Experiment scenario.
Based on the two independent variables, this study had a 5 (sign positions of 0 m versus 50 m versus 100 m versus 200 m versus 400 m) × 5 (curve radii of 20 m versus 30 m versus 40 m versus 50 m versus 60 m) experimental design. Twenty-five kinds of different combinations of the two independent variables were produced in total. Therefore, each of the five virtual scenarios had five different combinations of sign positions and curve radii, as shown in Table 1. As a result, every combination in five scenarios was driven for the same repeated times by drivers.
In Table 1, the first column (20, 30, 40, 50, and 60) was the five radii of the curves, and the first row (scenarios A, B, C, D, and E) represented different scenarios. In scenario A, the value “50” meant that a warning sign was placed 50 m prior to a curve with a radius of 40 m.
In previous researches, the lane position of a driver with normal sight varies with roadway curvature for safety. For example, people drive close to the center of the lane on tangents but move to a leftward position in left curves and vice versa [19]. It is safe for a vehicle to be close to the inside boundary of a curve. Besides, the formal test road was a single-lane road in the experiment. Taking the two reasons into consideration, lane position was defined as the vertical distance from the vehicle center in motion to the curves' inside boundary (inside boundary meant left boundary in left curves and right boundary in right curves), as illustrated in Figure 3(a). When lane position is in the range of 0–3.5 m, the smaller a vehicle's lane position is, the safer it is for the driver. Meanwhile, run-off-the-road crashes denoted a driver's failure in controlling vehicles' lateral movement. A run-off-the-road crash would be recorded as long as a driver rushed out of the curve in the formal experiment.

Subject investigated in experiment.
This paper analyzed the section of point “a” (the point that is 600 m prior to the entry point of a curve) to point “b” (the exit point of a curve). The corresponding location number of the section ranged from 1 to 17. The section was divided into twelve segments in tangents and five segments in the curve section equally, as shown in Figure 3(b).
2.4. Experimental Procedure
This experiment included two phases: the driving capability test and the formal experiment. The driving capability test aimed to minimize individual differences. First, all the participants drove three times in the test scenario and their driving data was recorded. According to each driver's average speed in the tangent sections, the speed difference between the maximum and the minimum speed was used to reflect the driver's respective driving capability. Correspondingly, thirty participants were divided into three groups based on the results of driving capability test, with 10 participants in each group. Finally, researchers randomly chose six drivers, two from each group, to form a new group. In this way, we set five groups (named G1, G2, G3, G4, and G5) corresponding to the five scenarios (A, B, C, D, and E).
The formal experiment took three main steps as follows.
General instruction: participants were informed that the task was to drive on a road with traffic signs prior to curves. Besides that, they did not get any other information about the scenarios (length of the road, curve radius, position of traffic signs, etc.).
Pretest driving: before the formal driving, participants were allowed 5–10 minutes to practice driving in a test scenario.
Formal driving: to avoid any extreme data, each participant would drive five times in the same scenario. After driving for about five minutes, participants had a two-minute rest before next driving.
3. Results
According to the experiment, the two independent variables are confirmed: positions of advance warning signs and curve radii. The dependent variables are defined as follows.
LP-AV: LP-AV is abbreviation to average lane position.
LP-SD: LP-SD is abbreviation to average standard deviation of lane position.
TC: TC is abbreviation to the total number of run-off-the-road crashes of each kind of warning sign position. When a driver rushed out of a curve in the formal experiment (LP-AV < 0 m or LP-AV > 3.5 m), it would be recorded.
3.1. Influence Ranges of Different Warning Sign Positions
The speed in 1–12 segments was analyzed to find out the accurate point from which drivers were influenced by warning signs placed in different distance. What is more, the speed was standardized so that the change of speed can be underlined under the influence of warning signs placed at different distance.
From the variation of standardized speed in 1–12 segments (in Figure 4), it can be seen that all of the five standardized speed profiles possessed the maximum value and the character of downward parabola.
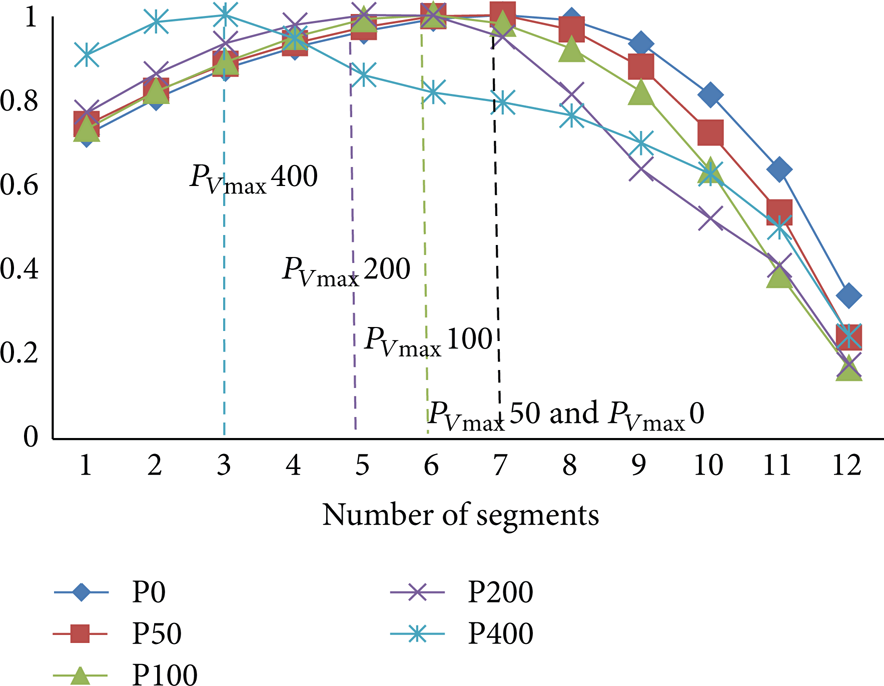
Standardized speeds of different warning sign positions in 1–12 segments.
Results of analysis of variation (ANOVA) showed that the maximum speed (Vmax ) in 1–12 segments was significantly affected by different warning sign positions (F(4,145) = 13.132, P < 0.05). The position number of the maximum speed was abbreviated to PVmax , which was defined as the starting point from which the driver was affected by an advanced warning sign. In other words, drivers began to slow down in the position where they could see the warning sign.
The section influenced by positions of warning signs was defined as the whole section (numbered from PVmax –17). Moreover, this paper used P0, P50, P100, P200, and P400 to represent a warning sign placed 0 m, 50 m, 100 m, 200 m, and 400 m prior to curves. Thus, the different influence ranges of warning signs in five positions were shown in Table 2.
Influence ranges of different warning signs positions on the drivers.
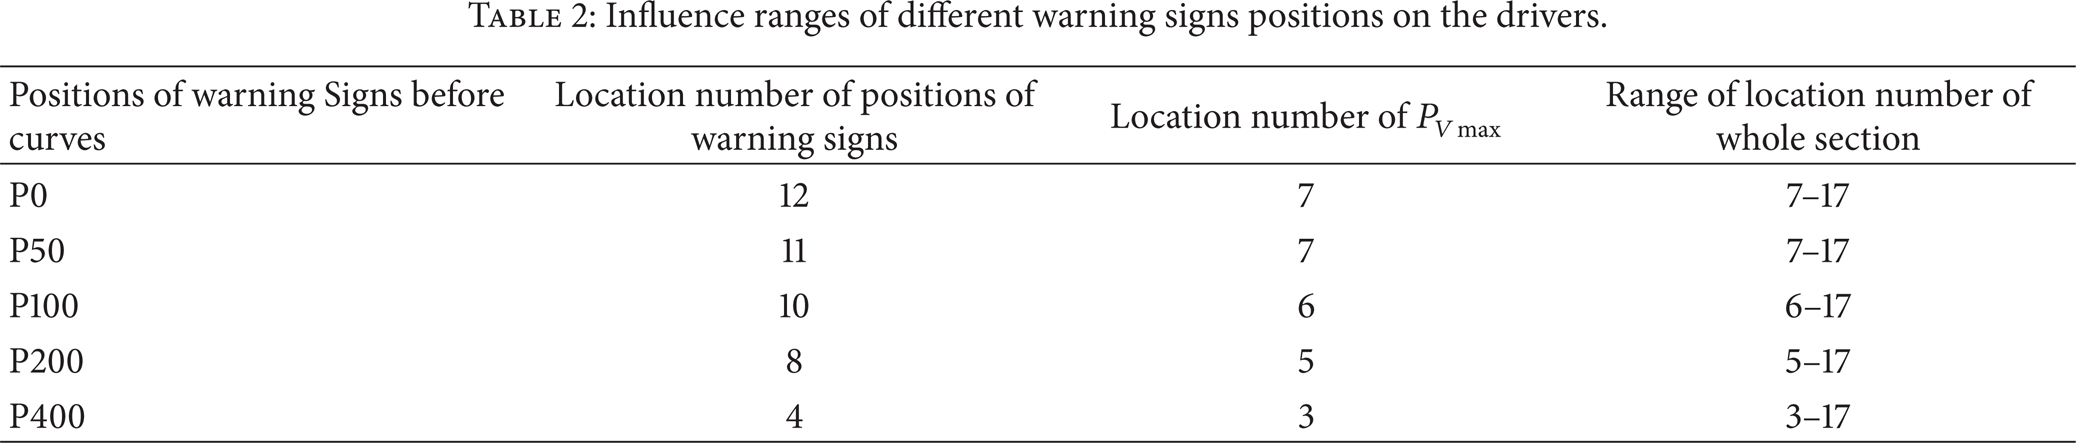
The whole section consisted of the tangent (numbered from PVmax –12) and the curve section (numbered from 13 to 17). The data in tangent and curve section of whole section was analyzed and compared in the following content, according to the influence ranges of different warning sign positions.
3.2. Average Lane Position
Figure 5 showed the average lane position in five different warning sign positions. In Figure 5, the LP-AV profile of tangent indicated a slight increasing trend from P0 to P400 as a whole. Namely, the LP-AV of tangents was closer to 1.75 m, when drivers drove on the road with a warning sign placed (400 m) farther from the entry of a curve. Compared with the tangents, it was obvious that the LP-AV of curve sections was lower and the vehicle was closer to the inside boundary. Drivers owned lower LP-AV in curve sections when a warning sign was placed at 100 m and 200 m prior to curve. Moreover, the LP-AV profile of curve sections was more variable than tangent. This meant the LP-AV of curve sections was apparently influenced much more by warning sign positions than that of tangents.

LP-AV in tangents and curve sections.
Results of ANOVA of five kinds of warning signs positions showed no significant effects on vehicle's LP-AV in tangents (F(4, 145) = 1.531, P = 0.197) and curve sections (F(4, 145) = 1.620, P = 0.173). Therefore, it denoted that warning sign positions only influenced the average trend of the LP-AV in tangents and curve sections.
3.3. LP-AV in Key Points of Sharp Curves
Through the experiential data of the five scenarios, the LP-AV in each of the four key points (50 m point prior to curve, curve entry point, midpoint, and curve exit point) was calculated. In Figure 6, different warning sign positions led to the various differences of LP-AV in the four key points. Generally, it can be seen that the LP-AV of five positions was similar at the 50 m point prior to curve and curve entry point. The contrast of the LP-AV of five warning sign positions rose to the summit at the curves' midpoint.

LP-AV of different warning sign positions in four key points of sharp curves.
Under the influence of five differently positioned warning signs, the five profiles presented two types; (1) P0, P50, and P400 and (2) P100 and P200. The minimum LP-AV of P0, P50, and P400 was at curve entry point, while that of P100 and P200was at midpoint. Warning signs placed in 100 m and 200 m before curves resulted in a lower LP-AV value at midpoint than the others, which indicated that drivers tended to moderate vehicle's lane position to more safe status.
There are no significant effects on vehicle's LP-AV at 50 m point prior to curve, curve entry point, and curve exit point (P > 0.05). However, warning sign positions' effect on LP-AV was significant at curve midpoint (F(4,143) = 39.96, P < 0.05). This might be caused by more dramatic differences of LP-AV of five warning signs positions at the curve midpoint.
3.4. Standard Deviation of Lane Position
Figure 7 showed the average LP-SD under the influence of five kinds of warning sign positions. For example, the value “0.72” meant that the average LP-SD of curve sections was 0.72 in P0. It is the highest value among the average LP-SD of five positions, indicating that drivers had a dramatic adjustment of the vehicle's LP in curves under the influence of P0. Besides, the LP-SD of curve sections in P100 was the lowest.

LP-SD in tangents and curve sections.
The profile of LP-SD in tangents indicated a stable trend as a whole, with LP-SD of P100 as the maximum value. It can be seen that drivers would beforehand adjust the vehicle's LP in tangents under the effect of a warning sign located at 100 m in advance, which could reduce risks on curves.
Compared with the average LP-SD of tangents, the average LP-SD of curve sections was higher and the LP-SD profile in curve sections presented a bigger difference among the LP-SD of five positions. This indicated that different positions of a warning sign before a sharp curve have an effect on drivers' adjustment amplitude of lane position of vehicles in curve section. Drivers will make a marked adjustment in sharp curves.
Results of ANOVA of five kinds of warning signs positions showed no significant effects on vehicle's LP-SD in tangents and curve sections. But it depicted that the LP-SD in tangents was significantly affected by the interaction effect of sign positions and curve radii (F(4,145) = 1.793, P < 0.05). Such an influence may be caused by drivers' sight distance. Since drivers could see a curve ahead on tangents, they would be affected by interaction effect of sign positions and curve radii.
3.5. The Total Number of Run-Off-the-Road Crashes of Each Kind of Warning Sign Position
The TC corresponding to five warning sign positions was described in Figure 8. The value “51” in the figure meant that the total number of run-off-the-road crashes was 51 under the influence of a warning sign placed at P0.

TC of different sign positions.
In Figure 8, the TC was relatively higher when warning signs were placed at 0 m and 50 m prior to curves. The profile showed that the longer the distance between the warning sign and the entry of curve is, the more it helped to reduce risks of run-off-the-road crashes within 200 meters. So a warning sign located at P200 could bring about the lowest rate of run-off-the-road crashes. The TC of warning signs located at the farthest position had a little increase compared with the P200's. Above all, Figure 8 indicated that driver's safety would be improved if a warning sign was placed at least 100 m from the curve entry.
4. Evaluation of Effects of Different Warning Sign Positions
As mentioned above, the objective of this paper was to discuss the driver's safety in sharp curves related to different warning sign positions. Besides, in many researches, LP at curve midpoint was taken as an important measurement to measure drivers' safety in sharp curves. Therefore, LP-AV in the midpoint of sharp curves, together with TC, LP-AV in curve sections, and LP-SD in curve sections were selected for evaluation of effects of warning sign positions in this paper.
Table 3 revealed results of four indexes under the influence of different sign positions. Table 4 summarized and ranked the potential safety advantages in terms of the four indexes. Number 1 to 5 on the list represented the range from the best to the worst. For example, the closer the vehicle was to the inside boundary in curves, the safer it was for drivers. Therefore, the rank of LP in curve sections of P0, P50, P100, P200, and P400 should be 3, 5, 1, 2, and 4, as exhibited in Table 4.
Results of four indexes of five warning sign positions.

The rank ordering of safety advantages of five warning sign positions.

In Table 3, P0 and P50 possessed the relatively higher crash rates and farther distances from the inside boundary. Drivers also did not perform well when the warning sign was located at 400 m before a curve, even though its TC was smaller than the former two. Thus, the ranks of P0, P50, and P400 were lower (Table 4). Compared with the other three, drivers under the influence of the warning sign located at 100 m and 200 m had a better performance in the occurrence of run-off-the-road crashes and maintained a more stable lane position of vehicle, as shown in Table 3. Moreover, drivers appeared to meet all targets needed and managed to improve vehicle state when driving through sharp curves.
To obtain the final safety evaluation result, this paper provided a new rank by reordering the average value of four indexes for each kind of sign position. Thus, the final rank of P0, P50, P100, P200, and P400 was 4, 4, 1, 2, and 3, as shown in Table 4. The warning sign located at 100 m or 200 m prior to the sharp curves imposed positive influences on driving behavior.
5. Discussion
The summary of ANOVA results was shown in Table 5. In the table, “√” means that an independent measure has a statistically significant effect on a dependent variable; “*” denoted that an independent measure only influences the average trend of a dependent variable.
Results summary of analysis of variance.
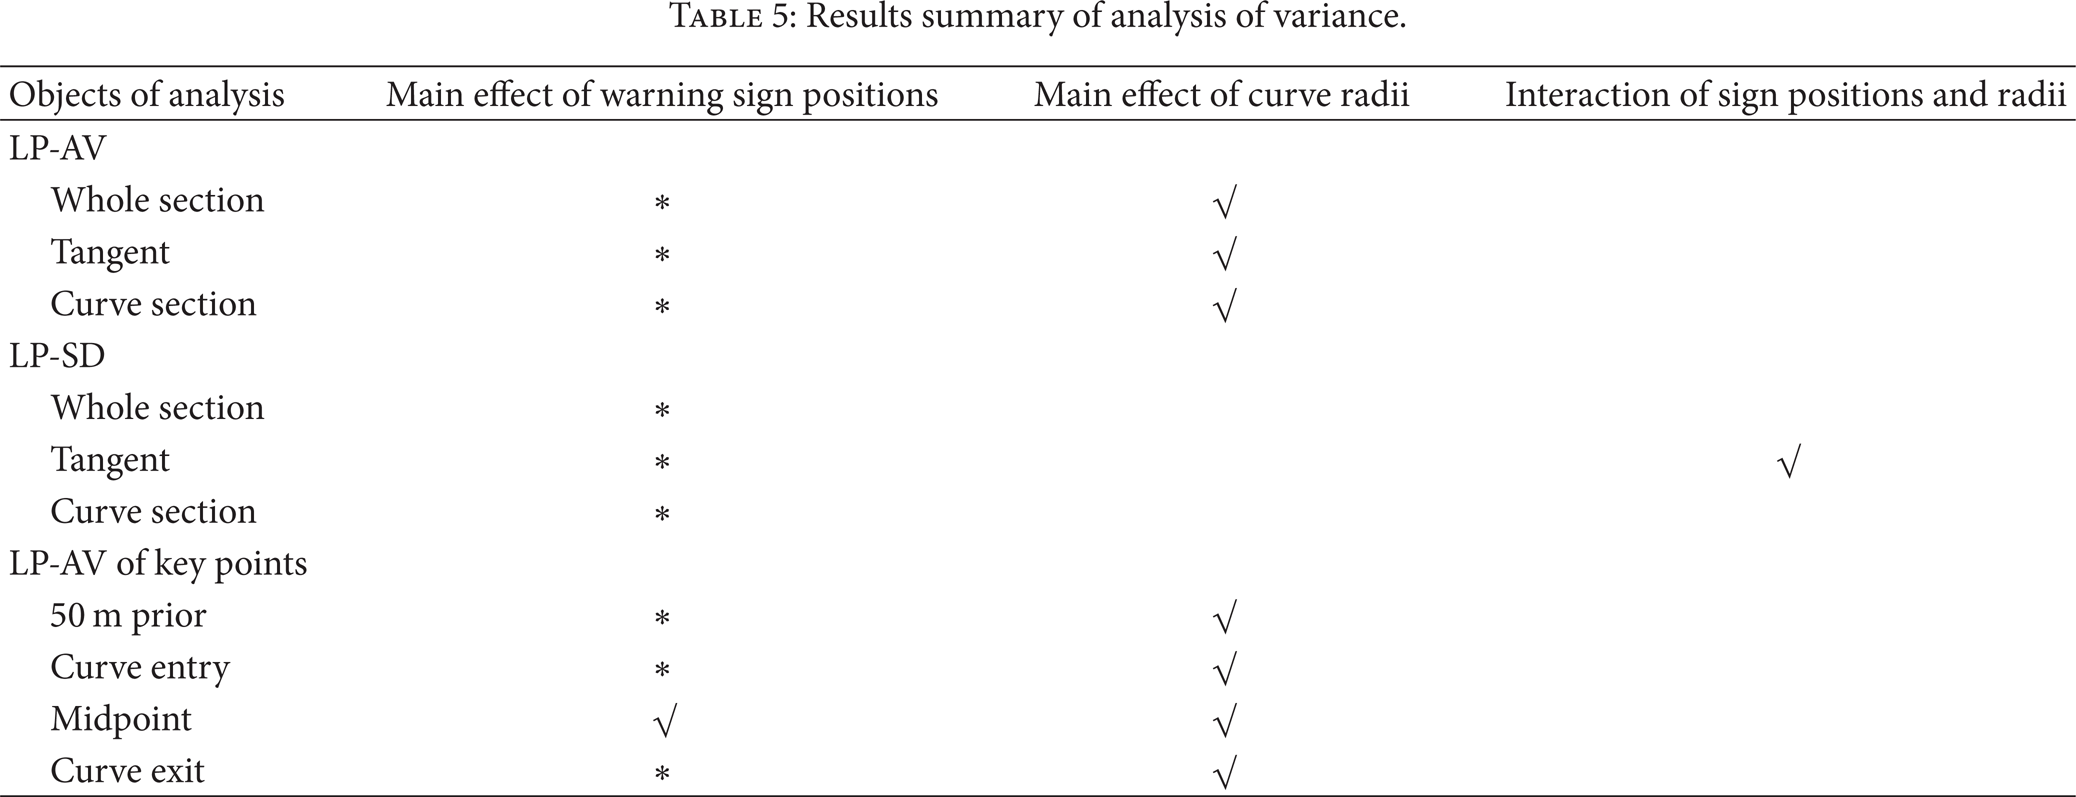
Table 5 showed that dependent measures were largely affected by the curves' radii other than warning sign positions. It has been carried out that the greater the severity of the curve is, the more it affects driving behaviors [20]. Therefore, the main effect of warning sign positions in statistical analysis may be covered by the influence of sharp curve radii (ranging from 30 m to 60 m) in this experiment.
ANOVA results showed that the LP-SD in tangent was significantly affected by the interaction effect of sign positions and curve radii. The interaction should be considered when workers place a warning sign before sharp curves.
Statistical analysis of four key points in sharp curves showed that only on a curve's midpoint drivers would be significantly influenced by sign positions. This was possibly caused by the contrast value of LP of five warning sign positions reaching the summit at the curve's midpoint, as shown in Figure 6. Combined with other studies' findings, lane position toward the inside road boundary was safer when drivers were negotiating curves. This paper had the similar result, as shown in Figure 5.
In addition, this paper further used t-test to observe the difference of LP-AV in tangents between the group of P0, P50 and the group of P100, P200, and P400. t-test result showed significant difference between the two groups (t = − 2.201, P < 0.05). It indicated that vehicles' LP-AV in tangents prior to sharp curves would be obviously influenced by positions of a warning sign. Compared with another group, the group representing longer distance from a warning sign to a sharp curve would make drivers drive more closely to the center line in tangents prior to sharp curves. Drivers would drive closely to the inside boundary in tangents under the influence of the group of P0, P50.
Run-off-the-road crashes indicated that the participants failed to adjust lane position of the vehicle while passing sharp curves with different warning sign positions. Results revealed that drivers under the influence of a warning sign located at 0 m or 50 m prior to the sharp curve had a higher crash rate, which might be caused by the limiting time of warning for drivers and the drivers' inappropriate response to unexpected road ahead. Drivers at P400 also had a poor performance (see Tables 3 and 4). It was possibly because the far distance from the warning sign to curve entry made drivers gradually lose the memory of the hazard ahead and lower their alertness. As a result, analysis of safety advantages in each position showed that the warning sign located at P100 or P200 did achieve a more positive effect on reducing the rate of run-off-the-road crashes and on improving the vehicle's lane position.
6. Conclusion
This paper briefly evaluated drivers' safety advantages under different positions of a warning sign before sharp curves with driving simulator. This study concluded the following.
A warning sign placed at different positions prior to a sharp curve will have different influence ranges for drivers approaching and negotiating the curve.
Warning sign position has an effect on drivers' lane position of vehicles in tangents before sharp curves. A warning sign located at 100 m, 200 m, or 400 m prior to sharp curves would make drivers drive more closely to the center line in tangents, compared with a warning sign located at 0 m or 50 m.
Different positions of a warning sign before a sharp curve influence the driving behavior in curve section. The vehicle is nearer to the inside boundary while drivers are driving through the sharp curves, especially at curve's midpoint. Warning sign position also has an effect on drivers' adjustment amplitude of lane position of vehicles in sharp curves. Meanwhile, reasonable position of a warning sign prior to a sharp curve can effectively reduce run-off-the-road crashes.
In conclusion, a warning sign located at 100 m to 200 m prior to a sharp curve can produce a significant positive influence on driving behavior. There is the optimal placement for a warning sign prior to a sharp curve within the range of 100–200 m.
This paper mainly aims at providing suggestions for engineering application in China. The results of this paper may be applied in other countries which have the similar situation with China, such as the proportion of low grade roads, sex ratio of drivers, driving habits, and other driving characteristics.
The experiment has some apparent advantages in the aspects of controlling factors and experimental conditions. In addition, there are some differences between the absolute speed value and the actual path during the driving process, because simulation is different from the real environment. However, the effectiveness has been proved by previous studies [21]. In order to expand the scope of application, researchers will study the optimization of positions of a warning sign on general curves with larger radii in the future.
Conflict of Interests
The authors declare that there is no conflict of interests regarding the publication of this paper.
Footnotes
Acknowledgments
This study is supported by the NNSFC (National Natural Science Foundation Of China) project: The Study of the Mechanism for Traffic Signs Influence on Driving Behavior and Its Cognitive Model, no. 51108011; and BJNSF (Beijing Natural Science Foundation) project: The Study of Identification Method of Drunk Driving Based on Driving Behavior of Driving Personal Character, no. 8112004.