
Abstract
Experimental investigation on forced convection heat transfer is applied to vehicles’ radiator filled with AL2O3 water nanofluid with different concentrations: 0.1%, 0.5%, 1%, 1.5%, and 2% by volume. The experiments are done for three cases, each case corresponds to different heat load, coolant flow rate, and air flow rate to simulate the vehicle engine cooling system at various loads relevant to the cooling system of Toyota Yaris 2007. The coolant and air heat transfer coefficients, Nusselt numbers, heat rate lost by the coolant and absorbed by the air, heat exchanger effectiveness, overall heat transfer coefficients, Reynolds number, and the pumping power are calculated. Log mean temperature difference (LMTD) and effectiveness-number of transfer units (ε-NTU) are used to determine the outside air heat transfer coefficient. Results show gradual enhancement in the heat transfer with concentrations 0.1%, 0.5%, and 1% by volume (optimum at 1%); however deterioration occurs at concentrations 1.5% and 2%.
1. Introduction
Cooling is one of the most important technical challenges facing numerous industries such as automobiles, electronics, and manufacturing. New technological developments are increasing thermal loads and requiring faster cooling. The conventional methods in increasing the cooling rate (fins and microchannels) are already stretched to their limits. Hence, there is an urgent need for new and innovative coolants to achieve this high performance cooling. Thermal conductivities of traditional heat transfer fluids, such as engine coolants, are very low. With increasing global competition, industries have a strong need to develop energy efficient heat transfer fluids with significantly higher thermal conductivities than the available fluids. Also, governmental agencies (in some countries) like the Environmental Protection Agency are imposing more stringent criteria for pollution and automobile emissions. The new coolants with their higher thermal performance could reduce the overall size of heat exchanger/radiator and may decrease vehicle fuel consumption. Nanofluids are a novel concept. They are heat transfer fluids containing suspended nanoparticles, which have been developed to meet more demanding cooling challenges. Nanofluids are a new class of solid-liquid composites consisting of nanometer sized (<100 nm) solid particles suspended in heat transfer fluids such as water and ethylene and propylene glycol. Several researchers showed that the convective heat transfer coefficient increases substantially for nanofluids. The heat rejection requirements of automobiles and trucks are continually increasing due to the trends toward more powerful outputs.
Heat transfer directly affects the engine performance, fuel efficiency, materials selection, and emission. The benefits of improved heat exchangers and heat transfer devices using nanofluids are as follows: reduced weight, which will improve fuel economy; smaller components, which take up less room under the hood and allow for greater latitude in aerodynamic styling; more effective cooling, and increased component life. Additionally, mining activities will be lower as less metal is required, minimizing the environmental impact and saving energy in metal production. By reducing the size, the solid waste disposal problem is diminished at the end of the useful life cycle of heat transfer systems. Masuda et al. [1] have obtained improvement in the thermal conductivity and viscosity of liquid by dispersing ultrafine particles and reported that the addition of 4.3 vol.% AL2O3 nanoparticles to water increases the thermal conductivity of the nanofluid by 30%. The use of particles of nanometer dimension was first studied by a research group at the Argonne National Laboratory. Choi and Eastman [2] have shown that the innovative new class of heat transfer fluids can be engineered by suspending metallic nanoparticles in conventional heat transfer fluids. They have also shown that the resulting nanofluids are expected to exhibit high thermal conductivities compared to those of currently used heat transfer fluids. Their theoretical results of the thermal conductivity of nanofluids using copper nanoparticles in water have indicated the potential benefits of using such nanofluids. Choi and Eastman [2] were probably the first (up to our knowledge) who called fluids with particles of nanometer dimensions “nanofluids.” Compared with suspended particles of millimeter-or-micrometer dimensions, nanofluids show better stability and rheological properties and dramatically higher thermal conductivities. Recently, modern technology makes it possible to produce a variety of stabilized nanofluids. Because of their excellent characteristics, the nanofluids find wide applications in enhancing the heat transfer, even for microscale heat transfer as reported by Lee and Choi [3]. Application of nanoparticles provides an effective way of improving heat transfer characteristics of fluids (Eastman et al. [4]). Particles < 100 nm in diameter exhibit properties different from those of conventional solids. Compared with micron sized particles, nanophase powders have much larger relative surface areas and great potential for heat transfer enhancement. Lee et al. [5] worked on 4.3 vol.% AL2O3 nanoparticles in water similar to Masuda et al. [1] but did not find similar enhancement of thermal conductivity. One of the reasons for this behaviour was believed to be the size of the nanoparticles; the size in Masuda's experiment was 13 nm, whereas in Lee's experiment it was 33 nm. Eastman et al. [6] used nanofluid containing 0.3 vol.% copper nanoparticles (Cu) with mean diameter ≈ 10 nm and ethylene glycol as the base fluid. This nanofluid showed a higher thermal conductivity than that of the base fluid. Choi et al. [7] showed that nanofluids have the potential to be the next generation of coolants for vehicle thermal management due to their significantly higher thermal conductivities.
Wang et al. [8, 9] have showed that for louver fin-and-tube heat exchanger configuration, the heat transfer characteristics for multirow coils may benefit from using smaller heat transfer tube especially for frontal velocity of 1.5 m/s. They also proposed a generalized heat transfer correlation for louver fin geometry using conventional fluid. Correlations for predicting the air-side heat transfer coefficient of the automobile radiator, with and without electric field, at frontal air velocity were developed by Vithayasai et al. [10] using water as a coolant medium. Ma and Liu [11] have showed that using nanoliquid metal as a highly conductive heat transfer fluid resulted in a higher radiator temperature, which significantly improved the heat transfer between the radiator and the surrounding air. An experimental study was done on using aluminium oxide nanofluid with various concentrations as a coolant in a diesel electric generator by Kulkarni et al. [12]. They have shown that the efficiency of the waste heat recovery heat exchanger increased for nanofluid, due to its superior convective heat transfer coefficient. An experimental investigation of heat transfer in confined laminar radial flows using alumina/water nanofluid was reported by Gherasim et al. [13]. Their results have shown that heat transfer was enhanced with the use of this type of nanofluid and the mean Nusselt number was found to increase with particle volume fraction and Reynolds number. Recently, Peyghambarzadeh et al. [14, 15] have reported an experimental study on forced convective heat transfer in a water based nanofluid compared to that of pure water in an automobile radiator. Their results have shown that, for fully turbulent regime, application of nanofluid with low concentrations of 1 vol.% can enhance the heat transfer efficiency up to 45% in comparison with pure water.
For the sake of verifying and comparing the present experimental results for pure water the following conventional correlations for predicting the channel heat transfer coefficient for laminar flow are cited.
Sieder-Tate correlation (cited in [16]):

This correlation has been recommended by Whitaker [17] for the value of
Shah and Sekulic correlation (cited in [18]):
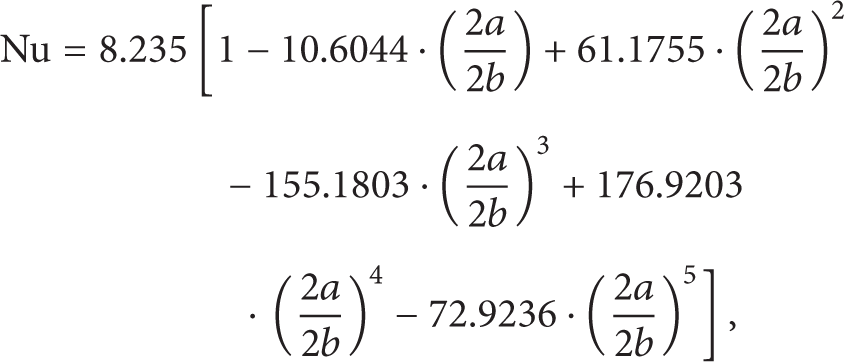
where 2b/2a is the aspect ratio of the channel. This correlation was developed for laminar flow in smooth rectangular channel.
Stephan correlation [19]:

This correlation was developed for laminar flow in circular channel with 0.7 < Pr < 7 or Re·Pr·D/L < 33 for Pr > 7.
Shah and London correlation (cited in [18]):


where 2b/2a is the aspect ratio of the channel. They tabulated the numerical results in terms of z* and the aspect ratio for handling of entrance region effects where the local averaged Nusselt values were put in terms of Taylor series expansion.
Hausen correlation (cited in [16]):

This correlation was developed for laminar flow in circular channel for constant surface (wall) temperature condition.
The current study presents experimental investigation of the forced convection heat transfer through the heat exchangers (car radiator) of Toyota Yaris 2007. In this study nanofluids with five different concentrations are used as a coolant through the inner tubes of the heat exchangers.
2. Experimental Apparatus
Experimental setup was built to study the effect of using Al2O3 water nanofluid as a coolant in vehicle radiators. The main components of the experiment are the vehicle radiator in a closed loop circuit and a variable heat source to simulate the vehicle engine at various loads. Toyota Yaris 2007 cooling system was chosen (engine size/cylinder = 1.3 L/4, fuel: petrol, max output = 62 kW, engine speed for max output (rpm)) because it has a relatively small engine with a cooling system which is easier to simulate. The schematic diagram of the experiment is shown in detail in Figure 1. The coolant is heated with eight heating elements submerged in the heating tank. It is cooled at the plate fin heat exchanger with an expansion tank provided as seen in Figures 2(a), 2(b), and 2(c). Thermocouples and pressure transmitters were installed at different positions in the system to measure the instantaneous local temperature and pressure. Their signals were connected to a data accusation system and stored in a computer with 3 sec intervals (time steps). A small Dc-powered magnetic drive centrifugal pump and Dc-powered fan assembly are provided. The coolant flow rate was measured with the help of a flow meter (combined submerged orifice disk and variable area flow meter). The electrical power to the heaters is measured by a wattmeter and the air velocity is measured by an anemometer. To simulate the vehicle engine at various loads, three heating elements are used with variable coolant flow rates as seen in Table 1. In addition to that five Al2O3-water nanofluid concentrations are used with each load, namely: 0.1%, 0.5%, 1%, 1.5%, and 2% by volume.
Vehicle load simulations.


Schematic diagram of the experimental set-up.

Main components of the experiments. (a) The heaters and their housing presenting the variable power supply, (b) the plate fin heat exchanger (car radiator), and (c) the expansion tank.
3. The Tested Fluid
The alumina nanofluid (Al2O3 dispersed in water) used in the present study is supplied by the Nanostructured and Amorphous Materials, Inc. (USA) in 20% mass concentration form. The manufacturer specifications of this nanofluid are as follows: the average nanoparticle size = 10 nm, dynamic viscosity = 40 CP (at 20°C), and it looks as a transparent liquid with PH value of 4.5 and purity of ≥ 99.9%. The manufacturer nanofluid of 20% mass concentration is diluted to 0.1%, 0.5%, 1%, 1.5%, and 2% by volume using distilled pure water. These new diluted solutions were ultrasonically vibrated for 4 to 6 hours using the ultrasonic vibrator to insure complete dispersion of the nanoparticles. The following equations were used to estimate the nanofluid properties (Williams et al. [20]):

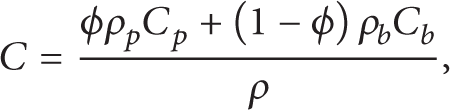
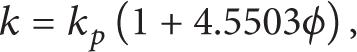

where ϕ is the nanoparticles volumetric concentration. The relation between mass concentration χ and volumetric concentration φ can be estimated from the following equation and from (7):

Nanofluid density is measured using DMA 35N density meter. The conversion between the mass fraction x and the volume fraction ϕ is done through the bulk density of alumina (≈ 3970 kg/m³). The thermal conductivity, expansion coefficient, and specific heat of the nanoparticles are 40 W/mK, 0.0000085 1/K, and 765 J/kg K, respectively (Ghasemi and Aminossadati [21]). It should be noted that the same nanofluid characteristics were used by Ali et al. [22, 23] and Zeitoun and Ali [24, 25] for studying natural convection heat transfer inside vertical circular enclosures heated from below or above and for nanofluid impingement jet, respectively.
4. Experimental Data Analyses
The car radiator used in this study is of louvered fin and flat tube as shown in Figure 3. It consists of 98 vertical tubes made of aluminium, the height of the radiator (tube height) L1 = 0.360 m, the length L3 = 0.632 m, the width (outer tube width) L2 = 0.016 m, the thickness of the fin is t1 = 0.05 mm, the fin height or distance between the coolant passage in the heat exchanger b1 = 5 mm, the fin pitch P f = 1.25 mm, the number of air passages NP1 = 99, the tube thickness t2 = 0.15 mm, and the tube inside length b2 = 1.2 mm. Using the simulated coolant flow rate shown in Table 1 with a total number of 98 tubes, it turns out that the flow rate is laminar inside the tubes. It should be mentioned that the hydraulic diameters of the coolant and air sides are used as characteristic lengths in determining the Reynolds and Nusselt numbers for both coolant and air sides. The coolant side heat transfer rates are given as follows:

Therefore, the inside heat transfer coefficient of the coolant h c can be obtained as follows:

where

where D hc is the hydraulic diameter of the coolant. Furthermore, the physical properties of the coolant are calculated at the mean coolant temperature:

The inside tube thermal resistance of the coolant is defined as R c = 1/(A c h c ). The heat gained by the air can be calculated by

where

It should be mentioned that for an ideal case, the heat released by the coolant should equal the heat absorbed by the air. However, this was never achieved due to many factors as heat leakages and experimental errors. This difference can be put in a heat balance equation (Siddiqui et al. [26]) as follows:

The maximum average heat balance percentages range is 6.95% which is in the acceptable range (±15%) as defined by ASME PCT 30-1991. Since it is hard to measure accurately the surface temperature of the radiator (Peyghambarzadeh et al. [14]), the overall heat transfer coefficient is calculated by two different procedures to analyze the performance of the car radiator at the air side. The first method is the log mean temperature difference (LMTD) and the second is the effectiveness-NTU approach. Since the overall heat transfer coefficient U obtained by both methods should be equivalent then a comparison will be made between them to see the percentage experimental error.

Schematic diagram of the louvered fin car radiator showing the dimensions and the number of tubes.
4.1. Log Mean Temperature Difference (LMTD) Method
The performance of the car radiator is analyzed using the log mean temperature difference method defined as follows:

where U is the overall heat transfer coefficient, A is the surface area, and F is the correction factor applied to the value of ΔTlm that is computed under the assumption of counter flow conditions. Consider the following:
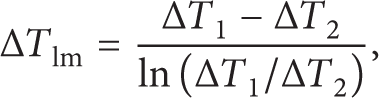
where ΔT1 = Tc i − Ta o , ΔT2 = Tc o − Ta i , and the correction factor is defined by [27]

where R and S are defined as

Then the overall heat transfer coefficient is obtained by using (19), (20), and (21) as follows:

It should be mentioned that if A is used either as the total coolant inner surface area of the tubes or the total outer surface area for the air side then the obtained U presents the coolant side or the air side overall heat transfer coefficient, respectively. Using the air side overall heat transfer coefficient, then the outside (air) heat transfer coefficient can be obtained as follows:

where Rcond = t2/kAcond is the tube material resistance and Acond is the normal area used in Foureir's law and given by

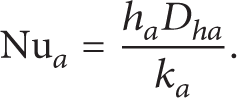
Other symbols are given in Figure 3. Therefore, the outside air Nusselt number can be given as
The radiator effectiveness is defined as follows:

where qmax is the maximum heat transfer rate that could possibly be delivered by the radiator and is defined as follows:

where C min is the minimum heat capacity rate. The pumping power of the coolant can be obtained from the pressure loss of the coolant across the radiator as follows:
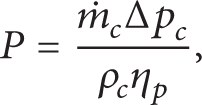
where the coolant pressure loss Δp c is defined as
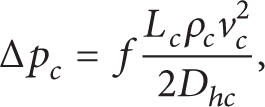
where f is the friction factor.
4.2. The Effectiveness-NTU Approach
The overall heat transfer coefficient U is obtained using the following relationship of effectiveness ε and the number of heat transfer units (NTU) (Kays and London [28]) for mixed unmixed fluids. Consider the following:

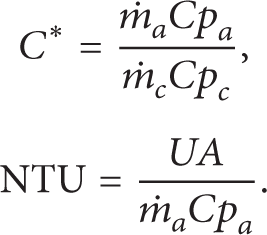
Using (27), (31), and (32), the overall heat transfer coefficient UA can be obtained. Following (24), (25), and (26), the air side Nusselt number can be obtained.
5. Experimental Uncertainty
The experimental uncertainty in the calculated results is estimated on the basis of the uncertainties in the primary measurements. The temperatures are measured by thermocouple with accuracy of ±0.75°C. All used thermocouples were thoroughly calibrated by the use of constant temperature water bath. The pressure transducers or pressure transmitter sensors (Silicon on Sapphire (SOS), PXM 4202-010BG5V) with accuracy ±0.25% of full scale and 10 ms response time as provided by the manufacturer (Omega, USA) were calibrated by the factory with accuracy of 0.0015 bar. The flow rate was calibrated by a stop watch and graduated container with the accuracy of ±0.375 LPM taken from the manual. The velocity of air through the radiator was measured by anemometer with accuracy of ±0.0567 m/s taken from the manual. The accuracy in measuring the voltage is taken from the manual of the wattmeter as 0.5% of the reading ±2 counts with a resolution of 0.1 V and the corresponding one for the current is 0.7% of reading ±5 counts + 1 mA with a resolution of 1 mA. Error analyses are carried out by calculating the measurement error following the standard normal distribution curve (Gaussian). At each experimental run, three hundred scans of each sensor were made by the data acquisition system and uncertainties are calculated for each primary measurement. Using the above mentioned errors turns to maximum itemized uncertainties of calculated results shown in Table 2 using the method recommended by Moffat [29]. The experimental repeatability is checked using load one for pure water and it is found to be 8%.
Experimental uncertainty.

6. Results and Discussion
6.1. Pure Water Coolant
Before conducting experiments on nanofluid in the radiator, some experiments are done with pure water as a coolant in order to check the reliability, accuracy, and repeatability of the experimental setup and also to be used as a reference for the following experiments. The temperature of the coolant entering the radiator is about 97°C and that of the outlet is about 86°C (with ΔT≅11°C) for all three loads shown in Table 1 which is about the same as that in the original cooling system of Toyota Yaris. Comparison is made between the experimental data for pure water and five well-known empirical correlations as shown in Figure 4, these five relations are presented by (1), (2), (3), (4), and (6). In Figure 4 reasonably excellent agreement is clearly seen between Sieder-Tate (cited in [16]) and Shah-Sekulic [20] correlations with the experimental data for pure water for three loads shown in Table 1 with absolute average error within ±5%. The comparison with the other correlations presented by Stephan [19], Shah-London [20], and Hausen (cited in [16]) also agreed very well with the present experimental data and is with absolute average errors + 20%, −18%, and + 15%, respectively.

Experimental results for pure water in comparison with existing literature.
6.2. Nanofluid Coolant
Figure 5 shows the rate of lost heat transfer from the coolant and that gained by the air for three different loads as shown in Table 1 versus the nanofluid concentrations. This figure shows that the heat released from the radiator increases as the nanofluid volume fraction increases up to a specific value then decreases. The reason for that could be attributed to increasing the thermal conductivity as the volume fraction increases, which increases the heat transfer from the coolant to the surrounding fins then to the air. However, as the volume fraction increases more the viscosity of the coolant increases too therefore, it will be a competition between increasing both the thermal conductivity and the viscosity. High viscosity of the nanofluid makes the random motion of the nanoparticles in the fluid (Brownian motion) disappear [30] and it is believed that the enhancement of the thermal conductivity is indirectly function of Brownian motion [31–34] consequently, the heat released from the radiator decreases. It is also remarkable that the optimum volume fraction occurred at 1% where the heat released reaches its maximum. The vertical dashed line connects the locus of these maximums at different loads. It should be noted that the air side Reynolds number is constant at each load and unaffected by the variation of nanoparticles volume fraction. The percentage increase of the coolant heat transfer is shown in Table 3 for different loads and concentrations. This table shows that the maximum increase of Q c is 14.79% which occurs at load 1 and at ϕ = 0.01. Figure 6 shows the coolant heat transfer coefficient for three different loads. It is clear that for any fixed load, the maximum heat transfer coefficient occurs at 1% concentration of nanofluid and it increases as the load increases. The horizontal dashed lines show the corresponding values of heat transfer coefficient at the base fluid (pure water) of zero concentration for comparison with the other concentrations corresponding to each load. Figure 7 shows the Nusselt number of the coolant for three different loads versus coolant Reynolds number. The Nusselt number profiles increase up to a maximum then deteriorate as the concentration increases for the same reasons described earlier in Figure 5. Table 3 shows the percentage increase of the coolant heat transfer coefficients h c and Nu c over that of pure water at different nanofluid concentrations. Both h c and Nu c reach their maximum values of 14.72% and 9.51%, respectively, at load 1 for concentration ϕ = 0.01. Furthermore, the overall heat transfer coefficient obtained by either (23) or (32) corresponds to LMTD or NTU method, respectively; using the surface area of the coolant side is shown in Figure 8. This figure shows a good matching between the two methods of calculation with minimum errors appearing at higher loads. It also shows that the maximum value occurs at 1% concentration of nanofluid. Similar results are obtained for the overall heat transfer coefficient using the air surface area in (23) and (32) as seen in Figure 9. It should be noted that the overall heat transfer coefficient on the air side is much lower than that of the cooling side because of the large surface area involved at that side. Results also confirm the compatibility of using the LMTD or the NTU method in calculating the overall heat transfer coefficient. Figure 10 shows the air side heat transfer coefficient h a for three different loads using the two different approaches for different concentrations. It is clear that the heat transfer coefficient increases as the nanofluid concentration increases up to ϕ = 0.01 then it decreases as ϕ increases for each load. Table 4 shows the percentage increase of the outside air heat transfer coefficients h a and Nu a over that for pure water at different nanofluid concentrations using the LMTD and the NTU method. This table shows that the numerical values for h a and Nu a are almost matching for both methods and they reach their maximum values of 14.45 and 13.94, respectively, at load 1 for ϕ = 0.01 using the NTU method. Figure 11 shows the increase of the air side Nusselt number for various concentrations and loads using the two different approaches LMTD and NTU. This figure indicates that the maximum Nu a occurs at ϕ = 0.01 for each load and deteriorates as the nanofluid concentration increases. Figure 12 shows a comparison between the Nusselt number of the coolant and air side at different loads and nanofluid concentrations. It is clear that the coolant side Nu c is higher than that of the air side. Figure 13 shows the Reynolds number profiles for different loads and concentrations for the air and coolant. It should be noted that the volume flow rate of the coolant is fixed for each load but it differs from load to load as seen in Table 1. The effectiveness of the radiator is shown in Figure 14 where it increases as the nanofluid concentration increases up to a maximum value at ϕ = 0.01 than it decreases as ϕ decreases for each load. The coolant pumping power at different concentrations and loads is shown in Figure 15 where it increases as the concentration increases due to the increase in pressure loss for fixed load and it also increases as the load increases.
Percentage increase of h c and Nu c for different nanofluid concentrations ϕ at different loads.

Percentage increase of h a and Nu a for different nanofluid concentrations ϕ using LMTD and NTU methods at different loads.


Heat transfer rate from the coolant at different loads for different volume fraction. Nanofluids showing the optimum volume fraction where heat transfer rate is maximum.

Coolant side heat transfer coefficient at different loads showing the optimum at ϕ = 1%. Dashed lines showing values at pure water.

Coolant side Nusselt number verses Reynolds number for three loads at different concentrations showing the optimum values.

The coolant side overall heat transfer coefficient using two different approaches at three different loads showing the optimum at ϕ = 1%.

The air side overall heat transfer coefficient using two different approaches at three different loads showing the optimum at ϕ = 1%.

Air side heat transfer coefficient at different loads using two different approaches showing the optimum at ϕ = 1%.
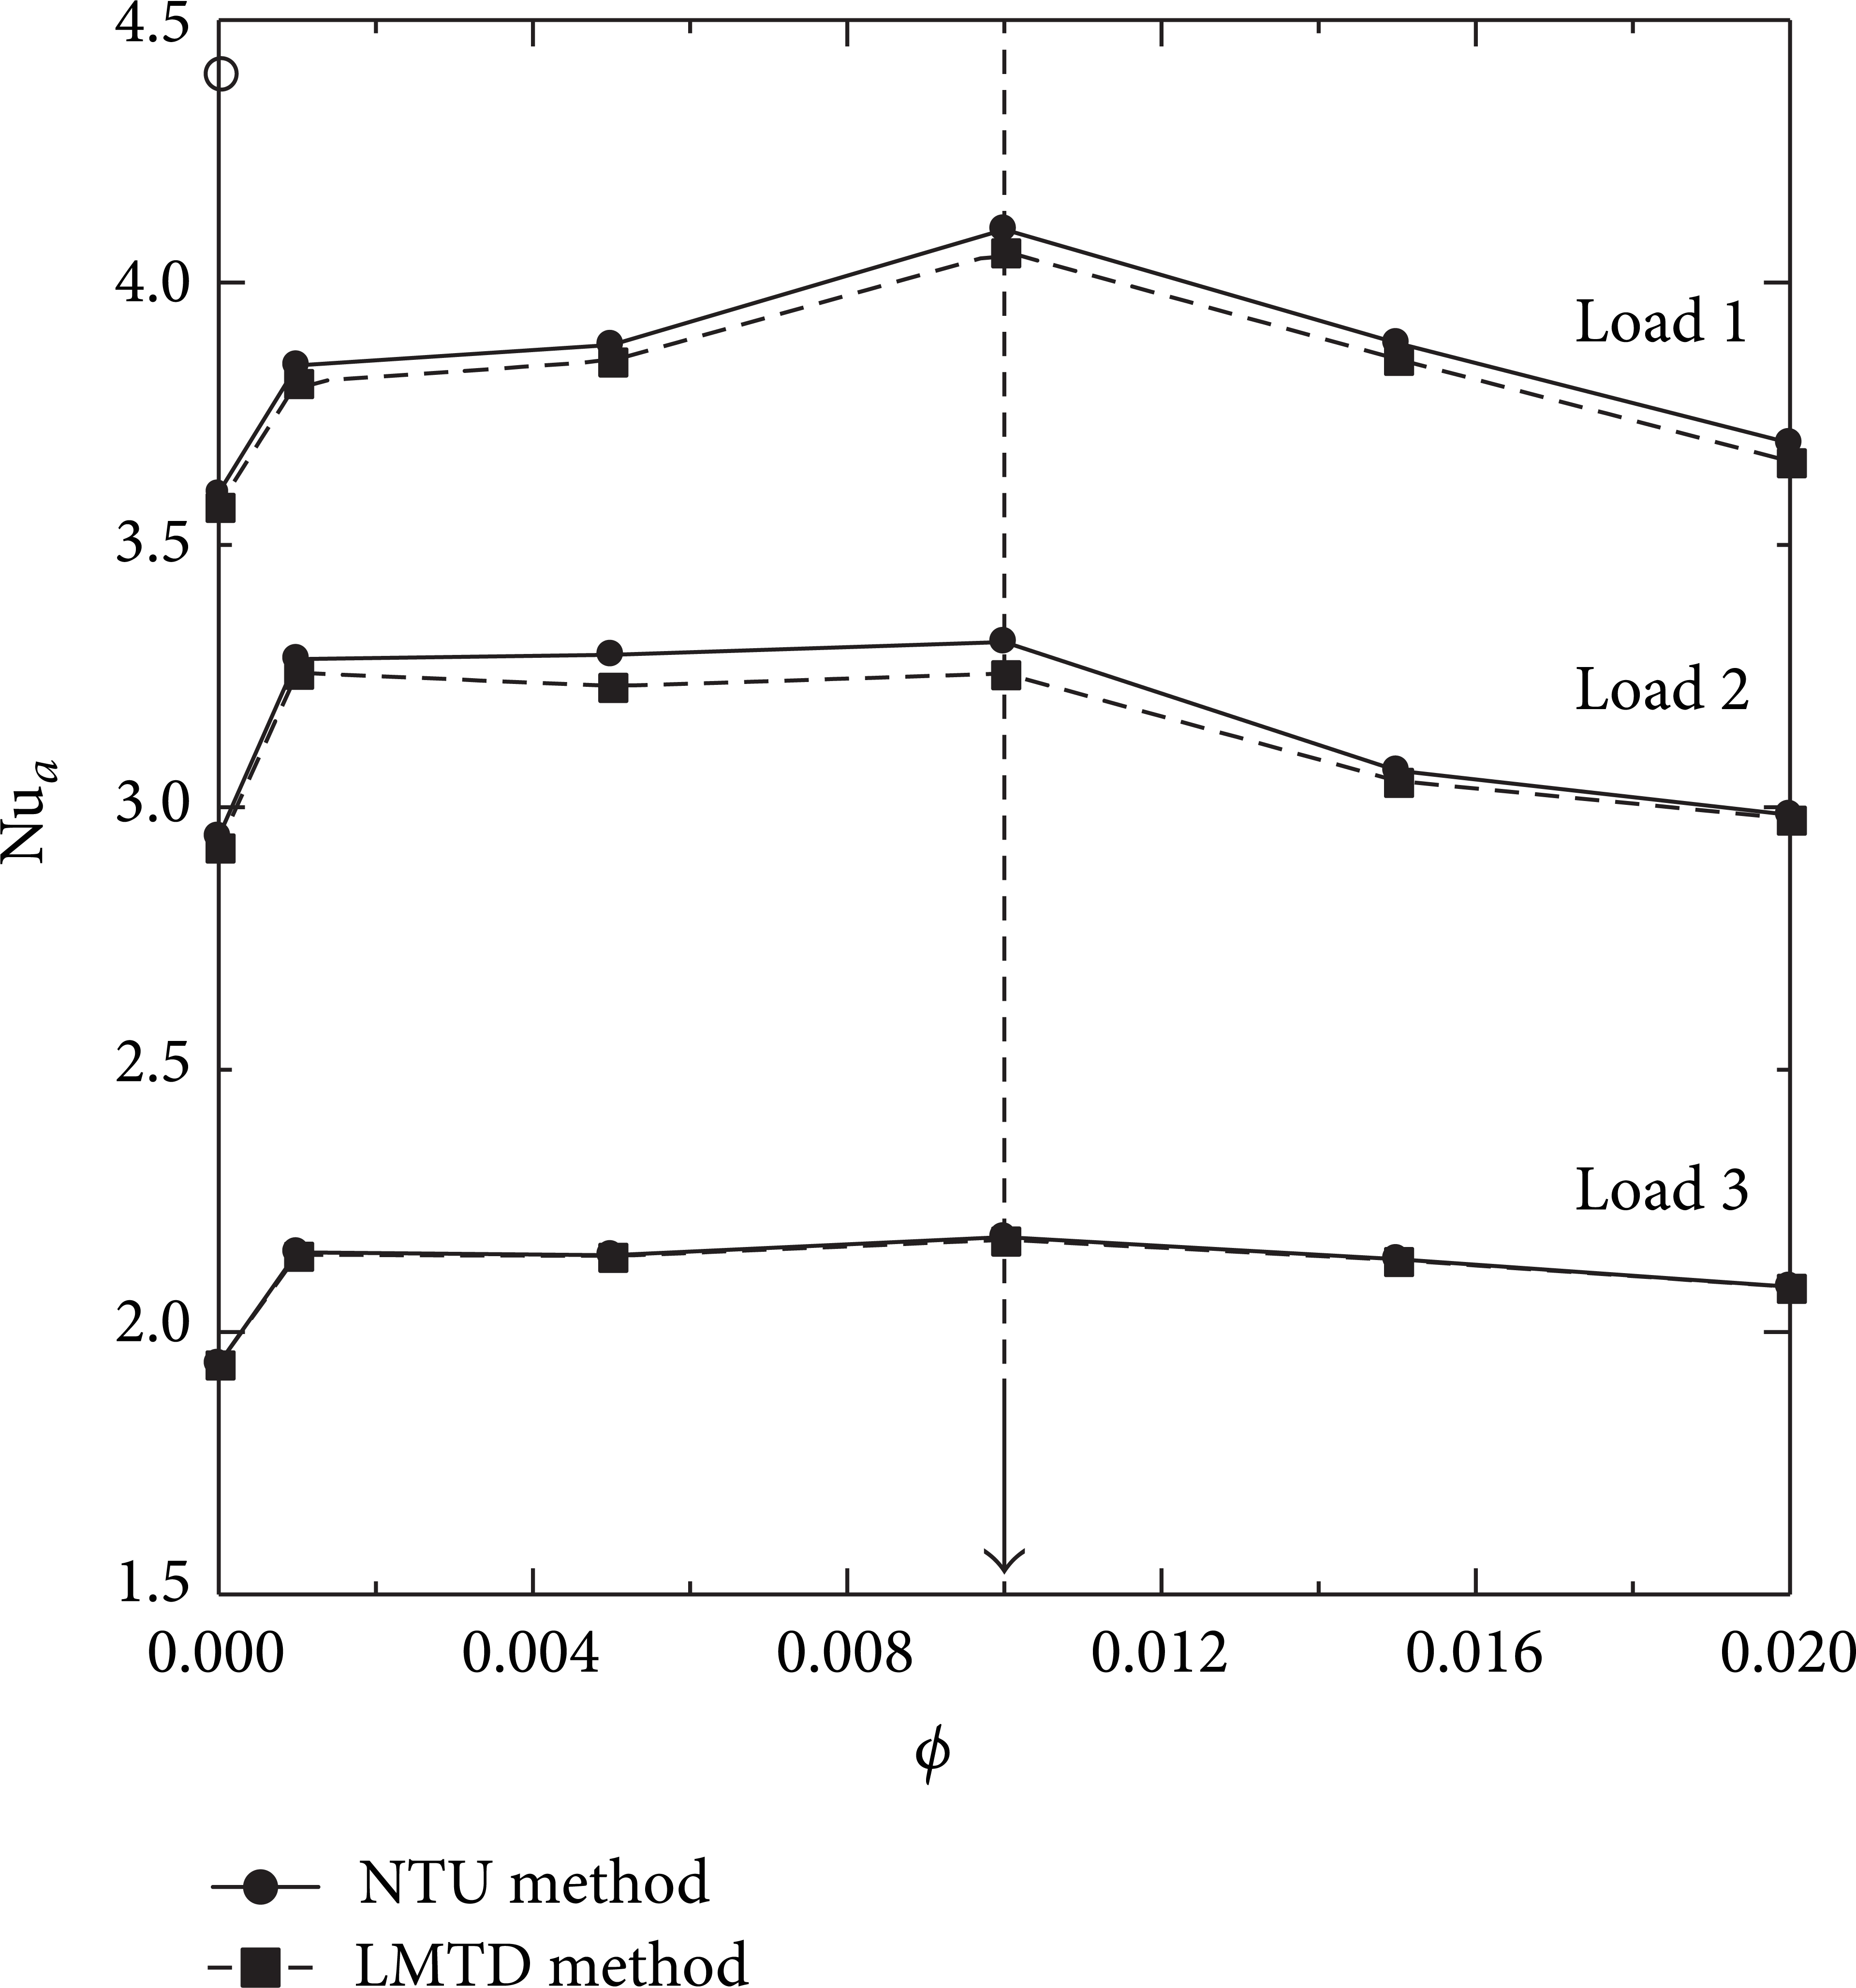
Air side Nusselt number at different loads using two different approaches showing the optimum at ϕ = 1%.
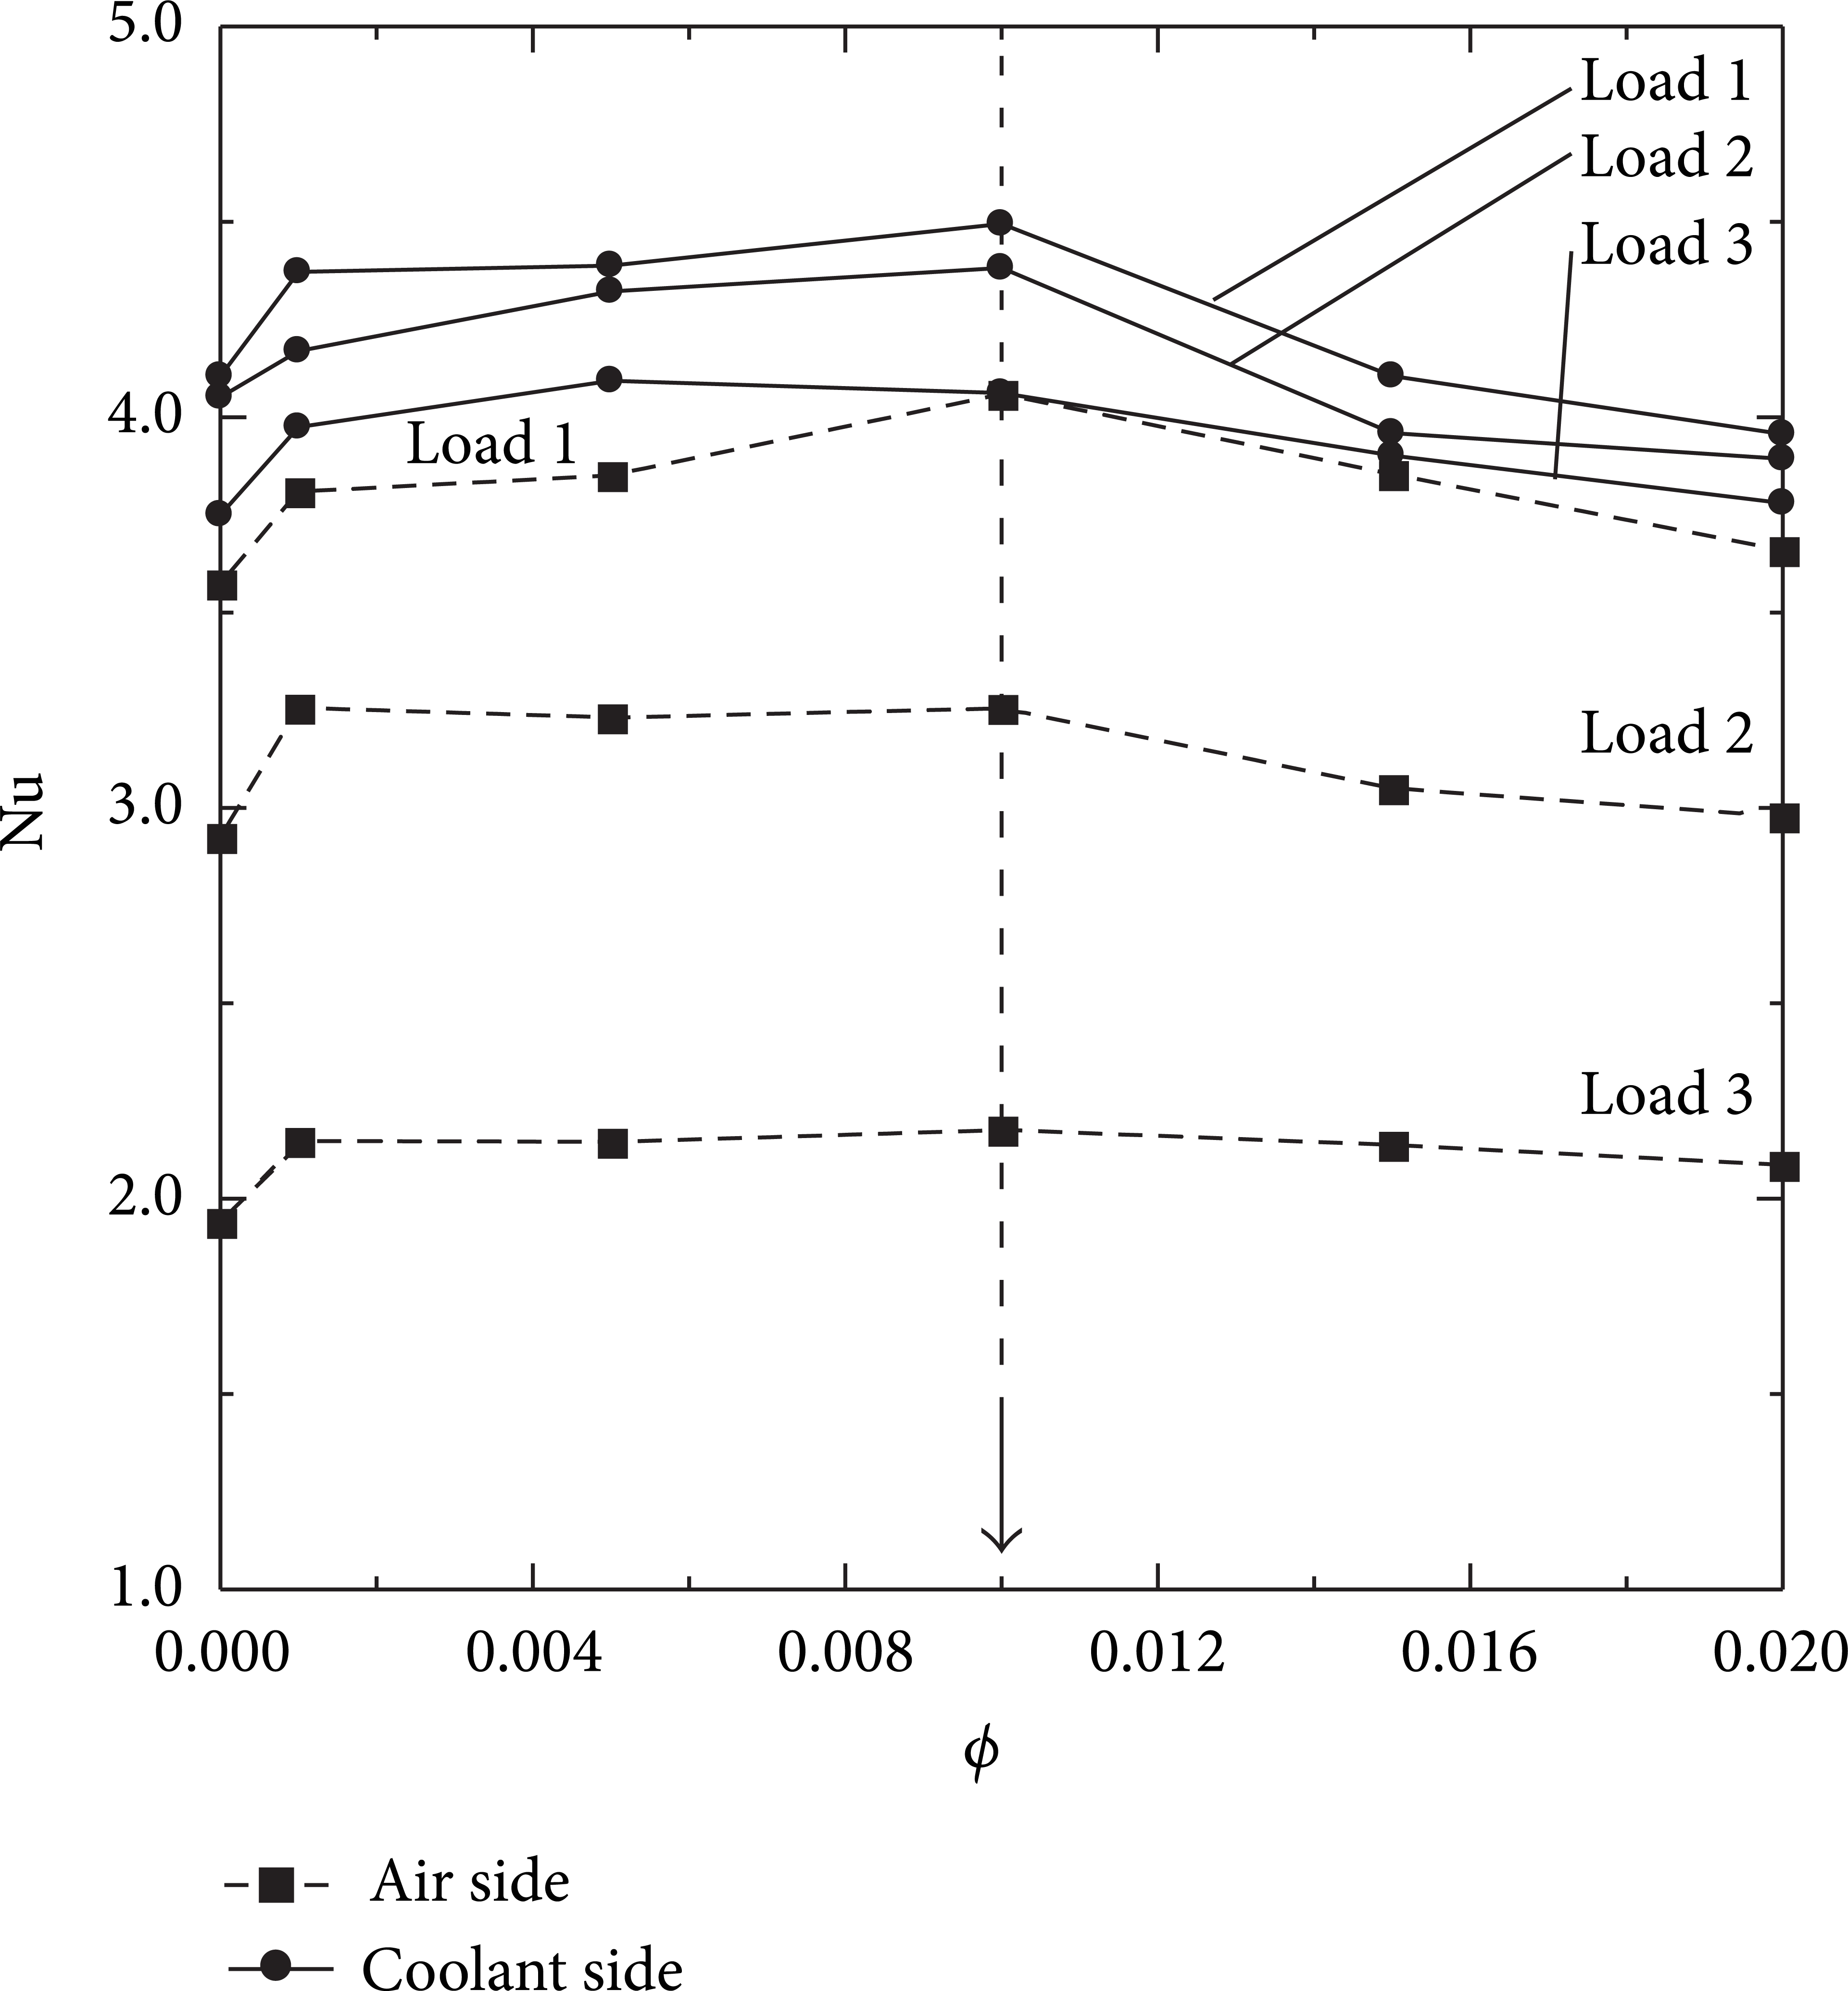
Comparison between the coolant and the air side Nusselt numbers at different loads.

Comparison between the coolant and the air side Reynolds numbers at different loads.

Effectiveness of the coolant at different loads for different volume fraction. Nanofluids showing the optimum volume fraction where effectiveness is maximum.

Coolant pumping power at different loads for different volume fraction. Nanofluids showing the continuous increase of the pumping power as the volume fraction increases.
7. Conclusions
Experimental study is reported to simulate the Toyota Yaris 2007 cooling system (radiator) using nanofluid with different concentrations and at different loads. Results show that heat transfer by the coolant increases as the nanofluid concentration increases up to ϕ = 0.01 by volume where it reaches its optimum value. Beyond that it deteriorates as the concentration increases. It has also shown that the heat transfer by the coolant increases at higher loads. The coolant and air heat transfer coefficient reach their maximum at ϕ = 0.01 and beyond that they decrease as the concentration increases. The maximum percentage increase of the coolant heat transfer rate, coolant heat transfer coefficient, and coolant Nusselt number is 14.79, 14.72, and 9.51, respectively, which occurs at maximum load 1 and at ϕ = 0.01. The maximum values of air side heat transfer coefficient and Nusselt number also occur at the same load and concentration and have 14.45% and 13.94% increase over that of the base fluid, respectively. Beyond that they deteriorate as the concentration increases. It is recommended that the optimum nanofluid concentration to be used for heat transfer enhancement of the radiator cooling system is ϕ = 0.01.
Footnotes
Nomenclature
Conflict of Interests
The authors declare that there is no conflict of interests regarding the publication of this paper.
Acknowledgments
The authors extend their appreciation to the Deanship of Scientific Research at King Saud University for funding this work through the research group project no. RGP-VPP-080.