
Abstract
Existing systems for traffic information acquisition have high costs and low scalability owing to their characteristics such as large size, wired power supplies, and wired communication. To achieve low costs and high scalability, the use of traffic information acquisition systems based on wireless sensor networks (WSNs) has been suggested. However, WSN-based systems have important issues, such as low computing power, limited battery capacity, and high transmission delay. Existing studies on WSN-based acquisition systems have not considered all three of these problems together. Moreover, most studies have focused on theoretical problems rather than practical ones. Therefore, we propose a new system that considers all three limitations of WSN-based systems. In our experiments, we installed our system on real roads for an accurate evaluation. The results show that our system has a high detection accuracy, low power consumption, and low transmission delay.
1. Introduction
The increasing use of automobiles has caused severe traffic congestion and resulted in many problems, such as increased air pollution and frequency of car accidents. To address these problems, physical approaches such as road extensions have been suggested thus far. However, such methods not only include high construction costs but also have physical limitations. Recently, intelligent transportation systems (ITSs) have been studied to solve the problems of existing physical approaches at lower costs and with higher efficiency. An ITS is a convergence of transportation technologies and information technologies, and it enhances not only traffic safety but also road use efficiency [1, 2].
A traffic information acquisition system is the foundation of an ITS. Many traffic information acquisition systems have been developed, such as inductive loop detectors, infrared sensors, and video monitoring systems [3–5]. However, such systems have high costs and low scalability owing to their large size, wired power supplies, and wired communication systems. To achieve low costs and high scalability, traffic information acquisition systems based on WSNs have been studied in a wide variety of application fields [6–10].
However, WSN-based systems have important issues that should be concerned, such as low computing power, limited battery capacity, and high transmission delay. Existing studies on WSN-based acquisition systems have not considered all three problems simultaneously. Moreover, most studies have focused on theoretical problems rather than practical ones. Therefore, we propose a new system that considers all three limitations of WSN-based systems. The proposed system minimizes the power consumption and transmission delay. Moreover, the vehicle detection algorithm employed in our system is lightweight without compromising vehicle detection accuracy. The proposed system has various advantages such as easy deployment, low maintenance costs, and high scalability.
Our system uses ultrasonic sensors installed on the side of a road. These sensors measure the initial distance data, which are then converted into traffic information by our lightweight vehicle detection algorithm. This traffic information should be transmitted to a central server as quickly as possible for use by other ITS applications. In addition, the traffic information should be delivered with low power consumption. To satisfy these aims, we design a three-phase routing protocol. The proposed routing protocol minimizes the power consumption and transmission delay.
The remainder of this paper is organized as follows. In the next section, we review the literature related to WSN-based traffic information acquisition systems. In Section 3, we describe the proposed vehicle detector, and in Section 4 we explain the routing protocols used for data transmission. In Section 5, we discuss the issues related to sensor position. Section 6 provides a performance evaluation of the proposed system. Finally, some concluding remarks regarding this research are given in Section 7.
2. Related Works
To address the problems of existing traffic information acquisition systems, WSN-based acquisition systems have been studied in a wide variety of application fields. As shown in Figure 1, a WSN-based system collects real-time traffic information from sensor nodes deployed along the roadside. The collected information can include the vehicle speed, magnitude of the traffic flow, and lane occupancy rate. The information is periodically transmitted to a traffic management center based on ad hoc networks. Consequentially, the data can be used by other applications, such as intersection signal control systems and variable speed limits. A WSN-based acquisition system provides various advantages such as low costs and high scalability. However, to exploit these advantages, many issues need to be considered. Sensor nodes typically have a restricted computing ability owing to their small size. Therefore, lightweight vehicle detection algorithms or programs should be designed. Moreover, power-saving mechanisms are necessary because such systems are battery-driven. The energy efficiency problem is one of the main issues in WSN [11–13]. An ad hoc network leads to a longer data transmission delay than a wired network. Thus, the routing protocol needs to be designed to minimize transmission delay.
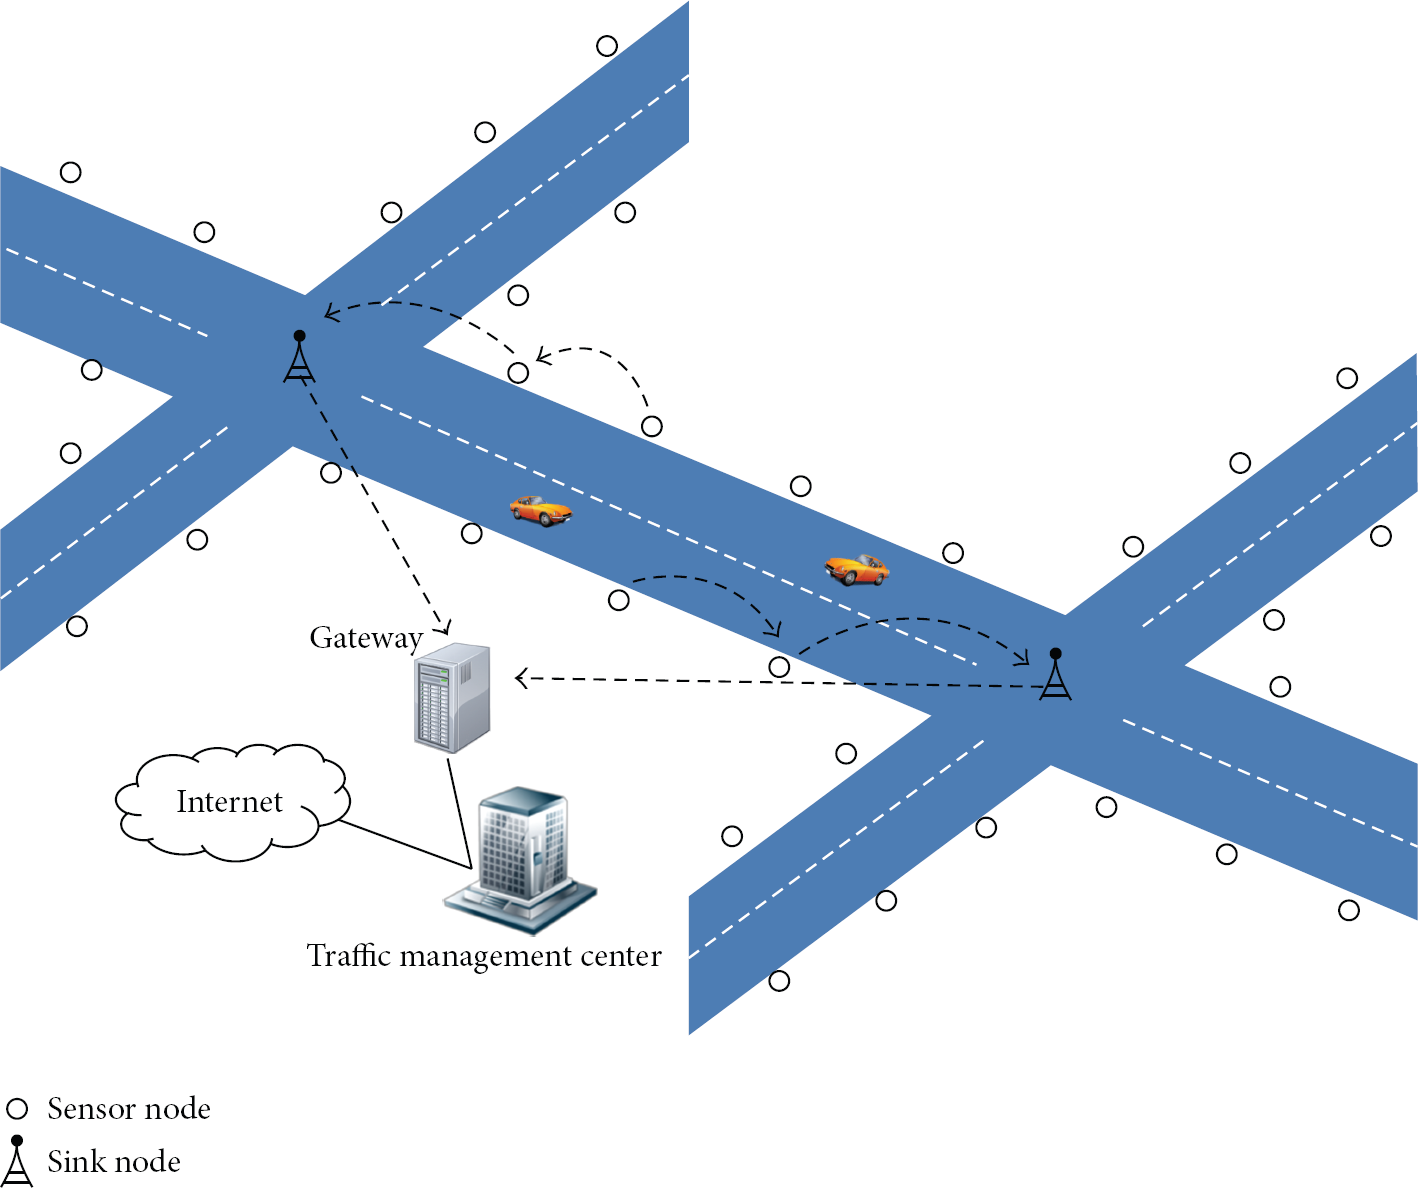
WSN-based ITS.
Existing studies for WSN-based acquisition systems have not considered all of these issues simultaneously. Furthermore, most studies have focused on theoretical problems, not practical ones. In [6], the authors increased the vehicle detection accuracy using WSN-based magnetic sensors. This approach was implemented and evaluated on real roads. However, the power consumption problem inherent to WSN-based acquisition systems was not dealt with. Moreover, four sensor nodes were grouped for vehicle detection of a single lane, which increases the cost and decreases the scalability. In [7], magnetic and infrared sensors were combined into one module to increase the vehicle detection accuracy, but the power consumption problem was not considered. In [8], the authors proposed a new algorithm for an in-network aggregation of the traffic flow in the time domain, which reduces the communication costs between sensor nodes. In addition, the authors introduced the idea of adaptive segmentation, which increases the accuracy of the traffic information collected. The new algorithm used for in-network aggregation can reduce the amount of power consumed. However, it restricts the data scalability and applicability because all sensor data are combined into one dataset. In addition, the authors did not consider the packet transmission delay and did not evaluate their proposed system in the field. The authors of [9, 10] proposed new WSN architectures for ITS to reduce the packet loss and delay. However, they focused only on theoretical problems and did not implement or evaluate their proposed system on real roads.
In this paper, we introduce a new traffic acquisition system that collects traffic information from multiple lanes using a single ultrasonic sensor, which increases the scalability and reduces the installation and maintenance costs. Moreover, we introduce a new routing protocol that minimizes the packet transmission delay and power consumption.
3. Vehicle Detection with an Ultrasonic Sensor
For easy deployment and low maintenance costs, we install small ultrasonic sensors on the side of a road, as shown in Figure 2. In our system, each single ultrasonic sensor detects vehicles in multiple lanes, thereby minimizing the need for additional sensors. The measured distance data from each ultrasonic sensor will show specific patterns based on the vehicle positions, as shown in Figure 2. Vehicles can be detected in multiple lanes through a pattern analysis of the measured distance data.

Vehicle detection using ultrasonic sensors.
3.1. Vehicle Detector
Figure 3 shows the internals of the vehicle detector used in our traffic acquisition system. The detector is composed of an ultrasonic module and a control module. We used an NRF04 from Devantech [14] for the ultrasonic module and a Micaz from Crossbow [15] for the control module. The Micaz consists of an Atmega128L microprocessor and CC2420 radio transceiver.
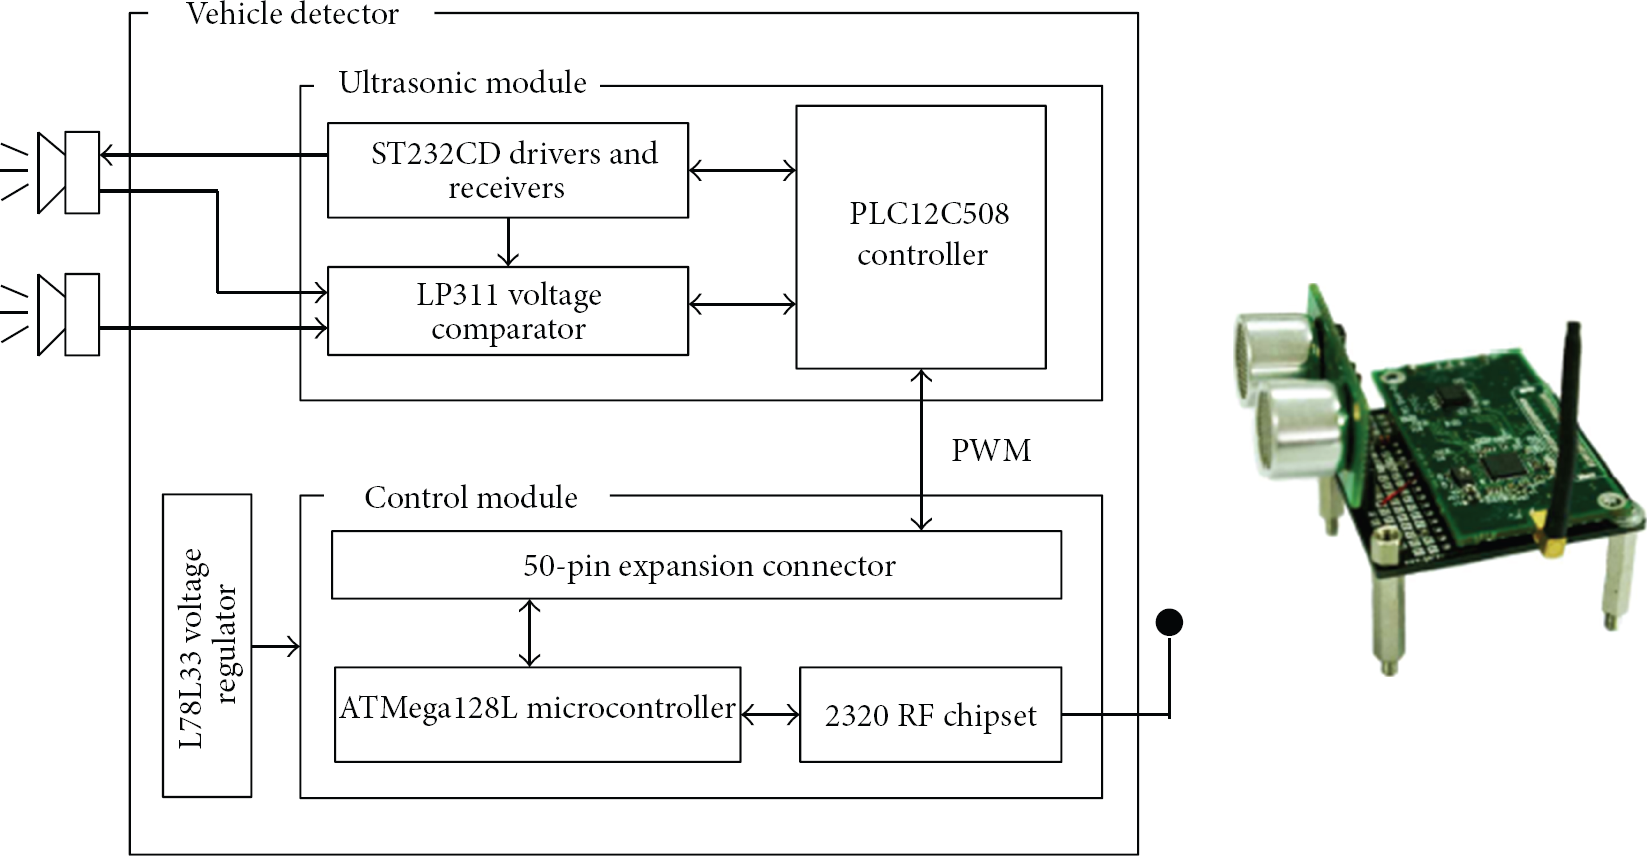
Vehicle detector hardware design.
The ultrasonic module is controlled using a PWM signal generated by the Atmega128L in the control module. Figure 4 shows the entire operation of the ultrasonic sensor. At the beginning of the operation, a 10 μs signal is used as the trigger signal input. After receiving the trigger signal, the ultrasonic module sends out an 8-cycle (200 μs) ultrasound burst and raises its echo signal high. The control module then listens for an echo output, and once the ultrasonic sensor detects the ultrasound carrier wave it lowers the echo signal again. The echo signal is a pulse with a width proportional to the distance from the object.

Operation of the ultrasonic sensor.
3.2. Vehicle Detection Algorithm
As explained in the previous sections, the vehicle detection algorithm should be lightweight without compromising the vehicle detection accuracy. Thus, we classified our vehicle detection algorithm into the four steps, as shown in Figure 5. The distance data measured by the ultrasonic sensors should be divided into a time series because the traffic information is typically transmitted to a server at regular intervals. We call this process “segmentation,” as shown in Figure 5. Next, in the “signal conditioning” step, the distance data undergo a preprocessing of noise removal and quantization. The preprocessed distance data are then extracted as vectors in the “vector extraction” step. Finally, the vector data are converted into traffic information in the “pattern matching” step. The algorithm used for each step was designed to be lightweight.

Vehicle detection algorithm.
3.2.1. Segmentation
The periodic collection of traffic data is widely used in traffic information acquisition systems. For instance, real-time traffic state information such as the magnitude of the traffic flow, vehicle speed, and lane density is transmitted to a server every 20 or 30 s. Likewise, our system sends the traffic data periodically, and therefore a segmentation of the traffic time series is necessary.
Static segmentation (SS) is a simple segmentation method that equally divides the traffic in a time series. SS is easy to use but can result in vehicle detection errors and a loss of traffic information. For instance, as shown in Figure 6, if the distance data is divided by SS, the segmentation point can be placed at point
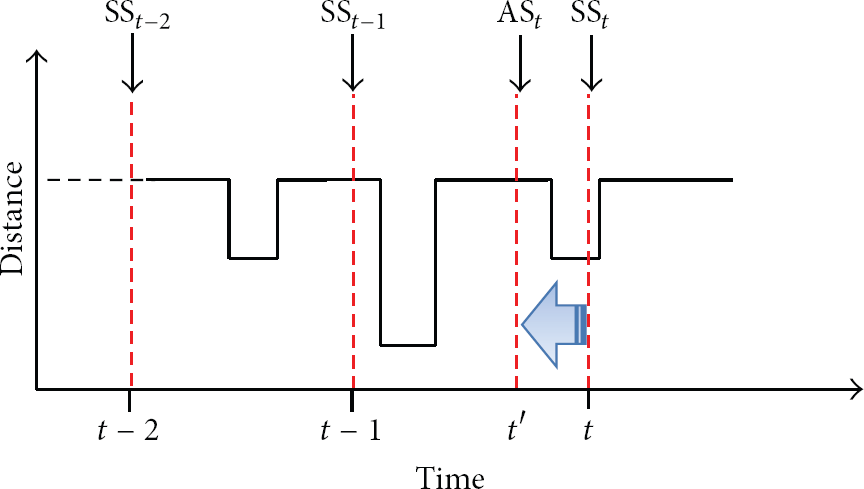
Segmentation.
3.2.2. Signal Conditioning
The distance data measured by an ultrasonic sensor includes various noises that should be filtered out. There are many different filtering algorithms for noise removal such as a median filter, an averaging filter, and a Kalman filter. Filtering algorithms with a better filtering performance generally have higher complexity. However, such an algorithm is inappropriate for our system because the microprocessor used has only 8 Mhz clock speed and 4 Kbytes of memory [15]. Therefore, the filtering algorithm needs to have low complexity and a proper filtering performance. For these reasons, we selected a median filter that shows a proper noise filtering performance and low complexity. To minimize the complexity, we restricted the mask size to 3 because the complexity of the median filter increases based on the mask size used.
After the noise filtering, quantization based on the lane width is performed for vector extraction. The quantization minimizes the number of vector types. A limited number of vector types means that we can easily predefine the patterns of the vectors, and the vehicles can then be detected based on the pattern matching of the vectors.
3.2.3. Vector Extraction
To detect passing vehicles, our algorithm captures their entry and departure points. If the entry and departure points are extracted into vectors, the passing vehicles are easily detected through pattern matching. For instance, if the distance data are shown in Figure 7(a), the entry and departure points can be extracted using a high-pass filter, and the filtered data are then converted into vector data. The number of extracted vector types is limited owing to the quantization performed during the previous signal conditioning.
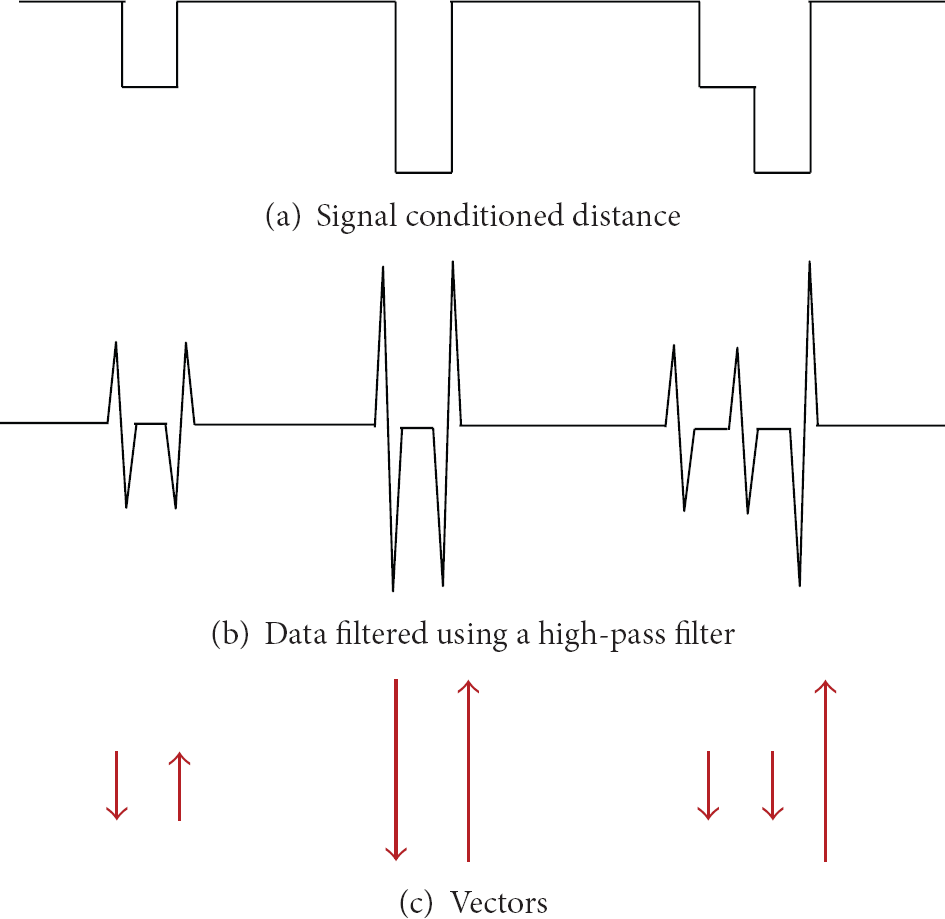
Vector extraction.
Table 1 shows examples of possible vectors, patterns, and numbers of vehicles with the distance measured from a two-lane road. The extracted vectors can be described as string patterns. As shown in Table 1, six patterns for a two-lane road are possible. Since the type of vectors and patterns vary based on the number of lanes, this information can be rearranged when our system is deployed in real roads.
Possible vectors and patterns.

3.2.4. Pattern Matching
From the previously defined patterns, we finally produce the traffic information through pattern matching. Each pattern is described using unique strings, and a simple string pattern matching algorithm can therefore be used. However, pattern conflictions should be examined before the pattern matching is conducted. Figure 8 shows the patterns defined in Table 1. If we search a pattern sequentially from “ab” to “cbad,” a pattern confliction can occur because the “aabb” pattern includes the “ab” pattern. In this case, the order of the pattern matching should be changed, as shown in Figure 8.
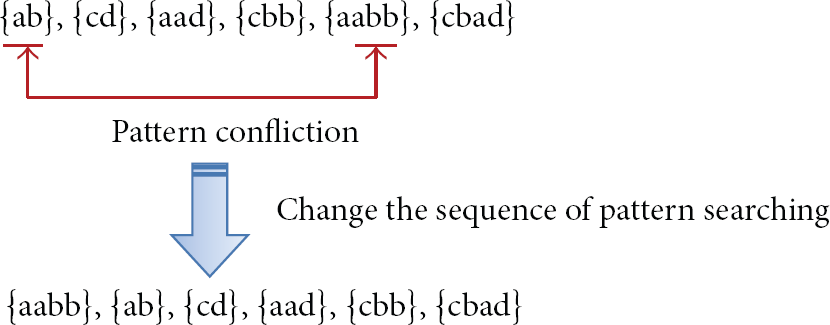
Pattern confliction.
After the reordering of the pattern matching, the traffic information is consequently extracted. Generally, the complexity of the string pattern searching algorithm is
4. Routing Protocol
Owing to the battery-driven operation of our system, a power-saving mechanism should be included. Moreover, the collected traffic information needs to be transmitted to a server as quickly as possible for use by other ITS applications. For these reasons, we designed the routing protocol to minimize the packet transmission delay and power consumption. We initially conducted a power profiling to analyze the power consumption of our vehicle detector.
4.1. Power Profiling
We classified our vehicle detector into four modules for an accurate power consumption analysis (we previously divided our detector roughly into two modules, as described in Section 3.1). The classified modules are a base circuit, microprocessor, ultrasonic module, and communication module. The microprocessor and communication module are included into control module, as shown in Figure 3. The ultrasonic module used is the same as that shown in Figure 3. The base circuit is a group of components used to connect the control module and ultrasonic module, such as regulators and resistance modules. Figure 9 shows the average power consumption by each module.

Average power consumption.
As shown in Figure 9, the communication module shows the greatest power consumption. Next, the base circuit shows the second highest power consumption. Since the power consumption of the base circuit can be reduced by hardware optimization and not through the use of a protocol algorithm, it is ignored in this paper. The other two modules show relatively low power consumption. Thus, the power consumption of the communication module should be mainly considered for the design of our routing protocols.
For more detailed analysis, we measured the average power consumption of the communication module by changing the packet transmission intervals from 500 ms to 5 ms with a 22-byte packet size, as shown in Figure 10. The power consumption in an ON/OFF state is also measured. The average power consumption is almost 0 W during the OFF state and rapidly increases during the ON state. However, the power consumption does not show a large difference when the packet transmission interval decreases. The difference is only about 0.001 W between 500 ms and 5 ms. These results indicate that the communication module should be in the OFF state as long as possible to reduce the power consumption. Moreover, since a small data packet size can shorten the ON state period, the packet size should also be minimized.

Average power consumption based on the packet transmission intervals.
The second highest power consuming module in our detector, next to the base circuit, is the ultrasonic module, as shown in Figure 9. Therefore, a power reduction mechanism is necessary for the ultrasonic module. Figure 11 shows the power consumption of the ultrasonic module in the time domain with an ultrasonic burst occurring every 100 ms. The power consumption sharply increases with an ultrasonic burst. The results show that vehicle detection with a long interval can reduce the power consumption caused by such a burst.
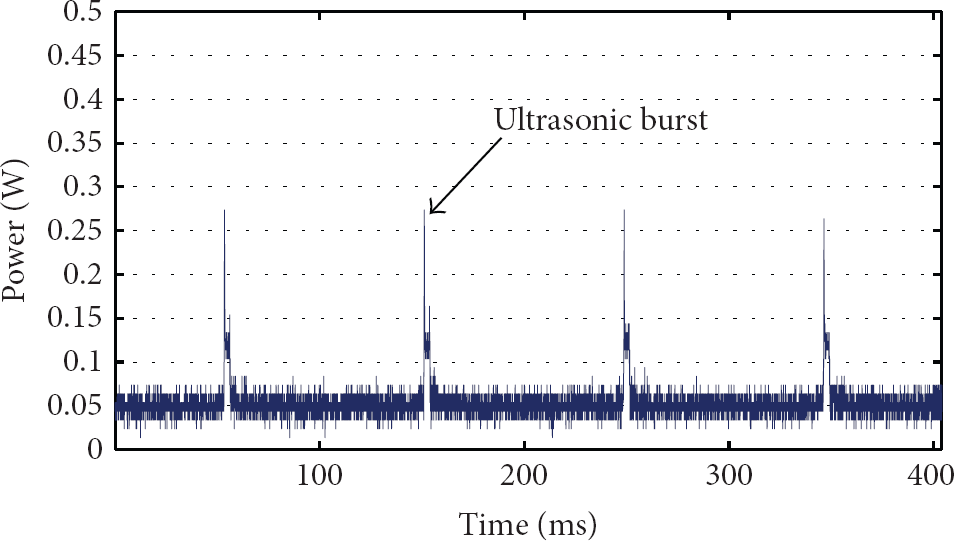
Power consumption of an ultrasonic module.
However, an overly long detection interval can increase the detection errors. To guarantee accurate vehicle detection, a proper amount of data is needed. Therefore, the maximum detection interval according to the road environment is necessary, as shown in the following:

Figure 12 shows the total power consumption of our vehicle detector in the time domain. As expected, the power consumption sharply increases when the communication module is turned on. From the power profiling of our detector, we can summarize the minimizing power consumption as follows.
The size of the data packet should be as small as possible. The sensing interval of the ultrasonic sensor should be as long as possible. The communication module should remain in the OFF state as long as possible.

Power consumption of the vehicle detector.
4.2. Three-Phase Routing Protocol
Three main challenges are derived from the power profiling to reduce the power consumption of our vehicle detector. First, packet size reduction can be achieved through data compression. However, the data generated from our system is the volume and speed of the passing vehicles, which can be presented using only a few bytes. A packet size reduction is therefore unnecessary for our system. Second, an increase in the sensing interval of the ultrasonic sensor can be achieved using the maximum sensing interval calculated through (1). Third, the power consumption can be reduced by turning off the communication module. To reduce the power consumption by controlling the communication module, appropriate routing protocols are needed.
MAC protocols based on a duty-cycling mechanism are generally used for power saving in wireless sensor networks [17–19], which reduces the idle listening time by repeatedly turning the communication module on and off. However, duty-cycling increases the data transmission delay. To minimize this delay, the data transmission interval should be the same as the duty cycle. Fortunately, since our system transmits data during each predetermined period, it is appropriate to apply duty cycling to our routing protocol.
We propose three-phase routing protocol based on duty-cycling that minimizes the power consumption and data transmission delay. The proposed three-phase routing protocol consists of a discovery phase, time synchronization phase, and data collection phase.
4.2.1. Discovery Phase
Routing paths are established in the discovery phase. As shown in Figure 13, the sink node broadcasts a discovery message, and the sensor nodes then forward the message to discover the neighboring nodes. The broadcasting of the discovery message is repeated until the message reaches the leaf node (node 2 in Figure 13). When the discovery message reaches the leaf node, the node sends a completion message that is also forwarded to the sink node. From the completion message, the sink node can save all routing paths of the sensor nodes.

Routing path establishment.
If a new sink node is added to the networks, the routing path should be modified for the benefits of power consumption and data transmission delay. As shown in Figure 14, the new sink node broadcasts the discovery message, and the sensor nodes then change the path if the hop count is smaller than the previous path. In addition, the sensor node sends a modification message to the previous path to announce the path modification.

Routing path modification.
The routing table of the sensor nodes consists of the node ID, hop count, parent ID, and child IDs, as listed in Table 2. The hop count is used to establish the routing path. The child IDs are used to determine the turning-off time of the communication module for power saving during the data collection phase.
Routing table.

4.2.2. Synchronization Phase
As previously mentioned, duty-cycling based protocols increase the data transmission delay. To minimize this delay, time synchronization among the sensor nodes is necessary.
In a wireless sensor network, a one-way synchronization message is normally used as a simple message exchange. However, for more accurate time synchronization, we use a two-way synchronization message exchange, as shown in Figure 15.
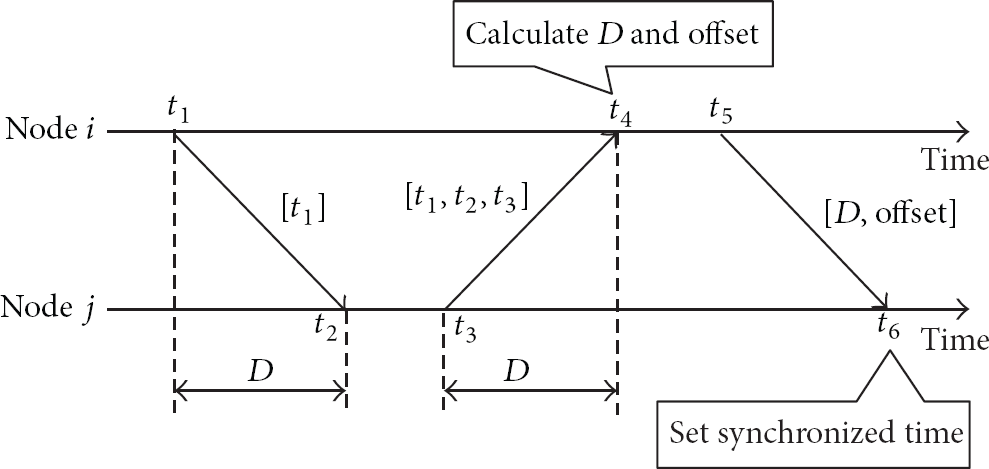
Pairwise synchronization.
The synchronization is performed by calculating the propagation delay D and the clock offset. As shown in Figure 15, when a two-way message exchange is completed, node i can calculate the propagation delay and offset as follows:

When node i sends the D and offset data to node j, node j determines the accurate time synchronization, which is performed by repeating the message exchanges at all sensor nodes.
4.2.3. Data Collection Phase
When the synchronization message reaches a leaf node, a synchronization completion message is triggered, as shown in Figure 16, and each sensor node then starts gathering traffic data using an ultrasonic sensor. At the same time, the communication module is turned off to save power.
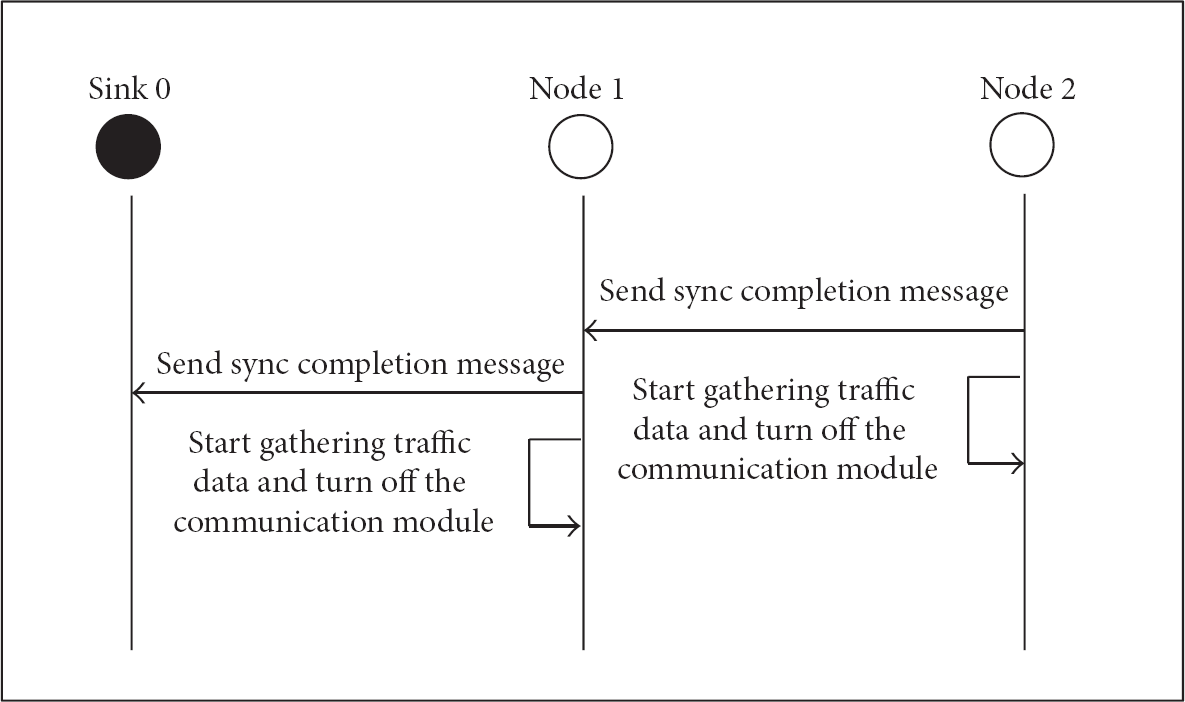
Synchronization completion.
Owing to the time synchronization, each sensor node wakes up at the same time and sends the measured traffic data to the parent node, as shown in Figure 17. Each node forwards the traffic data of its children nodes. After the data transmission, the sensor nodes turn off their communication module. This routine is repeated within a certain period.

Traffic data transmission.
As a result, since the sensor nodes turn on their communication module only when a data transmission is needed, the power consumption is minimized. Moreover, a synchronized data transmission minimizes the transmission delay caused by the duty-cycling mechanism.
5. Sensor Position
Location information is essential data for traffic surveillance systems. A global positioning system (GPS) is widely used for outdoor-location based systems. However, a GPS is not appropriate for our system because of its high power consumption. For instance, the power consumption of GPS in a smartphone is 0.3 W [20], which is 1.5 times higher than the total power consumption of our system. Therefore, we conclude that assigning location information to sensor nodes is appropriate for our system.
6. Performance Evaluation
We installed our system on a bidirectional four-lane road, as shown in Figure 18. The distance data were measured from two lanes. A total of ten sensor nodes were installed at the side of a road with 50 m spacing. The width of each lane is 3.5 m, and the speed limit is 60 km/h. To calculate the sensing interval of an ultrasonic sensor, we used (1) and applied an average vehicle length of 3.5 m. The derived sensing interval was about 60 ms, and we therefore used 50 ms to remove any errors in the equation, along with a 20 s data transmission period.

Experiment environment.
6.1. Performance of the Vehicle Detection Algorithm
To evaluate our vehicle detection algorithm, we analyzed the detection results of sensor node 1 and compared them with the video results, as shown in Figure 18. Table 3 shows the detection results, which were measured from 10:00 to 11:00 a.m.
Vehicle detection results.

6.1.1. Number of Vehicles Detected
The possible detection errors in our system can be classified into three categories, as shown in Table 3. An “overlap” error occurs when two vehicles in two different lanes pass our detector at the same time. In this case, the vehicle on the inside lane cannot be detected since our detector is installed at the side of the road. A “loss” error occurs when the data to be detected are filtered out by the noise filter. Finally, an “overcounting” error is caused by a vehicle lane change. If a vehicle changes its lane in front of our detector, the data pattern is measured as “aad” or “cbb,” as shown in Table 1.
As shown in Table 3, the number of measured vehicles in lane 1 is less than the video results owing to “overlap” and “loss” errors. On the contrary, because of an “overcounting” error, more vehicles are detected in lane 2 than in the video results. The error rate is −6.37% for lane 1 and +0.55% for lane 2. The total error rate is −1.53%, which indicates that our system shows high vehicle detection accuracy.
6.1.2. Number of Vehicles Lost
In our vehicle detection algorithm, AS is used to prevent a loss of vehicle information caused by SS. The information loss increases with a shorter segmentation interval. To evaluate the AS, we measured the number of lost vehicles, varying the segmentation interval from 5 to 30 s. As shown in Figure 19, the number of lost vehicles for SS increases with a short segmentation interval. On the other hand, AS shows zero results at all segmentation intervals.

Static segmentation error.
6.2. Performance of Three-Phase Routing Protocol
Because our system has a battery-driven operation, the power consumption must be minimized. Moreover, the traffic data collected should be transmitted to a server as quickly as possible for use by other traffic control applications. To evaluate these two factors, we measured the average power consumption and packet transmission delay.
6.2.1. Power Consumption
Figure 20 shows the average power consumption of our three-phase routing protocol compared with a protocol without a power-saving control. As expected, the proposed three-phase routing protocol shows a lower power consumption of about 0.11 W. In the previously performed power profiling, the power consumption of the communication module was about 0.12 W. This result therefore indicates that a 92% reduction in the power consumption of the communication module is achieved by our routing protocol.

Average power consumption.
6.2.2. Transmission Delay
To minimize the transmission delay caused by duty cycling, we synchronized all of the sensor nodes. Thus, additional data transmission delays are caused only by the calculations of the vehicle detection algorithm and an increasing hop count. Since our system has a linear topology, increasing the number of sensor nodes leads to a hop count increase.
Figure 21 shows the calculation time of our vehicle detection algorithm, which increases based on the traffic data transmission interval, as a longer interval indicates more distance data. The longest calculation time was 2 ms at a 20 s interval, which indicates that our algorithm has a lightweight design.

Calculation time.
Figure 22 shows the transmission delay of our routing protocol by different hop counts as compared to the normal data transmission. For this measurement, we used a 20 s data transmission interval. The difference between the proposed protocol delay and normal transmission delay is fewer than 5 ms at all hop counts, which is caused by the use of the vehicle detection algorithm and minor synchronization errors. There is about a 10 ms increase per hop. The results show that although the hop count is over 10, the data can be transmitted to a server in 0.1 s, which is a sufficient time frame to control the traffic management system.

Packet transmission delay.
7. Conclusions and Future Work
In this paper, we proposed a new traffic information acquisition system with small ultrasonic sensors in wireless sensor networks. The proposed vehicle detection algorithm exhibits high detection accuracy with low complexity, and its routing protocol minimizes the power consumption and transmission delay. In a performance evaluation, the vehicle detection algorithm showed an error rate of less than 2%. The proposed routing protocols saved over 92% of the communication module power compared with the use of a routing protocol without a power-saving mechanism. In addition, we confirmed that the data can be transmitted to a server with a minimized transmission delay.
As future work, we will enhance our hardware design to reduce the power consumption of the basic circuit and ultrasonic sensor. Moreover, we will increase the vehicle detection accuracy by combining more than two different types of sensor data. Now our system is only evaluated in clean weather conditions, so that we will test our system in different weather conditions such as rain, snow, and strong wind.
In addition, currently, it is difficult to compare our approach with other systems because similar approaches with our system do not exist. Now we are developing a different traffic information acquisition system using tiny omnidirectional microphone in wireless sensor networks. The entire architecture is the same with our ultrasonic-based system. Only the ultrasonic sensors are changed to microphones. In the future, we will compare these two systems for more improvement of both systems.
Footnotes
Conflict of Interests
The authors declare that there is no conflict of interests regarding the publication of this paper.
Acknowledgments
This research was supported by the Basic Science Research Program through the National Research Foundation of Korea (NRF) funded by the Ministry of Education, Science, and Technology (NRF-2013R1A1A2008811).