
Abstract
One of the most important considerations to be considered in the design of energy efficient buildings is the thickness of the insulation to be applied to the building. In this study the existing building stock in Turkey has been investigated depending on parameters such as the height and the area. A model building has been created covering all of these buildings. Fuel emission reduction of combustion system was calculated in the case of insulation applied to this model building. Heat loss of the existing building stock and exhaust emissions and the contribution to the country's economy with the model building methodology are also determined. The results show that the optimum insulation thicknesses vary between 3.21 and 7.12 cm, the energy savings vary between 9.23 US$/m2 and43.95 US$/m2, and the payback periods vary between 1 and 8.8 years depending on the regions. As a result of the study when the optimum insulation thickness is applied in the model building, the total energy savings for the country are calculated to be 41.7 billion US$. And also total CO2 emissions for the country are calculated to be 57.2 billion kg CO2 per year after insulation.
1. Introduction
Regulations regarding the thermal insulation of buildings utilize the calculation method stated in the TS 825 (Turkish standard) compulsory. A balance must be determined between the insulation thickness, cost, and the savings obtained. It is also changing dramatically due to various data (areas) for all buildings. Thermal insulation in buildings reduces energy consumption and provides fuel saving as well as other benefits such as eliminating condensation and mold formation on interior surfaces of walls. Thermal conductivity and first cost are important parameters in selecting an insulation material. Insulation materials are not independent energy production or conservation systems but are one of the complex structural elements that form a building's shell. In this sense, they cannot be evaluated in the same way that energy producing systems such as solar thermal systems or photovoltaic systems can; they must be evaluated as an integral part of a building's design and construction. Thirty years after the introduction of compulsory thermal insulation in most European countries, insulation materials still comprise the major means for improving a building's energy behavior. The use of insulation materials has increased, both in terms of the number of buildings being insulated and in terms of the minimum amount of insulation required by the national regulations [1]. In this study, the geometries of all of the buildings in each city of Turkey were examined. These buildings were classified for each climatic region, and model buildings were created. For the model buildings, heat losses, insulation thicknesses, and optimum insulation thicknesses were determined. The energy savings that would be achieved from modifications to all of these buildings were calculated. Effects of different insulation thicknesses on fuel consumption and thereby on emissions of pollutants such as CO2 are evaluated.
When the studies in the literature regarding this issue are analyzed, the fuel costs per unit area are calculated according to degree-day values. Hasan [2] used life cycle cost analysis to determine optimum insulation thicknesses. The results showed that savings up to 21 US$/m2 of wall area are possible for rock wool and polystyrene insulation. He determined payback periods of 1–1.7 years for rock wool and 1.3–2.3 years for polystyrene insulation, depending on the type of wall structure. Papadopoulos et al. [3] sorted old buildings by age and investigated the insulation payback period. Çomaklı and Yüksel [4] studied the optimum insulation thickness for the coldest cities in Turkey, and when the optimum insulation thickness was applied, a considerable energy saving of 12.11 US$/m2 of wall was obtained in Erzurum. Dombayci et al. [5] reported a study in 2006, in which five different energy sources and two insulation materials were compared when calculating the optimum insulation thickness of wall for Denizli in Turkey. Sisman et al. [6] investigated optimum insulation thicknesses for different degree-day regions of Turkey, namely, Izmir, Bursa, Eskisehir, and Erzurum for a lifetime of N years, by using the present worth value of annual energy savings for insulated external walls. Mahlia et al. [7] found a relationship between the thermal conductivity and optimum thickness of insulation material and gave a correlation for practical use. Özel [8] investigated the optimal location and distribution of insulation in a wall by considering the time lag and decrement factor for various wall orientations in both summer and winter conditions in Elazıg, Turkey. Results showed that the best thermal performance was obtained when three equal insulation layers were used: the first piece placed on the outdoor surface of wall, the second piece placed within the wall, and the third piece placed on the indoor surface of wall. Bolattürk [9] in 2006 selected 16 cities from 4 climate zones in Turkey to analyze the optimum insulation thicknesses, energy savings, and payback periods for various fuels and climate zones. Five different fuels (including coal, natural gas, fuel oil, liquefied petroleum gas, and electricity) and polystyrene insulation material were considered. Results show that optimum insulation thicknesses vary between 2 and 17 cm, energy savings vary between 22% and 79%, and payback periods vary between 1.3 and 4.5 years, depending on the city and the type of fuel. Another study was later reported by the same author [10] in 2008, in which the effects of different base temperatures on the optimum insulation thickness were analyzed in Turkey's warmest zone with respect to the cooling and heating degree hours. For cooling loads, the optimum insulation thicknesses vary between 3.2 and 3.8 cm, the energy savings vary between 8.47 and 12.19 US$/m2, and the payback periods vary between 3.39 and 3.81 years, depending on the cooling degree hours. For heating loads, optimum insulation thicknesses vary between 1.6 and 2.7 cm, energy savings vary between 2.2 and 6.6 US$/m2, and payback periods vary between 4.15 and 5.47 years. Masoso and Grobler [11] present the findings of a case study with building simulation using the Energy Plus dynamic thermal simulation software, in which wall insulation was varied together with cooling set-point temperature in a hot and dry climate in Botswana. Six sets of simulations (cooling set temperatures between 22°C and 26.5°C) were performed and the effect of the set point on the insulation was discussed. Simultaneously, Kaynakli [12] investigated the variation in annual energy requirement of buildings with various architectural design properties considering long term and current outdoor air temperature records in Bursa. The optimum insulation thicknesses for Bursa varied between 5.3 and 12.4 cm depending on the fuel used. In a subsequent study in 2009 [13], the optimum insulation thicknesses of the external walls, energy savings, and payback periods over a lifetime of ten years were calculated using the P1-P2 method for five different fuels, four different insulation materials, and various cities in Turkey. The results show that the optimum insulation thicknesses vary between 1.06 and 7.64 cm, energy savings vary between 19 US$/m2 and 47 US$/m2, and payback periods vary between 1.8 and 3.7 years, depending on the city and the type of fuel. In another study, Ucar and Balo [14] examined the energy savings and payback periods in the four climatic regions of Turkey for four different insulation materials applied to the external walls in the cases of five different fuel sources. The longest payback period was determined to be 2.25 years in the city of Mersin, where natural gas is used for heating. Daouas et al. [15] determined the optimum insulation thicknesses by developing and using a “Complex Finite Fourier Transform” analytical model because fixed insulation thicknesses were applied throughout Tunisia. The optimum insulation thickness was determined to be 5.7 cm, corresponding to a payback period of 3.11 years and energy savings of 58%. Özkan and Onan [16] determined the optimum insulation thicknesses according to Turkey's regions and used different insulation materials, such as XPS, polystyrene foam, and rock wool, and examined different fuels such as natural gas and fuel oil. Kaynakli [17] compiled the optimum thickness of the thermal insulation material applied to the buildings and the studies determining its impact on energy consumption. Ozel [18] analyzed a system with a 20-year life and showed that the optimum insulation thickness value varies between 5.4 and 19.2 cm, the energy savings vary between 86.26 and 146.05 US$/m2, and the payback period varies between 3.56 and 8.85 years. Bektas Ekici et al. [19] calculated the optimum insulation thickness, energy loss, and payback periods for four cities selected from different climatic regions according to the TS 825 (Antalya in the 1st region, Istanbul in the 2nd region, Elazığ in the 3rd region, and Kayseri in the 4th region). The optimum insulation thickness varied between 0.2 cm and 18.6 cm, energy savings varied between 0.038 US$/m2 and 250.415 US$/m2, and the payback period varied between 0.714 and 9.104 years. Badran et al. [20] performed a comparison between several wall, roof, and floor constructions and several levels of insulation thickness and the heating load calculations for those constructions (steady state analysis and dynamic behavior) were made. Zhou and Zhao [21] studied the energy-saving effects of different building envelop energy-saving technologies which were calculated and were compared with each other in the five major climatic regions of China. They used energy simulation with economic analysis to evaluate the optimum EPS insulation thickness for office buildings. Shekarchian et al. [22] determined the optimum insulation thickness influenced by local electricity tariff rate and the capital insulation outlays in Malaysia. And also some of the commonly used insulators available in the Malaysian market were analyzed. Ozel [23] determined the optimum insulation thicknesses, energy savings, and payback periods by using life cycle cost analysis. Two different wall structures and two different insulation materials (XPS and EPS) are used in calculations. Finally, they calculated fuel consumption and emissions of CO2 and SO2 by taking into consideration wall orientations for different structure and insulation materials. It is seen that optimum insulation thicknesses for south, north, east, and west orientations are obtained as 9.2, 10.2, 9.8, and 9.8 cm, respectively. Fang et al. [24] presented a technical-economic model for optimizing the thermal insulation thickness using Lagrange's method of undetermined multipliers. The approach was applied to a residential building in Shanghai in hot summer and cold winter zones and showed that the insulation on the west wall provided the largest savings, whereas the insulator on the south wall provided the smallest. Huang and Ye [25] established a mathematical model to calculate the optimum insulation thickness of external walls to estimate the life cycle cost including energy consumption and investment of insulation materials. Yu et al. [26] calculated the optimum thicknesses of five insulation materials (expanded polystyrene, extruded polystyrene, foamed polyurethane, perlite, and foamed polyvinyl chloride) with a typical residential wall using solar-air cooling and heating degree-day analysis. Total life cycle costs, savings, and payback periods were then calculated based on the life cycle cost analysis.
Unlike other studies, this investigation is the first one performed using the determination of the buildings’ heat losses. Through the determination of the building inventory in the country, the importance and negative impact of buildings without insulation on energy costs are asserted. Calculation of optimum insulation thickness has been made for natural gas for the model buildings in all climatic regions. And then, the effect of the alteration of insulation thickness on the pollutant emissions such as CO2 gets out from the chimneys for the different regions which are analyzed. The emissions of CO2 are decreased by maximum 44.7% for the cases in which optimum insulation material (XPS) and natural gas are used. Furthermore, the importance of this study is emphasized by examining the energy efficiency through the comparison of the optimum insulation thickness determined by the P1-P2 method and the minimum allowed insulation thickness for the current building inventory in Turkey.
The calculations were made for four degree-day regions of Turkey shown in Figure 1 with XPS (extruded polystyrene foam) as the insulation material. The density of the insulation material was 25 kg/m3 and thermal conductivity (λ) was 0.030 W/mK. Calculations of the optimum insulation thickness were made for natural gas.

Four degree-day regions of Turkey.

Monthly average outdoor temperature values (°C) used in heat loss calculation for the different regions.
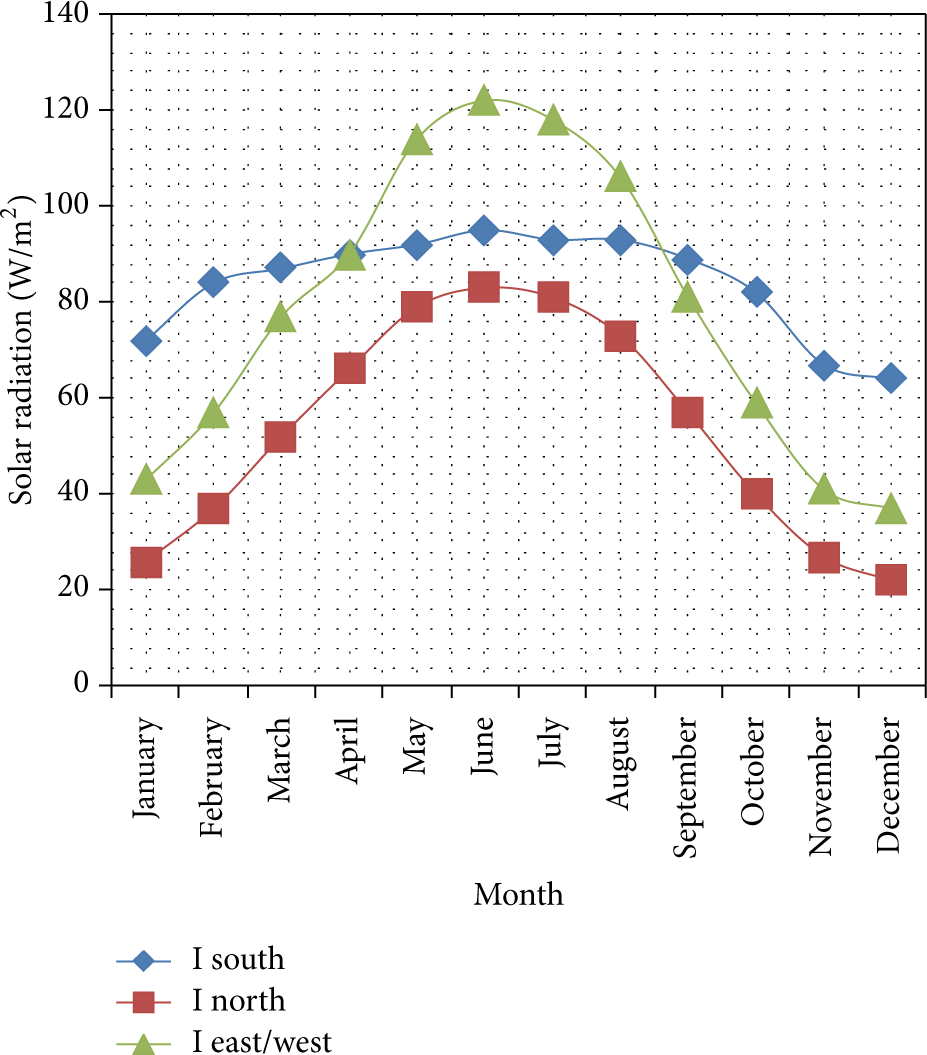
Monthly average solar radiation intensity used in the calculations (W/m2).
2. Annual Heating Energy Requirement Calculation Method
In our country, insulation thickness used in buildings is limited by heating energy requirements in TS 825 standard. Its method is similar to DIN 4108 and the method defined in DIN is adapted to our country. Turkey is divided into four regions according to climate conditions and these regions are shown in Figure 1. Annual heating energy requirements and the subequations are shown in (1)–(12). Descriptions and the formulas are shown, respectively.
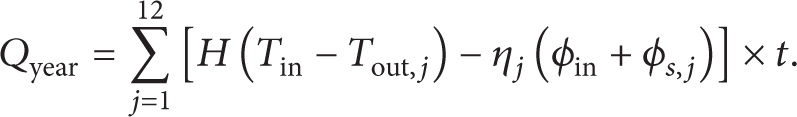
The annual heating energy requirements for the model buildings are calculated as given in [27]:
Monthly average solar energy gain is

g is the solar energy permeation factor:

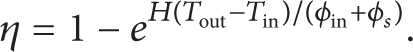
Unitless monthly average usage of heat gain factor (the ratio of the heat losses to the heat gains) is
Specific heat loss (H) of the building is calculated by adding the heat loss which occurred in consequence of conduction and convection (H tr ) to the heat loss which occurred in consequence of ventilation (Hven):

Heat loss occurred in consequence of ventilation:

Heat loss occurred in consequence of conduction and convection:

Rearranged version of (5) perimeter of the floor or ceiling area is shown by P:

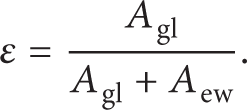
Ratio of the glazing area to the exterior wall surface area is shown by ε:
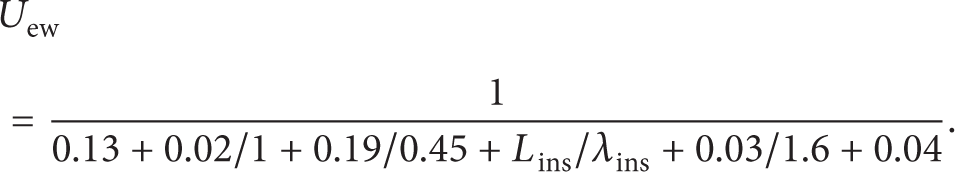
The wall conductance U for a typical wall that includes a layer of insulation is

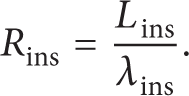
Rins is the thermal resistance of the insulation layer:
Rearranged version of (10) is
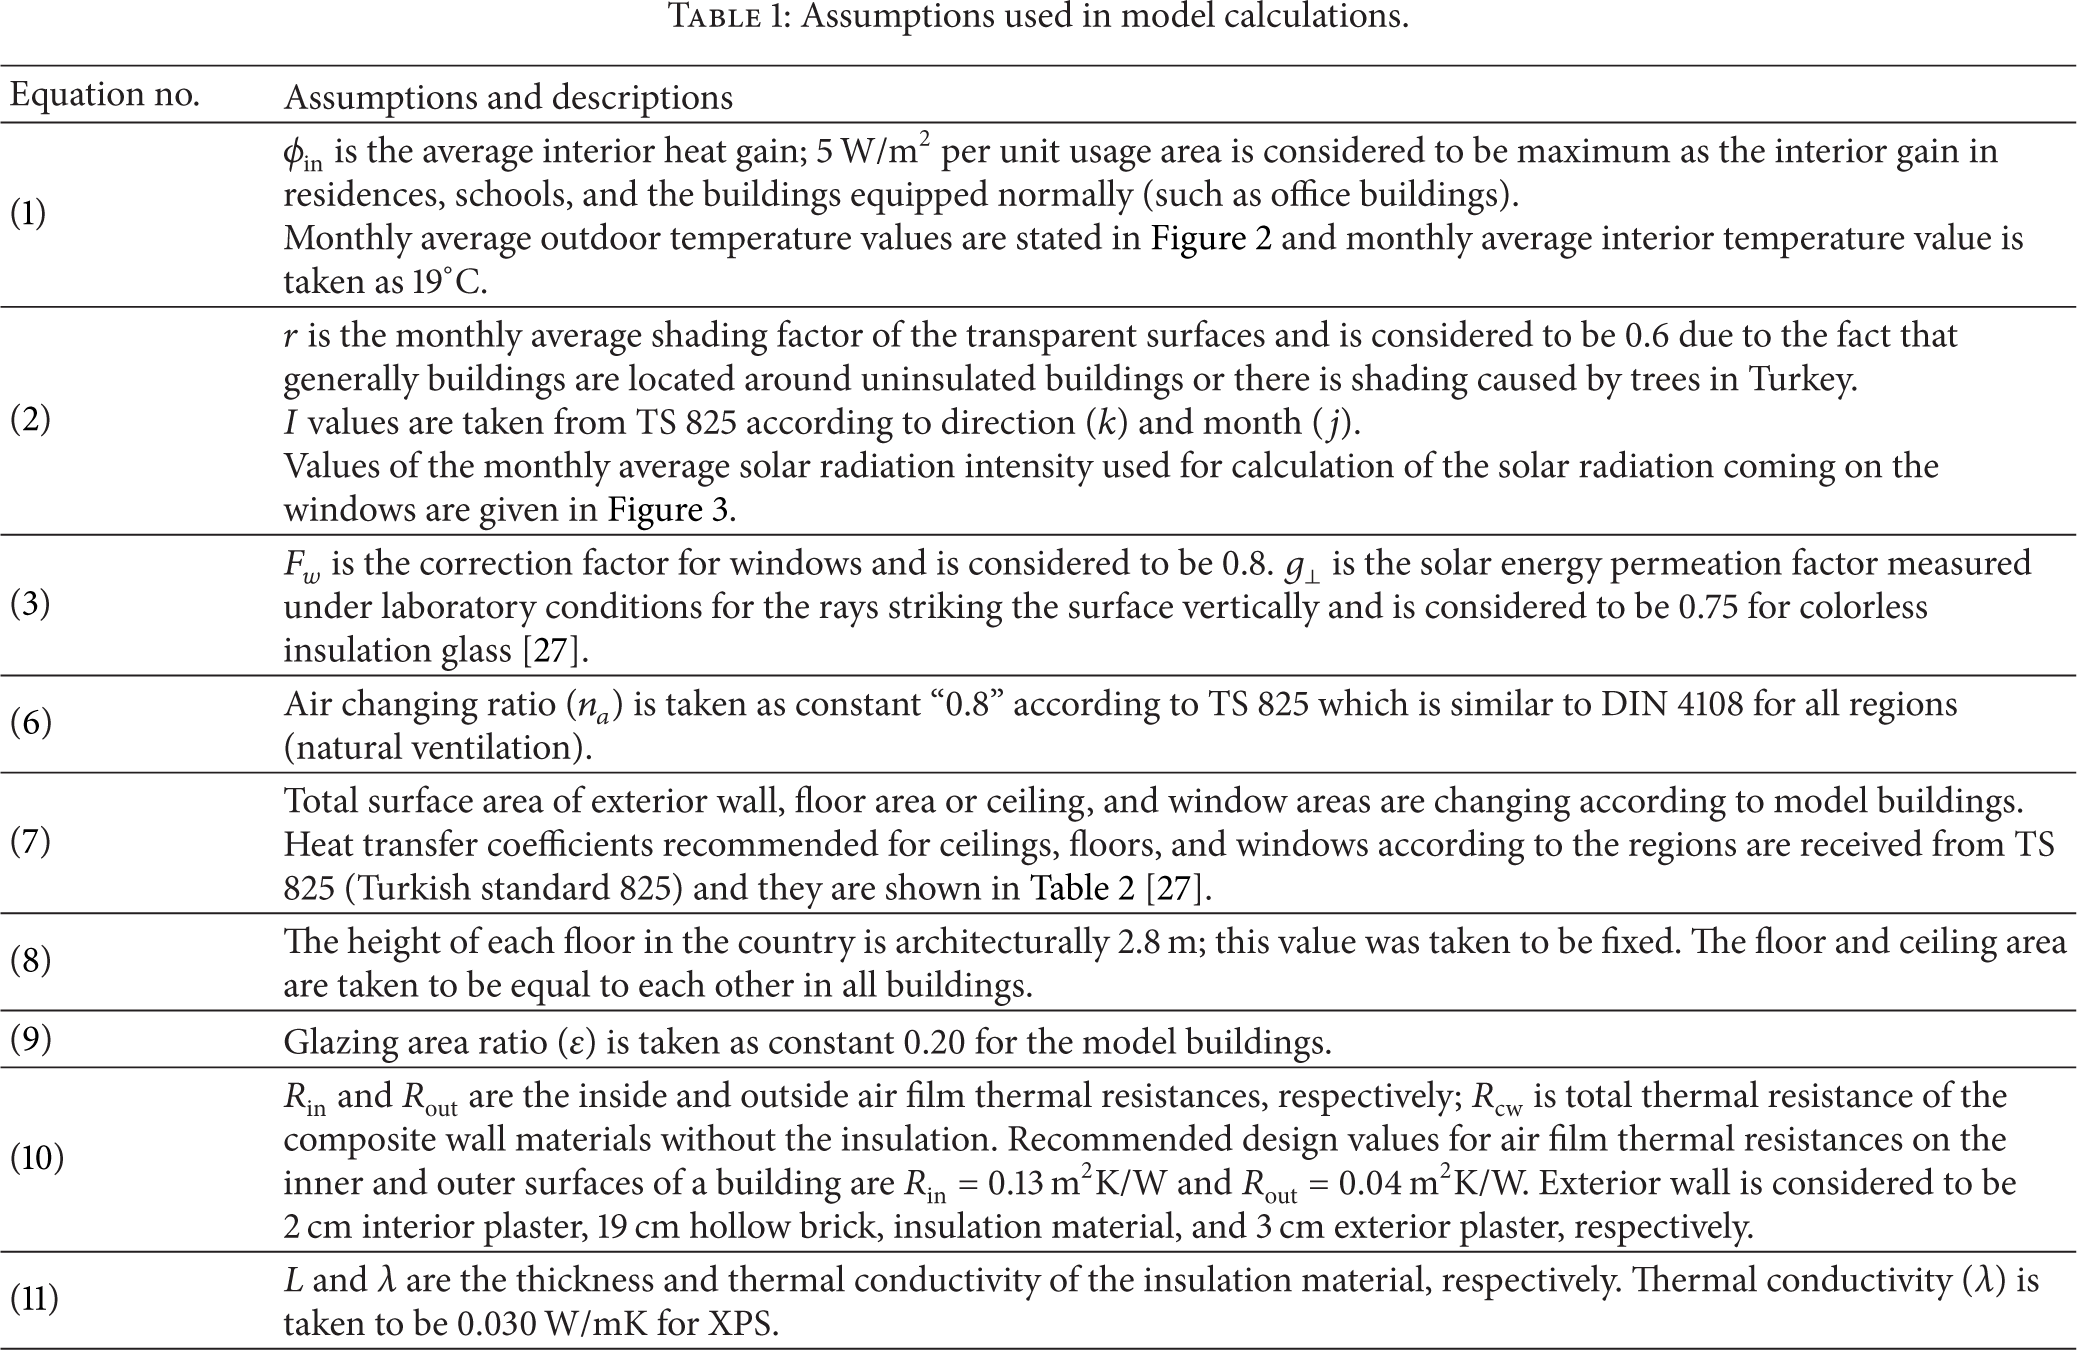
The assumptions used in (1)–(12) are also shown in Table 1.
Assumptions used in model calculations.
Values of the heat transfer coefficients (W/m2K).

Minimum insulation thickness is calculated by (13) according to TS 825 for all regions:
3. Determination of the Building Inventory and the Model Building
The building distribution in each city was determined by using the building inventory data taken from the State Institute of Statistics (Prime Ministry, Republic of Turkey) for 81 cities in Turkey, divided into four climatic regions. All of the cities specified in different colors in Figure 1 were grouped, and a model building for each region was created.
Weighted average is used and the average story numbers for cities are calculated by

When the story number distribution in Turkey is examined, the highest story value (3.38) is observed in Istanbul, which is located in the second degree-day region. The lowest story value (1.23) is observed in Iğdır city, which is located in the third degree-day region.
When the distribution of the floor area in Turkey is examined, the highest floor area value (195.85 m2) is observed in Ankara city, which is located in the third degree-day region. The lowest floor area value (116.04 m2) is observed in Aydın city, which is located in the first degree-day region.
Whereas model buildings are created for every region, the average floor area was determined by means of (15). Here, m represents the number of buildings, which varies based on the range of the base area, and n represents the cities found in this region:
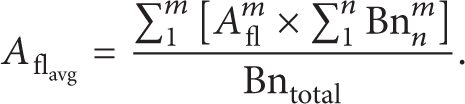
Likewise, for the floor height of the buildings, the Turkish city average was found using (16) for every region and is based on the cities and the distribution of the number of buildings. Building height is determined by multiplying story number by the height of the floor which is taken to be constant 2.8 as shown in Table 1:
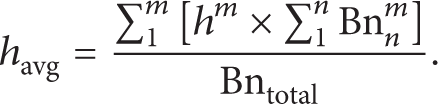
And the total building number used in (14)–(16) is calculated by

The variation of the floor areas of the buildings by region is given in Figure 4 and the variation of the building story number is shown in Figure 5. Based on these data, the specifications of the model buildings created for the thermal calculation are given in Table 3.
Specifications of the model buildings and building inventory.


Distribution of the number of buildings in four climatic regions based on the floor area.
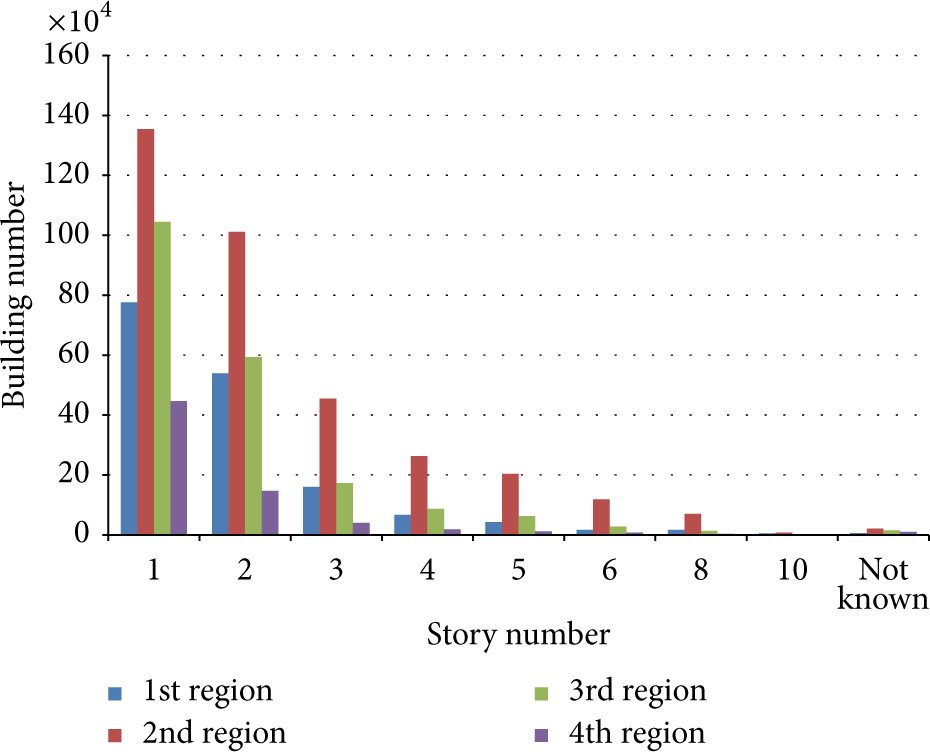
Distribution of the number of buildings in four climatic regions based on the story number.
4. Cost Analysis and Energy Saving, Payback Period Correlations
The P1-P2 method of calculating life cycle savings is particularly useful. Therefore, operation and investment costs of the building have been calculated according to the P1-P2 method [28]. Investment cost of the insulation is calculated by

Where C I (US$/m3) is the unit cost of the insulation and equals 162.6 US$/m3 for XPS. Annual fuel cost of the building heating system is found by the use of
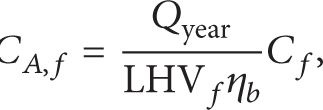
where LHV f is the low heating value of the fuel, equals 34485 kJ/Nm3, defines efficiency of the heating system, and is 90% and C f is the unit cost of the fuel and equals 0.44 US$/Nm3. After determination of the insulation and fuel costs, total net energy saving of the building is calculated by the use of the following equation according to the P1-P2 method:

The first cost of thermal insulation may be evaluated as capital investment. It is possible to calculate the present worth value of the amount of net energy savings via insulation using the P1-P2 method [28]. This is a practical, well-known method and can be used for optimizing the size of insulation of external walls [8, 10, 14]. P1 is the present worth factor of a series of N future payments with interest rate (I) per period accounting for the time value of money with inflation rate (d). P1 and P2 are used for a building insulation application as a nonincoming process:
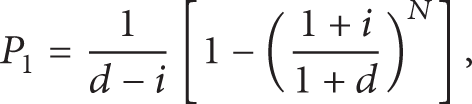
where P1 is the ratio of the cycle of fuel cost savings to the first year fuel cost savings and N is the lifetime of the investment and where 10 years is considered in the calculations. In this study, the average yearly inflation rate is considered to be 7.66% and the interest rate is considered to be 9.76%, according to the 2011 data of the Turkish Central Bank:
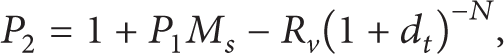
where P2 is the ratio of the life cycle expenditures incurred because of the additional capital investment to the initial investment, M s is the ratio of the annual maintenance and operation cost to the original first cost, and R v is the ratio of the resale value to the first cost. P2 can be taken as 1 if the maintenance and operation cost is zero [29].
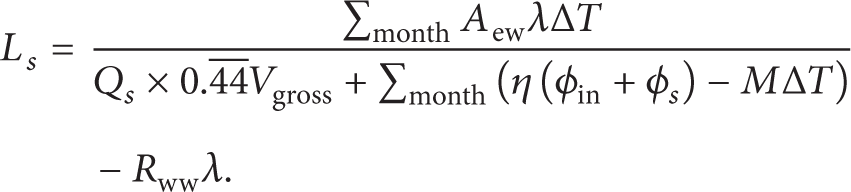
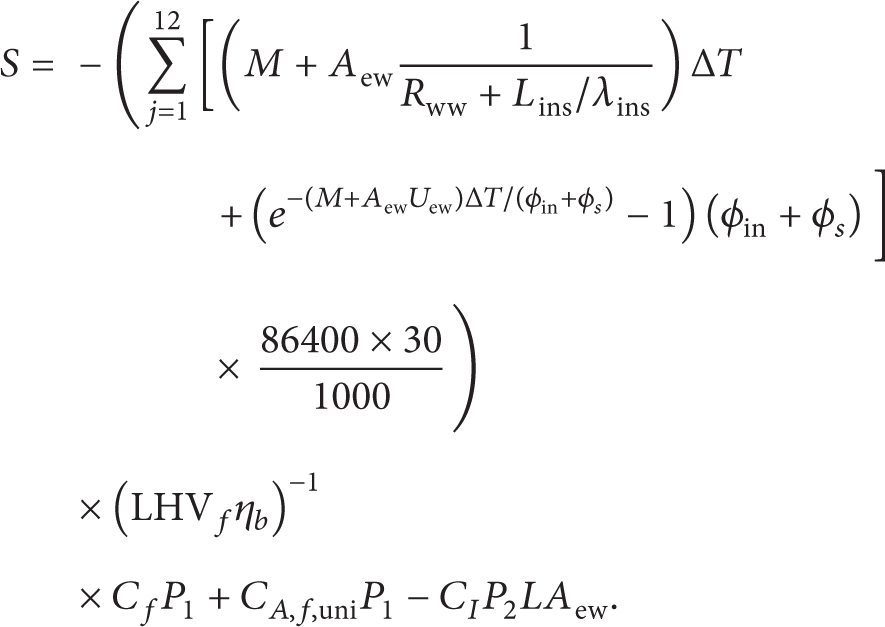
In the definition of the specific heat loss of the building (8), if the expression apart from the thermal resistance of the exterior wall is shown by M and the yearly heating energy requirement of the building is defined by (1), net energy saving of the model building is found by
The payback period of insulation cost, N, can be calculated by setting the net savings function to zero:

5. Optimum Insulation Thickness
Optimum insulation thickness is the value where the net energy saving is maximum. Therefore, if the derivative of the net energy saving defined by (23) is taken according to the insulation thickness (L) and then is made to be equal to zero, the following equation giving the optimum insulation thickness is found:

Temperature, solar radiation, and heat transfer coefficients vary according to the degree-day regions of Turkey, so that investment costs, operating costs, and optimum insulation thickness are determined using the MATLAB program in this study.
6. Relationship between Environment and Optimum Insulation Thickness
Turkey has 2.86 m3 reserve natural gas at the end of 2006 and the consumption in 2006 was 30.5 billion cubic meters so that our country imported 19.65 bcm from Russia [30]. Specifications of the Russian gas are taken into consideration and the general combustion formula for the complete combustion is given by

Excess air factor is taken to be 1.1 for the natural gas. Carbon dioxide which is discarded into the atmosphere and causes greenhouse effect is an accepted emission as a result of good combustion. The total emission of CO2 (kg CO2/year) is calculated by

where M f is the fuel consumption in the boiler system per year and M is the weight of the natural gas.
7. Analysis Results and Discussion
The annual heating energy requirement of the model building for each region was calculated from the data taken from the State Institute of Statistics (Prime Ministry, Republic of Turkey). The energy savings, payback period, and optimum insulation thickness were also determined.
7.1. Model Buildings Results
The annual heating energy requirements for all model buildings according to the regions are shown in Figure 6 for the case using XPS insulation and natural gas. It can be seen that the yearly heating energy requirement decreases due to an increase in the insulation thickness in buildings and that the yearly heating energy requirement changes proportionally with region.

Annual heating energy requirements for all model buildings.
Changes in the energy savings (US$) per model building for all regions are shown in Figure 7 according to the insulation thickness. The energy savings in the 1st region are calculated to be 2000 US$, whereas the savings would be 8000 US$ in the 4th region. The peak points of the curves show the optimum insulation values. Figure 8 shows the change in the payback period versus insulation thickness for all regions. With increasing insulation thickness, the payback period calculated by the P1-P2 method increases as well.
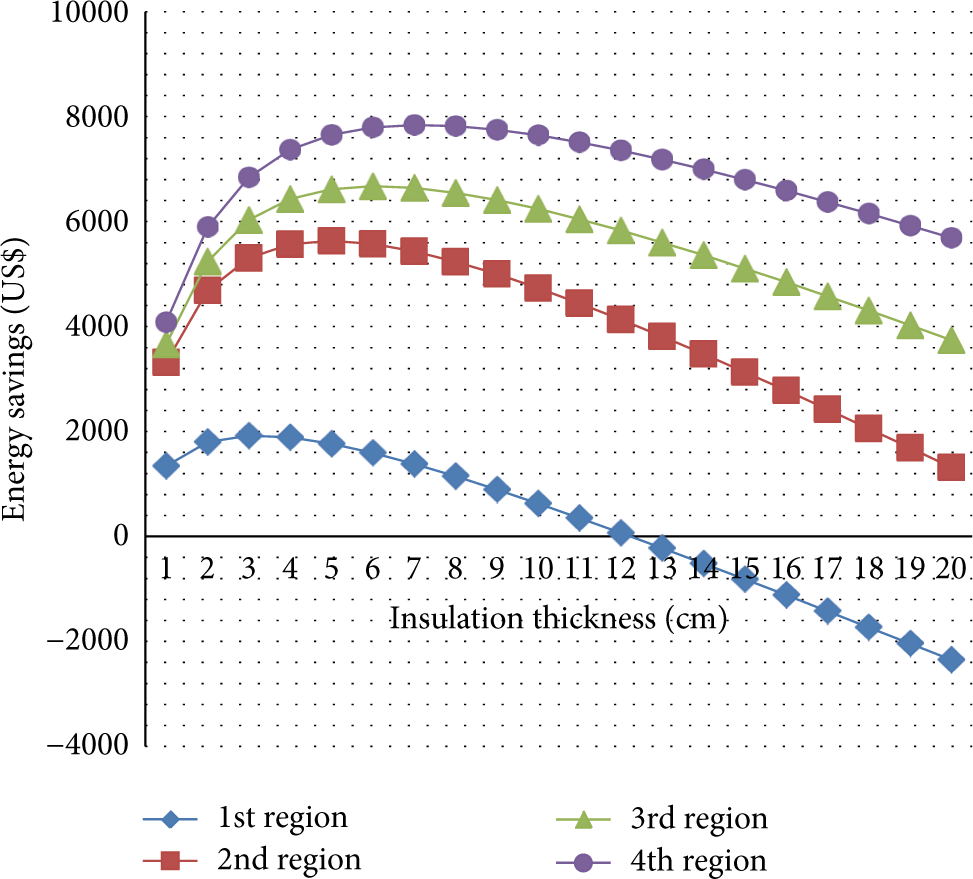
Energy savings (US$) per model buildings.

Change of payback period according to insulation thickness.
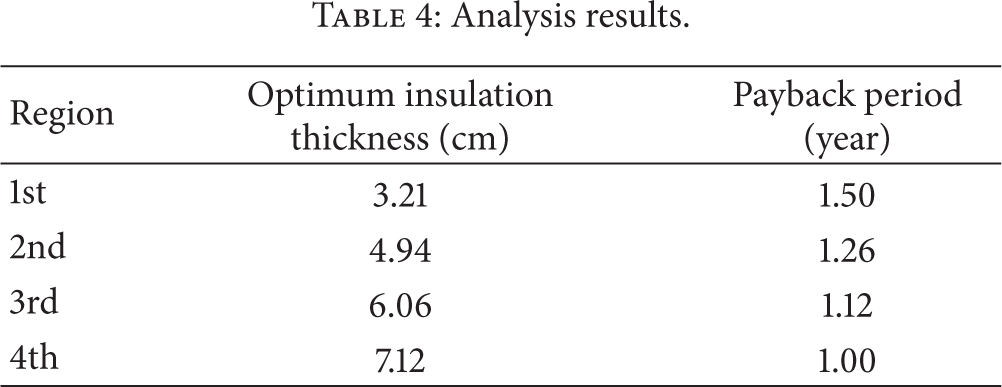
The energy savings (US$/m2) of a building heated by natural gas, the payback period of the insulation application, and the optimum insulation thickness values for the four regions are shown in Table 4. The optimum insulation thickness calculated using the P1 − P2 method with natural gas fuel varies between 3.21 cm and 7.12 cm, depending on the region; the energy savings per area vary between 9.23 US$/m2 and 43.95 US$/m2.
Analysis results.
7.2. Global Effects and Environmental Impacts
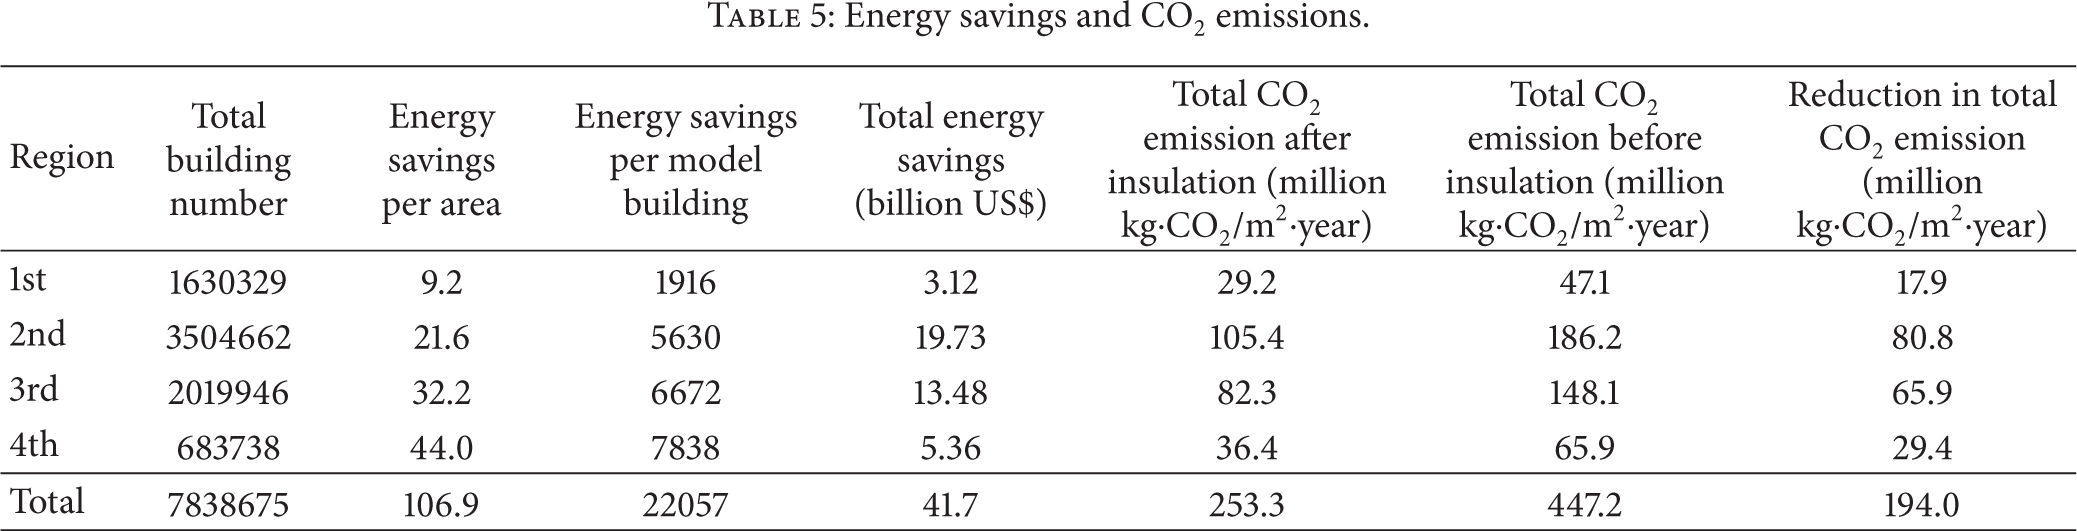
The total energy savings and CO2 emissions per square meter determined from the total number of buildings were calculated for each model building, as shown in Table 5. For the case in which the optimum insulation thickness is applied in the model building, the total energy savings for each region are seen in Table 5 and the total energy savings for the country are calculated to be 41.7 billion US$.
Energy savings and CO2 emissions.
The change of the CO2 emission values according to insulation thickness applied to the model buildings in four climatic regions in Turkey is shown in Figure 9.

Change of CO2 emission per model building according to insulation thickness.
The reduction ratios in the CO2 emission values are given in Table 6 when the optimum insulation thickness was applied in the model buildings. The highest reduction is observed in the 4th and 3rd regions and the minimum reduction is seen in the 1st region by 38%.
Natural gas CO2 emission results for model buildings.

The CO2 emissions are shown in Table 7 after and before the insulation application for the current building inventory in Turkey. When the reduction in total CO2 emissions is examined, the first region has the minimum value and the second region has the maximum value.
Natural gas CO2 emission results for all buildings in Turkey.

7.3. Comparison of the Model Building Results
Model results are compared with the latest optimization studies and the results are given in Table 8. Parameters such as interest rate, inflation rate, wall resistance, cost of fuel, insulation material, and thermal conductivity are different from each other in the calculations, so that results show variation when making comparison. Bektas Ekici et al. [19] used different wall components thicker than those used in this study. Ozel [18] made the model calculations for both heating season and cooling season. And also Ozel [18] accepted lifetime as 20 years. The calculation method is similar with Özkan and Onan [16] but they used constant geometric parameters in their study. In our model, calculations are made for the model building created by the data taken from the State Institute of Statistics (Prime Ministry, Republic of Turkey). Ucar and Balo [13] determined their results according to sandwich wall with insulation material so that their results are lower than this study. Dombayci et al. [5] took insulation cost 29 $/m3 in the case; they used expanded polystyrene as an insulation. However, calculations in this study are done using 162 $/m3, the recent price of extrude polystyrene which is used as an insulation material, so a difference between energy-saving values occurs. Overall, the results shown in Table 8 are similar to this model results.
Comparison of the model building results data with the latest studies.

8. Conclusion
The optimum insulation thicknesses of model buildings, the energy savings over a lifetime of 10 years, and the payback periods are calculated for the four different climatic regions in Turkey. The results show that the optimum insulation thicknesses vary between 3.21 and 7.12 cm, the energy savings vary between 9.23 US$/m2 and 43.95 US$/m2, and the payback periods vary between 1 and 8.8 years depending on the regions. The results show that the total energy savings vary between 3.12 and 19.73 billion US$ in Turkey. New correlations are given to determine the optimum insulation thickness for all concept buildings or models. Heat gains, solar radiation, and economical data are affecting the optimum insulation thickness. When the building inventory is examined, the number of buildings in the 1st region is approximately the same as the number of buildings in the 3rd region. For this reason, the distribution of the buildings is a parameter affecting the energy savings. Another factor is the application of the insulation material at the optimum thickness. Energy savings will be reduced if the insulation application is not made at the determined thickness. The savings seen in the country within a short time of 10 years are approximately forty billion dollars and will increase further when the financial returns, energy planning, and investments of the country are considered. For this reason, energy efficiency in buildings is important. When the reduction in total CO2 emissions is examined for all buildings in Turkey, the first region has the minimum value and the second region has the maximum value. One tree will prevent the release of 2.3 kg CO2. The twenty-three percent of the total forest area in Turkey is recommended before the insulation applications. It should be noted that, after the insulation, it could be decreased to 13.5%. An increase in the insulation thickness will reduce the energy consumption in buildings. As a result of this, the emission rates of combustion products decrease such as CO2. In the case in which natural gas is used as a fuel and optimum insulation material (XPS) is applied, the emissions of CO2 are decreased by maximum 44.7% in the 4th region and minimum 38.0% in the 1st region.
Footnotes
Nomenclature
Conflict of Interests
The author declares that there is no conflict of interests regarding the publication of this paper.