
Abstract
Recently, the rebar bending methodology started to change from field processing to utilizing rebar bending machines at plant sites prior to transport to the construction locations. Computerized control of rebar plant bending machines provides more accurate and faster bending of rebars than the low quality inefficient field processing alternative. The bending process involves plastic deformation of rebars, where bending stress beyond the yield point of the material is applied. When the bending stress is removed, spring back is caused by the elastic restoring stress. Therefore, an accurate numerical analysis of the spring-back process is required to reduce the bending process errors. The most sensitive factors affecting the spring-back process are the bending radius, the bending angle, the diameter of the rebar, the friction coefficient, and the yielding strength of material. In this paper, we suggest a numerical modeling method using these factors. The finite element modeling of the dynamic mechanical behavior of the material during bending is performed using a commercial dynamic analysis program “DAFUL.” We use the least squares approach to derive the spring-back deflection as a function of the rebar bending parameters.
1. Introduction
In the past, rebar bending was performed by workers utilizing bending machines on construction sites. This process is termed the “rebar field processing.” The rebar field processing is characterized by the high loss of material and poor quality of finishing because the accuracy of bending depends mostly on workers’ experience [1, 2]. To enhance quality of rebar processing the rebar plant processing has been developed. The rebar plant processing provides better quality work and has higher productivity than rebar field processing because of computer control of automated bending machines allowing for the reduction of construction time and the number of field employees [3, 4]. The accuracy of prediction of spring-back phenomenon plays a key role in the success of computer control of the rebar bending. Spring-back phenomenon refers to a process of partial recovery of shape of the bended rebar due to elastic recovery of the rebar material once the applied stress on the rebar is released. The spring-back deflection depends most strongly on the bending angle, bending radius, diameter of the rebar, friction coefficient, and yielding strength of material [5–7].
In the past decades the spring-back phenomenon has been studied mostly experimentally. Pourboghrat and Chu [8] have predicted the phenomenon in plane-strain conditions. Kawaguchi et al. [9] studied the phenomenon and associated residual stresses of a cantilever with finite element analysis (FEA). Al-Qureshi analyzed the phenomenon considering the bending radius, thickness of material, and stress-strain of the material using an upper-bound elemental technique and experimental validation was performed as well [10]. In this paper, the FAE simulation of the rebar bending process was performed with a commercial dynamic analysis program “DAFUL” to investigate the spring-back phenomenon considering influence of the factors such as the bending angle, the bending radius, the diameter of rebar, friction coefficient, and yielding strength of material. The generated FEA data is subsequently used to derive the functional relationship between the parameters above and the spring-back deflection [11, 12]. In order to validate the resulting formulas, we recalculated the spring-back ratio with the new parameter values that were not used to derive the formula and compared the spring-back ratio predicted by the derived functional dependence with the FEA results.
2. A Numerical Analysis of Spring-Back in Rebar Bending
2.1. Rebar Bending Machine
Figure 1 illustrates the schematic of a bending machine used in this research. It consists of a frame part, a rebar fixing part, and a bending part. The frame part moves the bending part in accordance with the programmed instructions. The rebar fixing part, which supports a rebar and moves vertically in the bending direction, is located in the middle of the frame part. The bending part bends a rebar.

Rebar bending machine.
Figure 2 shows the bending part of the bending machine in more detail. It consists of a rotating roller, fixed roller, and guide. The guide is installed to prevent the slip of the rebar upward during the bending process as illustrated in Figure 3. The rotating roller, placed at various angular positions, controls the bending angle, while the bending radius can be changed by exchanging the fixed rollers of various sizes.

Bending part of the rebar bending machine.

The illustration of the guide's role in preventing the slip of the rebar.
The bending process generally operates in a clockwise direction, but when the rebar is too long, it must operate in a counterclockwise direction. For this reason the bending head moves back before the rebar is placed under the fixed roller, and then the bending head returns to its initial position. This allows the rebar to be processed in a counterclockwise direction.
2.2. Finite Element Modeling
2.2.1. Finite Element Modeling System
Figure 4 shows the schematic diagram of the bending part. The rotating roller, fixed roller, and guide are made with SCM415 carburizing heat-treated steel that has very high stiffness. Thus FEA modeling assumes that there is no mechanical deformation of the rebar bending machine and the components defined as rigid bodies.

Schematic diagram of the bending part.
The contact conditions between the rebar and the two rollers are characterized by 10000 N/m of contact stiffness. Fixed points are stipulated at the tip of the rebar and guide. A revolution joint is stipulated at the center of fixed roller to define the axis of rotation of the rotating roller. In the spring-back process simulation, the revolution joint and contact conditions between the rotating roller and the rebar are terminated at the end of the bending process.
2.2.2. Material Properties in Finite Element Model
The material properties of the rebar are assigned to the FE rebar model. In Figure 5, the rebar is characterized by a bilinear stress-strain curve where Young's modulus of the elastic section is 200 GPa and that of the plastic section is 1.45 GPa. The point of intersection of the two slopes corresponds to initial yielding stresses. Generally, the initial yielding strength of rebar material ranges between 250 MPa and 650 MPa and the 250 MPa initial yielding strength is the most common.

Stress-strain curve of structural steel.
2.3. Spring-Back Analysis in the Bending Processing
We performed FEA to investigate how the factors, the bending radius, the diameter of the rebar, friction coefficient, and yielding strength of material, affect the spring-back process as the bending angle varies. So, the following cases of FE models are considered:
rebar diameter: (1) φ10 mm, (2) φ13 mm, (3) φ16 mm, (4) φ19 mm, and (5) φ22 mm with a φ30 mm bending radius, 0.3 coefficient, and 250 MPa initial yielding strength;
bending radius: (1) φ20 mm, (2) φ25 mm, (3) φ30 mm, (4) φ35 mm, and (5) φ40 mm with 10 mm diameter rebar, 0.3 coefficient, and 250 MPa initial yielding strength;
friction coefficient: (1) 0.1, (2) 0.2, (3) 0.3, (4) 0.4, and (5) 0.5 with φ10 mm diameter rebar, a φ30 mm bending radius, and 250 MPa initial yielding strength;
yield strength: (1) 250 MPa, (2) 350 MPa, (3) 450 MPa, (4) 550 MP, and (5) 650 MPa, with φ10 mm diameter rebar, a φ30 mm bending radius, and 0.3 friction coefficient.
We performed FEA with varying bending angles set at 90°, 100°, 110°, 120°, 130°, 140°, 150°, 160°, 170°, and 180°.
Figure 6 illustrates the definition of the spring-back ratio. θ1 is an angle before the spring-back and θ2 is an angle after the spring back. The spring-back ratio can be expressed as θ2/θ1 [13].

Definition of the spring-back ratio. t: the diameter of a rebar, θ1: the angle before the spring back, θ2: the angle after the spring-back, and Δθ: the spring-back angle.
Figure 7 demonstrates the stresses in the rebar during the bending process. Figure 7(a) shows the rebar before the process, Figure 7(b) shows the rebar mid-process, Figure 7(c) shows the end of the process before the spring back, and Figure 7(d) shows the final rebar shape after the spring back. θ1 and θ2 are measured from Figures 7(c) and 7(d) to calculate the spring-back ratio.

Stresses in the rebar: (a) before bending; (b) at an intermediate step during the bending; (c) before the spring back; (d) after the spring back.
2.4. Results of the Spring-Back Process Analysis
2.4.1. Effects of the Bending Angle on the Spring-Back Deflection
We have performed FEA modeling with φ10 mm, φ13 mm, φ16 mm, φ19 mm, and φ22 mm diameters of the rebar, φ20 mm, φ25 mm, φ30 mm, φ35 mm, and φ40 mm of bending radii, 0.1, 0.2, 0.3, 0.4, and 0.5 of friction coefficient, and 250 MPa, 350 MPa, 450 MPa, 550 MPa, and 650 MPa of initial yielding strength to analyze the spring-back phenomenon using 90°, 100°, 110°, 120°, 130°, 140°, 150°, 160°, 170°, and 180° of bending angle. Figures 8, 10, 12, and 14 show that a greater bending angle results in a greater spring-back angle for each of the diameters of the rebar, and maximum spring-back angles are ~5.1°, ~12.75°, ~7.98°, and ~13.68° at 180° bending angle.

3D graph of spring-back angle as a function of the rebar diameter and the bending angle according to the FEA modeling (the bending radius = φ30 mm, the friction coefficient = 0.3, and the initial yielding strength = 250 MPa).
2.4.2. Effect of the Rebar Diameter on the Spring-Back Deflection
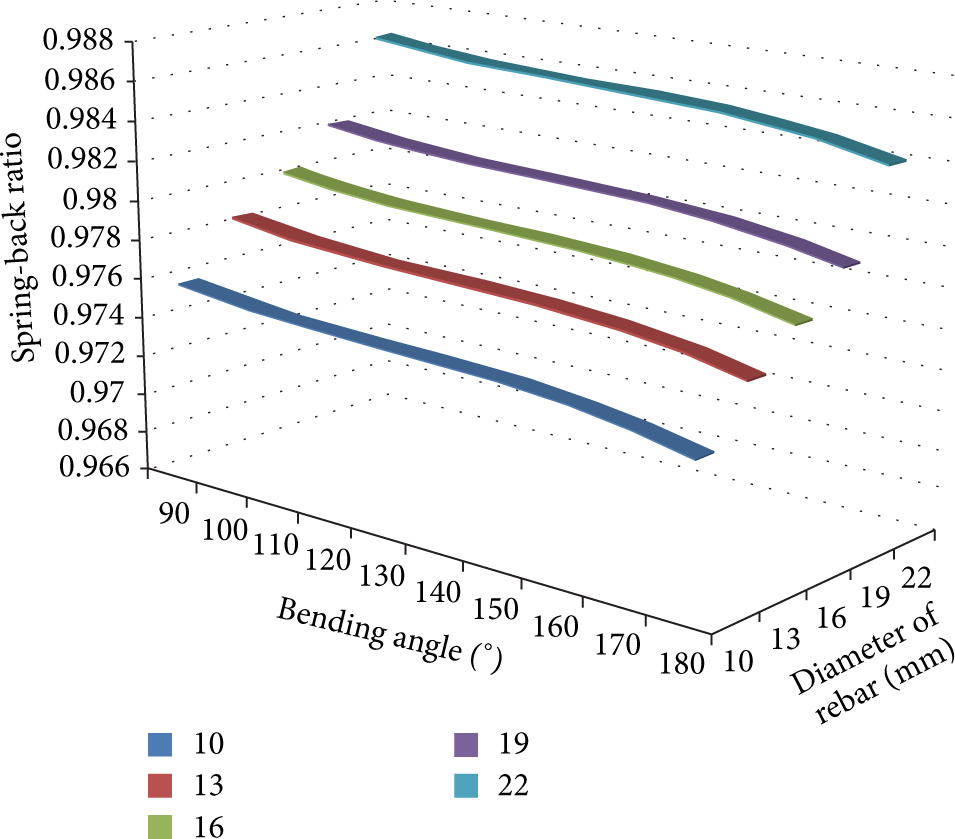
Figure 8 shows the result of spring-back angle according to each rebar diameter. This result shows that a greater diameter of rebar results in a lower spring-back angle. On the other hand, Figure 9 shows that the spring-back ratio increases with the bending angle, as does the spring-back angle.

3D graph of spring-back ratio as a function of the rebar diameter and the bending angle according to the FEA modeling (the bending radius = φ30 mm, the friction coefficient = 0.3, and the initial yielding strength = 250 MPa).
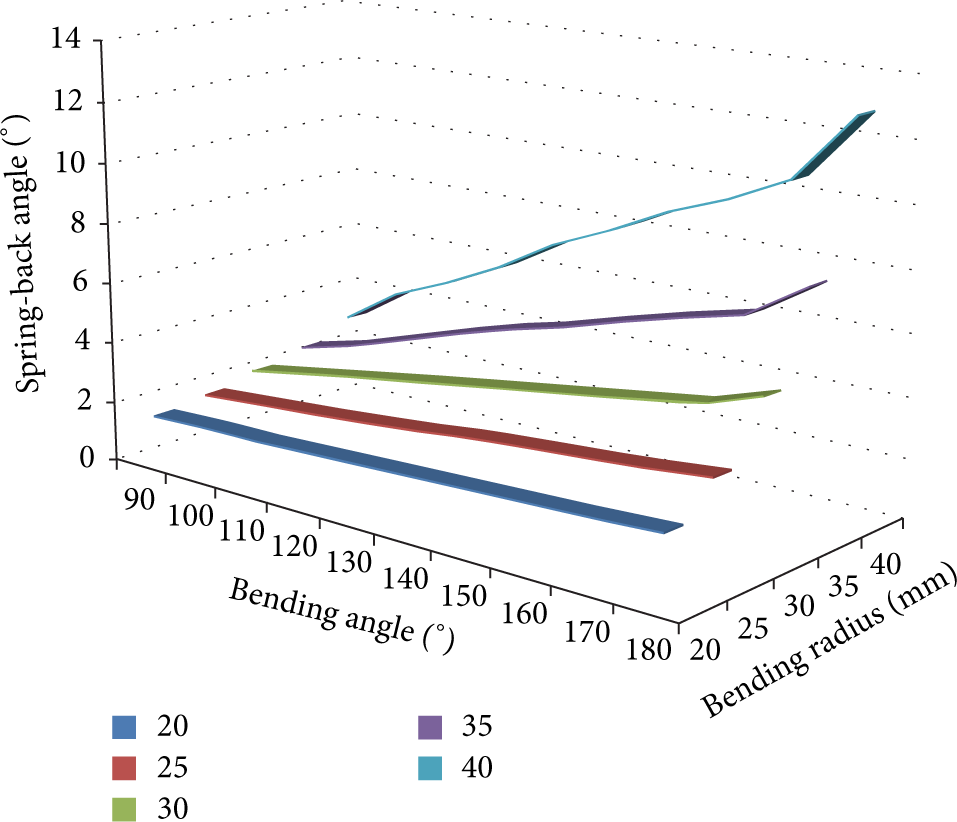
3D graph of the spring-back angle as a function of the bending radius and the bending angle according to the FEA modeling (the diameter of rebar = φ10 mm, the friction coefficient = 0.3, and the initial yielding strength = 250 MPa).
2.4.3. Effect of Bending Radius on Spring-Back Deflection
Figure 10 demonstrates the FEA modeling results of the spring-back angle as a function of the bending radius. The result shows that a greater bending radius results in a greater spring-back angle, and there is ~10° difference in the spring-back angle at a bending angle of 180° between the φ20 mm and φ40 mm bending radius. Figure 11 shows that a greater bending radius results in a lower spring-back ratio.
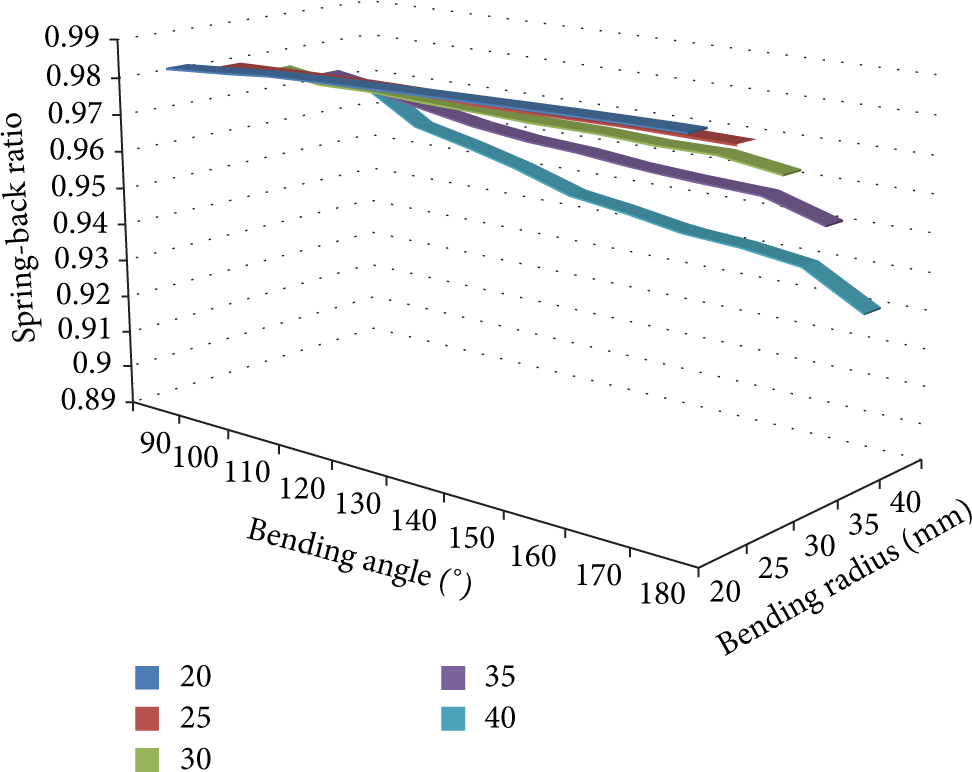
3D graph of the spring-back ratio as a function of the bending radius and the bending angle according to the FEA modeling (the diameter of rebar = φ10 mm, the friction coefficient = 0.3, and the initial yielding strength = 250 MPa).

3D graph of the spring-back angle as a function of the friction coefficient and the bending angle according to the FEA modeling (the diameter of rebar = φ10 mm, the bending radius = φ30 mm, and the initial yielding strength = 250 MPa).
2.4.4. Effect of Friction Coefficients on Spring-Back Deflection
Figure 12 demonstrates the FEA modeling results of the spring-back angle as a function of the friction coefficient. The result shows that a greater friction coefficient results in a lower spring-back angle, and there is ~3.68° difference in the spring-back angle at a bending angle of 180° between the 0.1 and 0.5 friction coefficient. Figure 13 shows that a greater friction coefficient results in a greater spring-back ratio.

3D graph of the spring-back ratio as a function of the friction coefficient and the bending angle according to the FEA modeling (the diameter of rebar = φ10 mm, the bending radius = φ30 mm, and the initial yielding strength = 250 MPa).
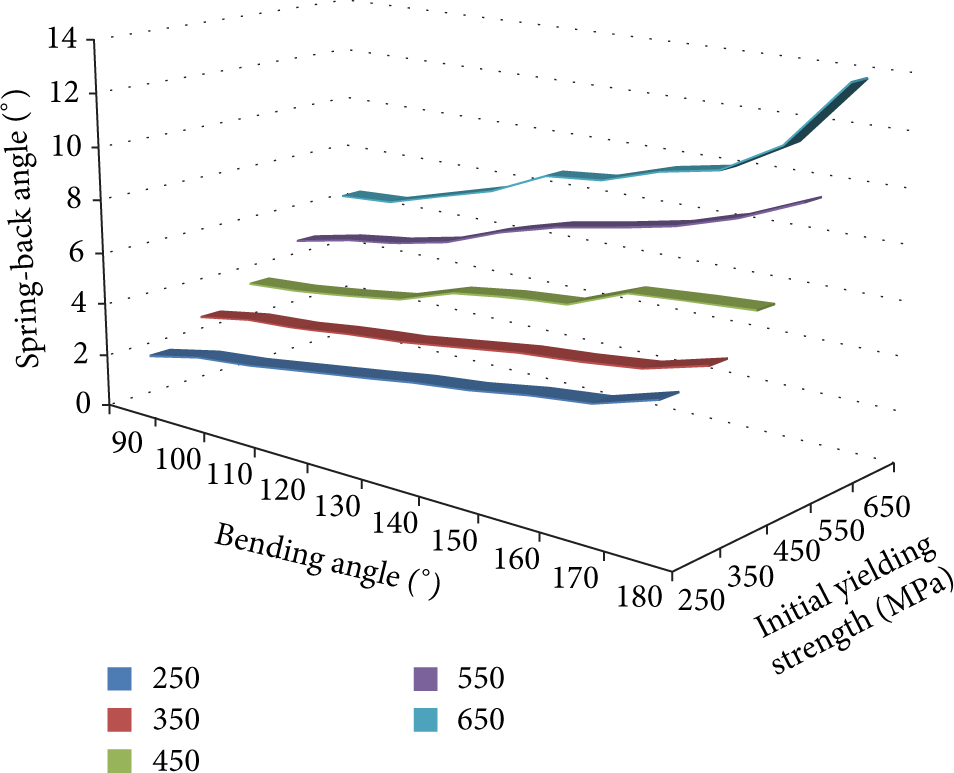
3D graph of the spring-back angle as a function of the initial yielding strength and the bending angle according to the FEA modeling (the diameter of rebar = φ10 mm, the bending radius = φ30 mm, and friction coefficient = 0.3).
2.4.5. Effect of Initial Yielding Strength on Spring-Back Deflection
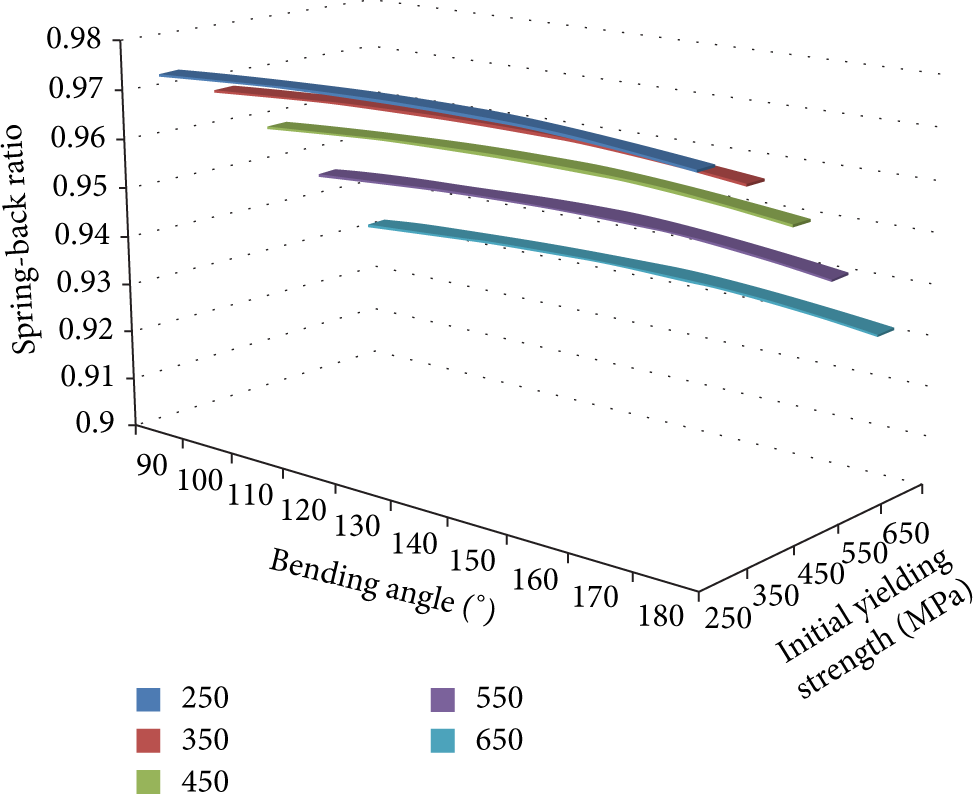
Figure 14 demonstrates the FEA modeling results of the spring-back angle as a function of initial yielding strength. This result shows that a greater initial yielding strength results in a lower spring-back angle, and there is ~8.56° difference in the spring-back angle at a bending angle of 180° between the 250 MPa and 650 MPa initial yielding strength. Figure 15 shows that a greater initial yielding strength results in a lower spring-back ratio.

3D graph of the spring-back ratio as a function of the initial yielding strength and the bending angle according to the FEA modeling (the diameter of rebar = φ10 mm, the bending radius = φ30 mm, and friction coefficient = 0.3).
2.5. Derivation of the Functional Relationship for the Spring-Back Ratio Using Least Square Technique
The spring-back angle was estimated via FEA modeling as a function of the bending angle, the bending radius, and the diameter of the rebar. We propose the use of mathematical modeling to develop a processing program for an automated rebar bending machine. We have derived a functional relationship of the spring-back ratio using the method of least squares. The method of least squares assumes that the best-fit curve of a given type is the curve that has the minimal sum of the deviations squared as represented by the following:

2.5.1. The Spring-Back Ratio as a Function of the Diameter of Rebar and the Bending Angle
The spring-back ratio has a nonlinear dependence on the bending angle and the diameter of rebar. We have derived a functional dependence of the orders from 1st to 4th. Then, we have compared the FEA data with the derived functional values and determined the corresponding errors for each equation. The error of the second-order derived formula is ~6.65%, that of the third-order derived formula is ~4.1%, and that of the fourth-order derived formula is ~4%. Equation (2) is the derived fourth-order functional relationship. Figure 16 shows the fourth-order functional dependence of the spring-back ratio on the bending angle and the diameter of rebar for φ30 mm bending radius, 0.3 friction coefficient, and 250 MPa initial yielding strength. Consider

3D graph of the spring-back ratio as a function of the bending angle and the diameter of rebar calculated as a fourth-order functional dependence (the bending radius = 30 mm, the coefficient = 0.1, and the initial yielding strength = 250 MPa).
2.5.2. Formula of Spring-Back Ratio according to Bending Radius and Bending Angle
We have also derived nonlinear relationships of the spring-back ratio as a function of the bending angle and the bending radius using functional dependences from first- to fourth-orders. Similar to the analysis above, we have estimated the error of different functional relationships by comparison of the derived functional relationship values with the FEA data. The error of the second-order formula is ~14.14%, and the errors of the third- and fourth-order derived formula are each ~13.35% and ~12.71%, respectively. The fourth-order equation has the closest data to FEA data. Equation (3) is fourth-order derived functional relationship. Figure 17 shows the fourth-order dependence of the spring-back ratio on the bending angle and bending radius for φ10 mm rebar, 0.3 friction coefficient, and 250 MPa initial yielding strength:


3D graph of the spring-back ratio as a function of the bending angle and the bending radius calculated by fourth-order relation formula (the diameter of rebar = φ10 mm, the coefficient = 0.1, and the initial yielding strength = 250 MPa).
2.5.3. Formula of Spring-Back Ratio according to Friction Coefficient and Bending Angle
With already confirming that fourth-order derived formula is the closest with the FEA data, we only derived fourth-order formula similar to the above. The error of the fourth-order derived formula is ~3.8%, and (4) is the derived fourth-order functional relationship. Figure 18 shows the fourth-order functional dependence of the spring-back ratio on the bending angle and the friction coefficient for φ10 mm rebar, φ 30 mm bending radius, and 250 MPa initial yielding strength:


3D graph of the spring-back ratio as a function of the bending angle and the friction coefficient calculated by fourth-order relation formula (the diameter of rebar = φ10 mm, the bending radius = φ30 mm, and the initial yielding strength = 250 MPa).
2.5.4. Formula of Spring-Back Ratio according to Initial Yielding Strength and Bending Angle
With already confirming that fourth-order derived formula is the closest with the FEA data, we only derived fourth-order formula similar to the above. The error of the fourth-order derived formula is ~3.6%. Equation (5) is fourth-order derived functional relationship. Figure 19 shows the fourth-order dependence of the spring-back ratio on the bending angle and the initial yielding strength for φ10 mm rebar, φ 30 mm bending radius, and 0.1 friction coefficient:
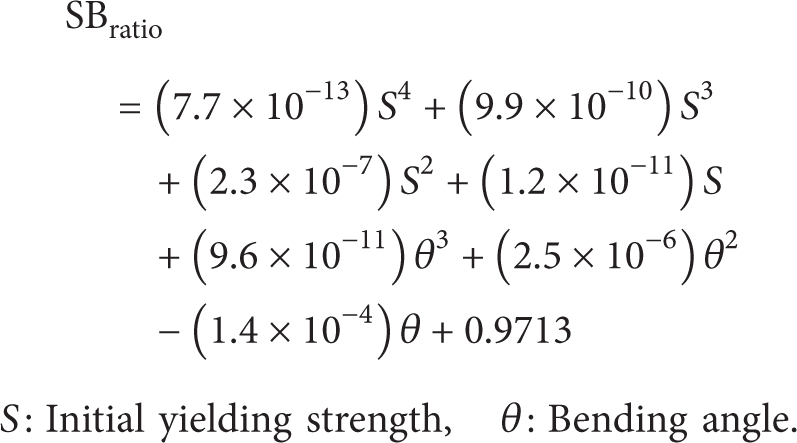
3D graph of the spring-back ratio as a function of the bending angle and the initial yielding strength calculated by fourth-order relation formula (the diameter of rebar = φ10 mm, the bending radius = φ30 mm, and the friction coefficient = 0.1).
2.6. Validation of the Derived Relation Formulas
In order to validate the derived functional relationships of the spring-back ratio, we calculated the spring-back ratio by both the FEA and the derived functional dependence using new parameter values that were not used to derive the formula. Table 1 shows the data of the FEA and the derived relation formula for the rebar diameters of φ12 mm, φ15 mm, and φ18 mm and for the bending angles of 95°, 135°, and 175°. The average relative error between the FEA results and the functional prediction is ~6.77%. Table 2 contains similar comparison preformed for FEA prediction versus the derived relation formula for the bending radius and bending angle. The average relative error between them is ~14.38%. Tables 3 and 4 show the data of the FEA to verify the derived relation formulas, which are (4) and (5), for the friction coefficient of 0.15, 0.25, and 0.35 and for the initial yielding strength of 300 MPa, 400 MPa, and 500 MPa. The average relative errors between them are ~6.55% and ~7.94%.
Comparison of the spring-back angles as functions of the rebar diameter and the bending angle computed via FEA modeling and calculated by the derived functional dependence equations.
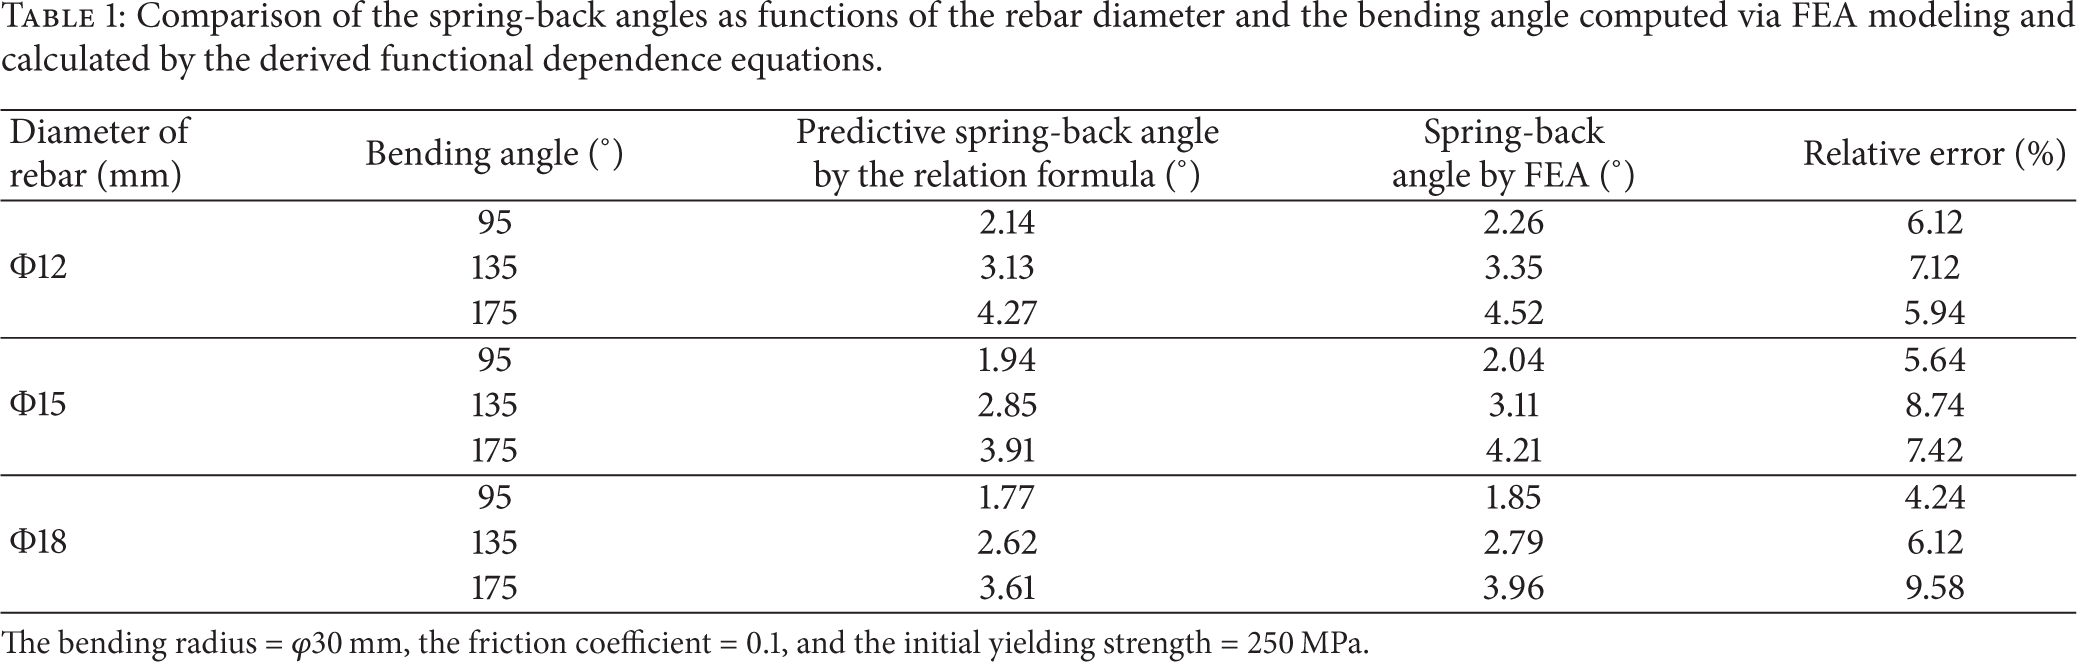
The bending radius = φ30 mm, the friction coefficient = 0.1, and the initial yielding strength = 250 MPa.
Comparison of the spring-back angles as a function of the bending radius and the bending angle computed via FEA modeling and calculated by the derived functional dependence equations.
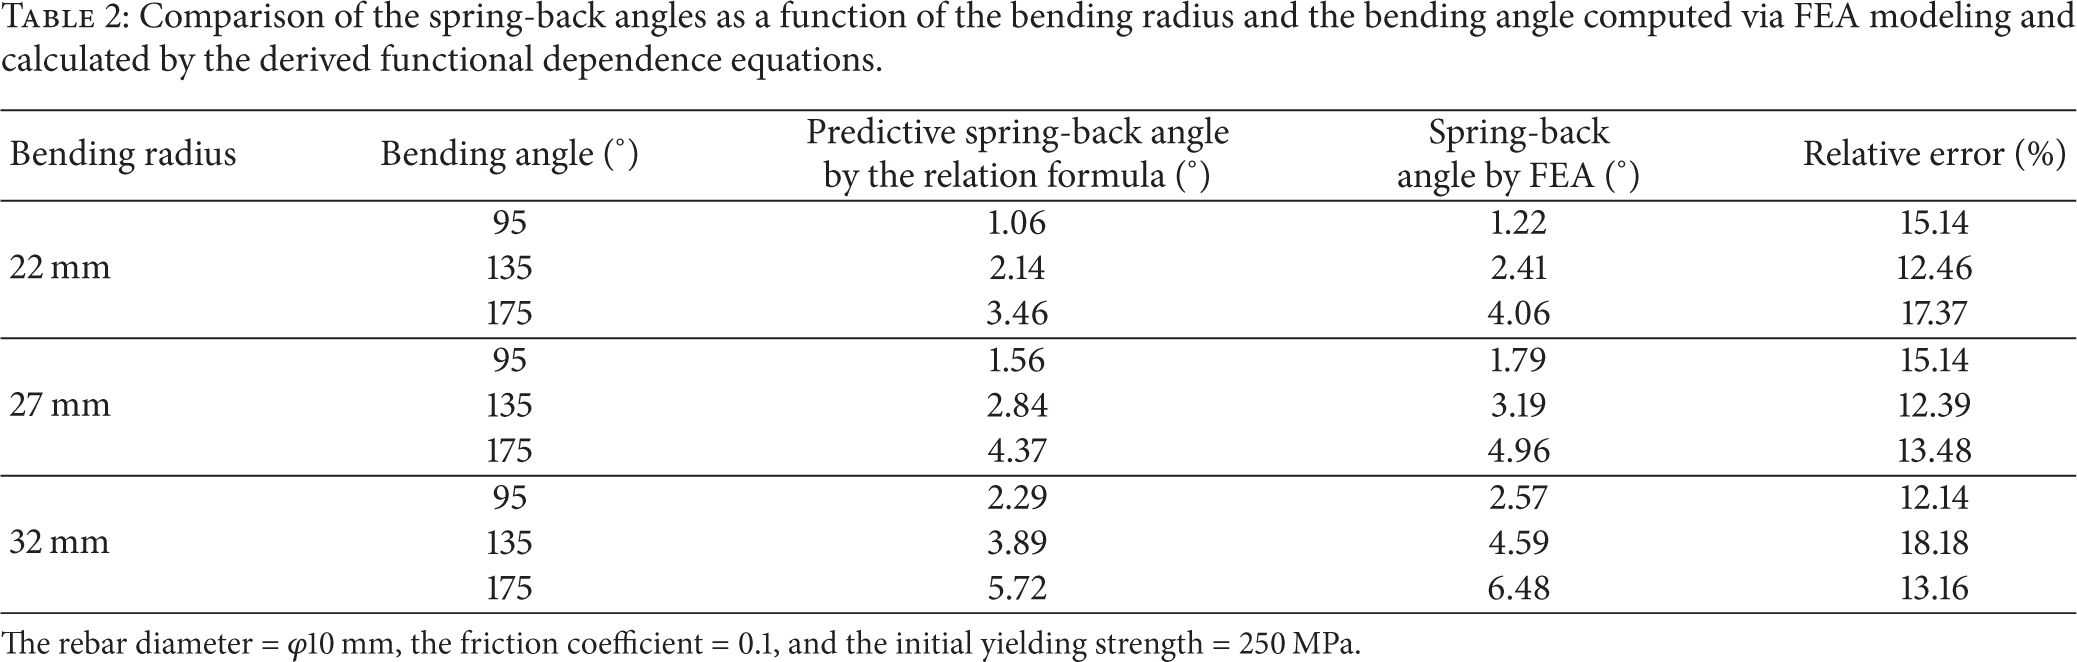
The rebar diameter = φ10 mm, the friction coefficient = 0.1, and the initial yielding strength = 250 MPa.
Comparison of the spring-back angles as a function of the friction coefficient and the bending angle computed via FEA modeling and calculated by the derived functional dependence equations.
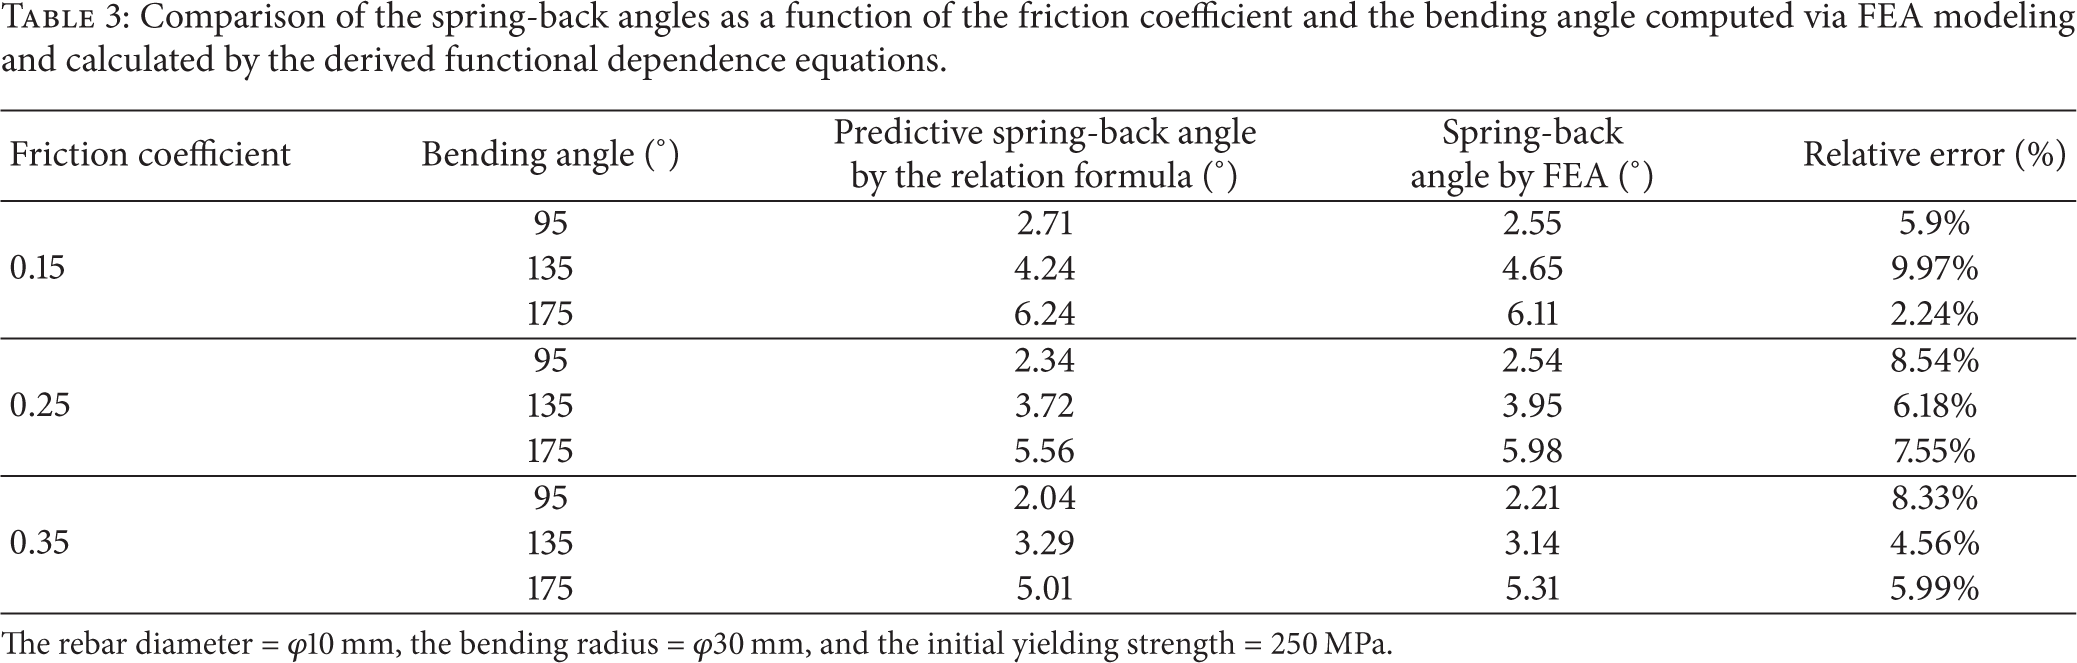
The rebar diameter = φ10 mm, the bending radius = φ30 mm, and the initial yielding strength = 250 MPa.
Comparison of the spring-back angles as a function of the initial yielding strength and the bending angle computed via FEA modeling and calculated by the derived functional dependence equations.

The rebar diameter = φ10 mm, the bending radius = φ30 mm, and the friction coefficient = 0.1.
3. Conclusion
In this paper, the functional dependences of the spring-back ratio are derived based on the data acquired via finite element analysis. These formulas can be used to enhance computational controls for the automated rebar plant bending machines. It was demonstrated that a greater rebar diameter, a greater bending radius, and a greater friction coefficient would minimize the spring back, while a greater bending angle and initial yielding strength result in a greater spring back.
The spring-back angle depends nonlinearly on the bending angle, the bending radius, the rebar diameter, the friction coefficient, and the initial yielding strength. Among several functional dependences considered, spanning from the first- to the fourth-order relationships, comparing results generated by FEA modeling and by the derived equations, we have established that the fourth-order equations provide the most accurate results. The derived formula for the spring-back ratio as a function of the bending angle and the rebar diameter has an average relative error of ~4%; the equation describing dependence of the spring-back ratio on the bending angle and the bending radius has an average relative error of ~12.71%. The equation describing dependence of the spring-back ratio on the bending angle and the friction coefficient has an average relative error of ~3.8%, and the derived formula for the spring-back ratio as a function of the bending angle and the initial yielding strength has an average relative error of ~3.6%.
In order to validate the formulas, the FEA modeling was performed with a new set of parameters (those not used for the equations’ derivation) and comparison between the spring-back ratios predicted by the equations with the FEA data allowed establishing the relative errors of the predictive functional relationships. The average relative errors were ~6.77% for the spring-back ratio as a function of the bending angle and the rebar diameter, and the average relative errors were ~14.38% for the spring-back ratio as a function of the bending angle and bending radius; the average relative errors were ~6.55% for the spring-back ratio as a function of the bending angle and the friction coefficient and ~7.94% for the corresponding functional dependence on the bending angle and the initial yielding strength.
Conflict of Interests
The authors declare that there is no conflict of interests regarding the publication of this paper.
Footnotes
Acknowledgment
This research was supported by a Grant (12 Advanced Urban C.21 no. 214C000026) from Advanced Urban Development Program funded by Korea Agency for Infrastructure Technology Advancement.