
Abstract
As mobile devices came into wide use, it became practical to collect travel data in personal logs. Many studies have been conducted to extract meaningful information from this trend. In this study, we present a system for monitoring road-geometry and crash-risk estimation, based on trajectories created using a smartphone-aided sensor network. The proposed system consists of a number of node vehicles with smartphone applications for GPS data collection and a map server which aggregates the collected GPS trajectories and estimates road conditions. In order to estimate road geometry and crash risk information, the trajectories were segmented and categorized into groups according to their headings. Based on the processed trajectories, the geometry of the road section was estimated using the principal curve method. The crash risk of the road section was estimated from the constructed road geometry and the density map of the trajectories. Our system was evaluated using bicycle trajectories collected from segregated bicycle tracks in Seoul, Korea. Constructed geometry and crash-risk information of the track was compared with real track geometry and crash data. As a result, the estimated road geometry showed over 74% similarity and the calculated crash risk (61%) matched the real crash data.
1. Introduction
As the technology of handheld devices and satellite based tracking systems has improved, creation of daily travel logs has become practical and popular. A travel log of a vehicle or person could become a source of meaningful information that might include kinematics (i.e., speed, acceleration, and heading) and semantic information (i.e., region of interest, purpose of trip, user behavior, and traffic environment).
A number of studies have been performed to extract and analyze information based on the trajectories of vehicles or persons [1–8]. One of the most popular issues with trajectory-based analysis is estimation of road geometry based on a large number of vehicle trajectories [1–4]. The trajectory of vehicles has also been used to analyze vehicle accidents and the behavior of drivers. Based on GPS-sensor data collected in real-time, crash-risk factors including roadway characteristics, environmental factors, and driver or bicyclist behavior were revealed [9–13].
In this study, we propose a system which estimates road geometry and crash risk using vehicles that perform the role of sensor nodes and which collects data about their movements using smartphones. The road geometry was estimated by applying the principal curve method to the vehicle trajectories. We expected that the factors affecting the crash risk would be estimated by analyzing aggregated, real-time trajectory data. We calculated the crash risk of a road section based on the distance traveled and shape of the road geometry and with a density map constructed with the trajectories. Compared to previous approaches, the proposed system can more easily cope with environmental or geometric changes of the roadway without additional information from maps or field investigation. This system can also support low-cost, periodic crash-risk analysis.
The components and procedures of the proposed system will be shown in Section 2 and its experimental results in Section 3. We present our conclusions in Section 4.
2. System Structure
The proposed system consists of a node vehicle and a map server. The node vehicle contains a smartphone application (SPA) designed to collect travel path using a GPS sensor and to communicate with the map server. This SPA also provides road-geometry and crash-risk information to a user.
The map server constructs and updates the road-geometry and crash-risk information using received sensor data and then distributes the updated road information to the node vehicles. Figure 1 shows how the proposed system operates. The SPA collects the position data of the node vehicle and sends the data to the map server via the Internet. Based on the data sent from the SPAs, the map server estimates the road-geometry and crash-risk information about a specific road section.

Operating procedure and structure of the proposed system.
2.1. Node Vehicle
There were two types of node vehicles: motor vehicles and nonmotorized vehicles. Because the behavioral characteristics (i.e., changes in heading, acceleration, deceleration, and stop rate) of nonmotorized vehicles are much different from those of motor vehicles, the node-vehicle type is an important factor for the estimation of node-vehicle state and crash-risk information [8].
Using the GPS receiver in the smartphones, the node vehicle collects data on the travel path and determines its own moving state.
Communication between the SPA and the map server was established using TCP/IP. The SPA sent collected position data to the map server every 60 sec or when an abnormal state was detected. The driving state was determined based on the sequential positions of the node vehicle.
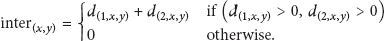
If sudden direction or speed changes occur, the SPA checks its current position and compares the changes with the road geometry. The accelerometers in the smartphones were also utilized to detect abnormal states. Figure 2 shows an example of an abnormal state. The adjusted headings (

Example of node vehicle in abnormal state.
The graphic user interface (GUI) of the SPA shows the current position and travel trajectories on map images provided by Google Maps. The crash-risk information of the current bicycle position was shown on the top of the GUI with color and text. The application beeps when the crash-risk information is changed.
2.2. Map Server
The map server estimates the geometry and crash-risk information of the road section based on the GPS-sensor data collected from the node vehicles. Figure 3 shows the updating procedure of the map server.

Updating procedure of map server.
Once the map server receives sensor data from the node vehicles, the server checks whether the sensor data belongs to the current road segment. If not, new road segments are constructed for the received sensor data. Based on the GPS-sensor data, the bidirectional road geometries and density map are constructed or updated, and, finally, the geometry and crash-risk information is recalculated for the road segment. The map server sends updated information to the node vehicles when they move onto different road sections or when its corresponding road segment is changed.
2.2.1. Road Geometry
As shown in Figure 2, each piece of GPS-sensor data collected by a node vehicle has its own direction at every point. Collected GPS data about a certain road section are categorized into two groups according to headings and then utilized to construct the road geometry.
The road geometry was constructed utilizing the latitude and longitude from the GPS data, with the principal curve method. The principal curve is a “self-consistent” smooth curve which shows a nonlinear summary of a set of given data points [14]. It has been applied to various fields of research including road geometry estimation [2, 3]. “Self-consistent” means that any point on the principal curve coincides with the average of the data points which were projected to that curve, and, therefore, that the curve passes through the middle of the data cloud. Let

A smooth curve
In this way, two road geometries (in opposite directions) were constructed. Some GPS units fail to provide elevation data, so only latitude and longitude information was used to construct the road geometry. To enhance the present 2-D trajectories into 3-D ones, we needed the elevation of each geometric point. The elevation information for each position was attached by utilizing the DEM (digital elevation model) database.
2.2.2. Road Segmentation
The road geometry constructed with the collected GPS-sensor data was divided into a number of segments based on the length and geometric homogeneity of the segment. Namely, the road geometry was sequentially analyzed and divided into segments at geometric points where a sudden change in elevation or curvature occurred. The length of each segment was limited to 3 km, and if the length was shorter than 0.02 km, the segment was merged with a neighboring one with the most similar properties.
The GPS sensor data transferred from the node vehicles were assigned to a road segment according to position and heading and then utilized to update actions involving that segment. Heading was used to separate a crossroad into two different road segments.
2.2.3. Density Map
Vehicle density is closely related to the crash risk of a road section. Generally, a road section with high vehicle density is expected to have traffic congestion and higher crash risk than that with low density. For this reason, density maps based on collected sample data have been utilized to estimate the real density [15, 16]. Density maps have also been used to analyze and visualize the density of motor vehicles, airplanes, and vessels [17, 18]. The proposed system constructs two density maps for each road segment based on the GPS data groups, which were divided according to their headings.
The width and height of the density map were decided by examining the maximum and minimum coordinates among the trajectory points:

Here, g, t, and i are the indices of the GPS data group, road segment, and trajectory point, respectively; w and h are the width and height of the density map;
2.2.4. Crash-Risk Information
The crash risk of each road segment was determined using the estimated road geometry and density map.
First, we expected that node vehicles moving in one direction would influence those moving in the opposite direction. We assumed that this influence could be calculated by comparing two road geometries of a road segment constructed with grouped GPS-sensor data. In order to compare the road geometries, the differences between them, in distance and shape, were calculated using the Fréchet distance. The Fréchet distance was introduced by Alt and Godau [19] to measure the resemblance between curves and has been utilized in various fields to measure the similarity of objects [20]. The Fréchet distance is defined as


Second, the density map was utilized to estimate the crash-risk information. In order to find the influences mentioned above, an intersection map was calculated which shows the intersected density between two density maps of a road segment. Consider
Here,
Using the Fréchet distance between two road segments and the intersection map, the crash-risk information

3. Experiments
In order to evaluate the proposed system, we attempted to construct the geometry and crash-risk information of the road sections and compare them with real road geometry and crash data.
For the experiments, a nonmotorized node vehicle was selected. We expected that crash-risk estimation in this study (i.e., comparing road geometries and density maps between node vehicles moving in opposite directions) would be more suited to the behavioral characteristics of nonmotorized vehicles, particularly for bicycles. Therefore, for the first evaluation of our system, bicycles were used as the nodes.
Figure 4 shows an example of a node bicycle with the SPA. A smartphone is attached to the top of the handlebar to provide visual information to users during their rides.
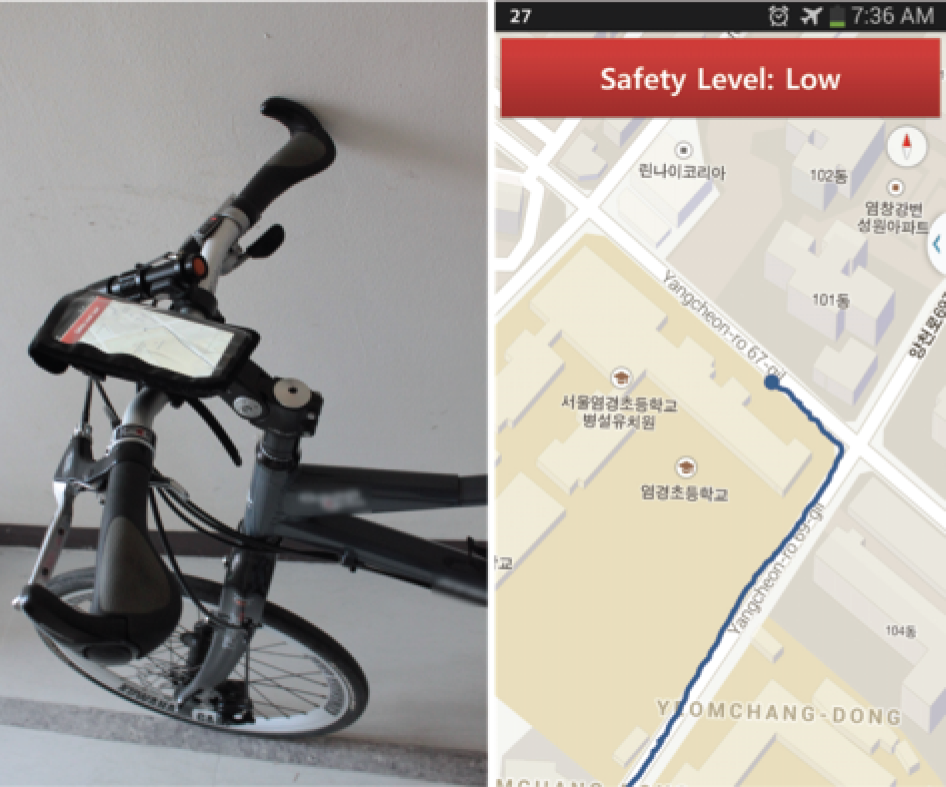
Node bicycle and the snapshot of the application.
3.1. Data Collection
For collection of sensor data, a 20.43 km bicycle path was selected in Seoul, Korea. It is a two-way bicycle route which traverses the center of Seoul City, from east to west, along the Han River. The path is also connected to roads leading to business centers in both northern and southern areas of the city. This bicycle path is the major one for bicycle commuters in Seoul because of its easy accessibility and separation from motor vehicles. The yearly number of bicyclists and pedestrians using the path has steadily increased from 7.2 million in 2009 to 10.2 million in 2010 [21]. Another advantage of this route is that there are no nearby long buildings that could interfere with the GPS signals; thus we expected less error in our GPS data.
From the bicycle path mentioned above, only a 20.43 km section was selected (for collecting sensor data) because it has relatively higher bicycle traffic than other parts. Our track section has six bicycle entrances, 15 junctions, and only one signalized intersection with motor vehicle traffics. Detours along the path were not included in the data collection. Korean government statistics show that the reported number of bicycle-related crashes on our track section was 89 from 2009 to 2012. In Figure 5, the bold line just south of the river shows the selected track section. The locations (i.e., latitude and longitude) of the east and west ends of the study section were 37.554785, 126.874924, 37.53396, and 127.030449, respectively.
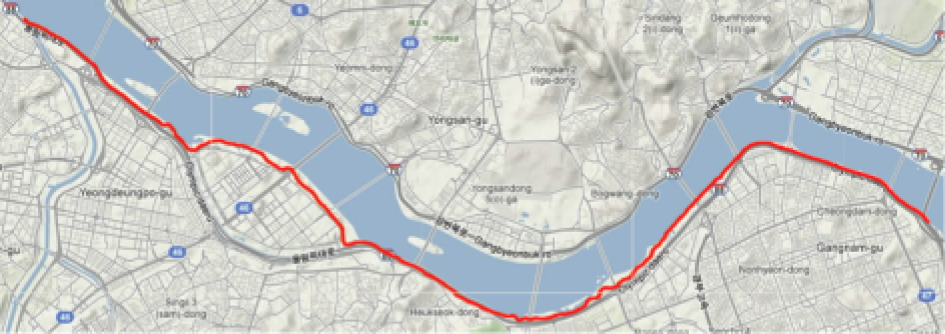
Bicycle path section for data collection.
The GPS-sensor data for the experiments were collected by Korean bicyclist groups. The sensor data was collected for six months (May to October, 2012), with the aforementioned smartphone application (SPA).
For each one-way trip made by an individual bicyclist, a set of GPS-sensor data was generated. Hence if a round trip was made, two sets of sensor data were generated. The collected GPS-sensor data were preprocessed before being sent to the map server, to exclude possibly erroneous data. During the preprocessing, GPS data showing speeds above 70 km/h were deleted. The remaining data showed a concentrative distribution along the track section.
3.2. Experimental Results
During the experiments, a total of 732 travel logs were recorded and 2% of them were discarded because of erroneous signals. The remaining 717 trajectories were divided into 190 road segments, with an average length of 0.10 km.
3.2.1. Road-Geometry Results
The latitudes and longitudes of estimated road-geometry points were compared with the points and lines between points of the real road geometry. If the shortest distance between an estimated and real point (or line) exceeded the threshold, the estimated point was considered dissimilar. The result was that 74% of the estimated points showed geometrical similarity with the real road geometry.
Figure 6 shows two examples of estimated road geometries. The blue line indicates the road geometry in the direction from down to up, and the red one represents the reverse. The road segments (a) and (b) share similar track geometry; however, their geometry similarities were different. This difference was mainly caused by environmental differences. Unlike (a), (b) had several nearby convenience facilities (circled areas in Figure 6(b): a convenience store, a public toilet, and benches with shades) which attract bicyclists and pedestrians. This example confirms that estimated road geometry may be different from the real one. However, the estimated geometry can reflect real traffic information and thus could be more useful for the crash-risk analysis.

Examples of estimated road geometries.
3.2.2. Crash-Risk Results
Table 1 summarizes the average, minimum, maximum, and standard deviation of calculated Fréchet distance and of the intersection map with the number of crashes of the road segments.
Summary of estimated features.

The standard deviation of the number of crashes is relatively higher than the Fréchet distance and intersection map. This may be caused by excessive zero data, a condition frequently observed in crash data. The histograms of the Fréchet distance and intersection map are shown in Figure 7. Both histograms have similar, normal-distribution shapes.

Histogram of feature values.
The crash numbers of the road segment were used as the degree of the real crash risk and compared with the estimated crash risk of that segment. Both values were normalized from zero to one. As a result, 61% of the crash risk of the road segments was matched with the corresponding crash numbers in the range of −0.2 to +0.2. Namely, the estimated crash risks have a 61% accuracy rate with a ±20% margin of errors.
Figure 8 shows the estimated crash risk with the crash numbers for each segment. We assumed that mismatched track segments were caused by

Estimated crash risk with number of crashes.
4. Conclusion
In this study, we proposed a system for road-geometry and crash-risk estimation based on GPS trajectories collected with smartphone-aided sensor networks. The proposed system consists of node vehicles which collect position data with GPS sensors and a map server which manages and updates the road geometry and crash risk. We tested our system with node bicycles on a segregated bicycle path and found the proposed system useful.
For future work, motor vehicles and nonmotorized vehicles will be utilized together for analysis of travel in a mixed-traffic environment.
Footnotes
Conflict of Interests
The authors declare that there is no conflict of interests regarding the publication of this paper.
Acknowledgment
Professor Ilmin Kim was financially supported by Hansung University.