
Abstract
Burr grinding, tungsten inert gas (TIG) dressing, ultrasonic impact treatment, and peening are used to improve fatigue life in steel structures. These methods improve the fatigue life of weld joints by hardening the weld toe, improving the bead shape, or causing compressive residual stress. This study proposes a new postweld treatment method improving the weld bead shape and metal structure at the welding zone using friction stir processing (FSP) to enhance fatigue life. For that, a pin-shaped tool and processing condition employing FSP has been established through experiment. Experimental results revealed that fatigue life improves by around 42% compared to as-welded fatigue specimens by reducing the stress concentration at the weld toe and generating a metal structure finer than that of flux-cored arc welding (FCAW). Hot-spot stress, structural stress, and simplified calculation methods cannot predict the accurate stress at the weld toe in case the weld toe has a smooth curvature as in the case of the FSP specimen. On the contrary, a finite element calculation could reasonably predict the stress concentration factor for the FSP specimen because it considers not only the bead profile but also the weld toe profile.
1. Introduction
It is a well-known fact that welded joints have a low fatigue life compared to the base material. Fatigue life at weld joints in steel structures is affected by factors such as welding residual stress or stress concentration at the discontinuous portion on which base metals and deposited metals are joined by softening materials at heat-affected zones (HAZ). Stress concentration is more prominent at weld joints due to their geometry rather than weld imperfections such as slag inclusions or undercutting [1, 2]. Material softening at HAZ occurs due to changes in the metal structure via quick heating and cooling processes [3]. In addition, thermal stress induces a compressive plastic strain due to uneven temperature distribution caused by movements of the welding heat source. This compressive plastic strain generates tensile residual stress after cooling [4–6].
Improving the fatigue life of welded joints by application of different postweld treatments has received much attention lately, as methods for improving fatigue life in steel structures are being used such as burr grinding, TIG treatment, ultrasonic impact treatment, and peening. The purpose of burr grinding [7, 8] is to remove minor weld defects in the weld toe by machining while reducing the stress concentration factor of the weld toe. The use of a burr grinder instead of a disc grinder leaves the grinding marks parallel to the direction of loading, which prevents them from acting as crack initiation sites. The method showed significant improvements in fatigue life from a two-stage burr grinding procedure, using first a rough tungsten carbide burr followed by a second run with a finer grinder [9]. The objective of TIG dressing [10] is to remove welding imperfections such as undercuts, cold laps, and inclusions by remelting the weld toe, thereby leaving the weld practically defect-free. Moreover, the treatment significantly reduces the stress concentration factor of the weld toe by introducing a smooth transition. TIG dressing was carried out according to IIW recommendations [11]. Prior to TIG dressing, the weld seam and adjacent plate are thoroughly cleaned by sandblasting. Ultrasonic impact peening [12] is a recently developed technique which applies compressive residual stresses to weldments [13]. In this process a 4–7 mm wide zone at the weld toe is treated with an ultrasonic hammer. The equipment consists of a magnetostriction transducer, an ultrasonic wave transmitter, and a peening tool. Peening [14] is a cold working technique which replaces the tensile residual stresses produced by the welding process at the weld region with favorable compressive residual stresses, which effectively introduce a substantial initiation period in the fatigue life of the welded components [15, 16].
In this study, a new postweld treatment method, friction stir processing (FSP) [17–19], is proposed to extend fatigue life by improving the weld bead shape and the metal structure at the weld zone. For that, first of all, an adequate pin shape and process conditions for FSP were developed through experimentation. Furthermore, the improvement of fatigue life was validated by conducting a fatigue experiment after FSP.
2. FSP Conditions
2.1. Overview of the Fatigue Life Improvement Method through FSP
Friction stir welding was developed by The Welding Institute (TWI) in England in 1991 [20] and has been widely used in aluminum alloys and thin plates with relatively low strengths. The principle of friction stir welding is that the pin of the rotating tool is inserted into the portion to be joined as shown in Figure 1. When friction heat is generated by the friction between the base metal and the rotating pin, the latter is advanced along the weld line to join the two base metals.
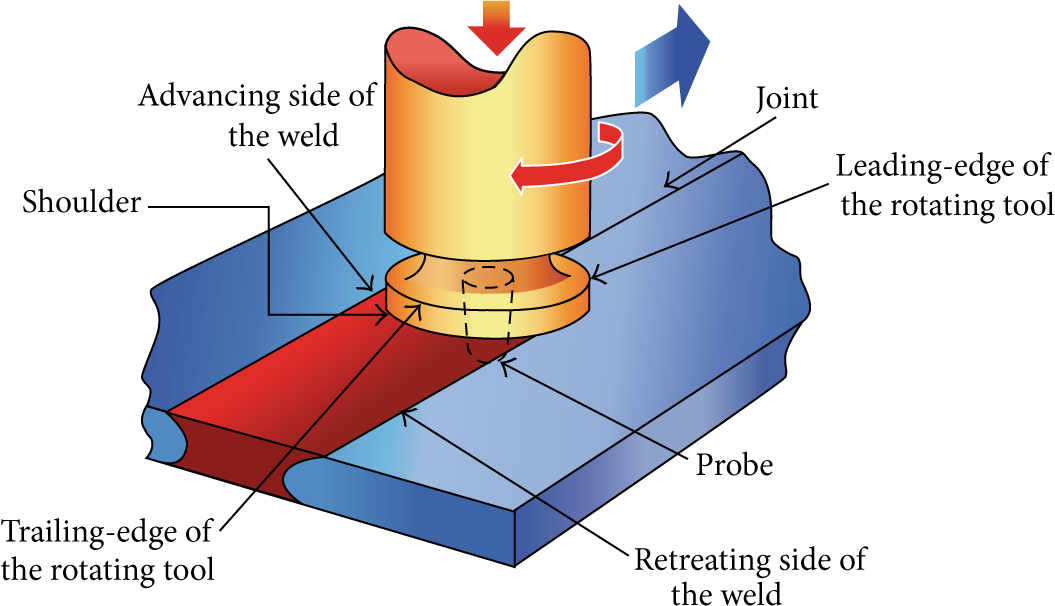
Schematic diagram of friction stir welding.
During this process, the softened base metal created by the inserted pin is stirred and pushed toward the rear portion of the inserted pin, thereby executing welding. This welding method improves the mechanical properties of the weld joint due to less welding deformation and residual stress since the amount of heat input decreases by around 60% compared with general welding methods. Also, the weld joint is not melted, which leaves a fine extrusion structure. Therefore, the metal structure is very sound after the welding process. Fatigue life is improved by reducing the stress concentration on the weld joint, softening the weld toe shape, improving the metal structure of the weld zone, and adequately changing the pin shape and treatment conditions of friction stir welding as shown in Figure 2.

Image of friction stir processing.
2.2. Process Conditions of FSP
The specimens used in the experiment were EH47 (YP 460 MPa) steel grade for a shipbuilding thickness of 25 mm. The chemical composition and material properties of the specimens are outlined in Table 1. For the optimum process conditions, an experiment was conducted where travel speed, spindle speed, and tilted angle of a tool were manipulated as can be seen in Table 2. The pin shape was modified with a shoulder diameter of 6–12 mm, a shoulder angle of 1°–5°, a pin diameter of 2–4 mm, and a pin length of 1.5–2 mm as shown in Figure 3.
Chemical compositions and mechanical properties of specimen.

FSW conditions.


Tool shape of friction stir welding.
Figure 4 shows the surface of specimens processed by FSP in which pin shape, travel speed, and spindle speed of the tool are manipulated as shown in Table 3. Based on the welded bead shape (Figure 4), the process conditions for FSP were determined, with the travel speed of the tool set to 60 mm/min and the spindle speed of the tool set to 500 rpm.
Tool conditions.

Bead shape along spindle speed and travel speed; (a) 60 mm/min, (b) 180 mm/min, and (c) 300 mm/min.
Figure 5 shows the macro-cross-section and microstructure of the specimens prepared by applying the selected process conditions. From these microstructures, it is clear that the metal structure treated by FSP became finer compared with the base metal.

Macro- and microstructure (60 mm/min, 500 rpm).
2.3. Metal Structure and Hardness Distribution
Figure 6 shows the macro-cross-section of a friction modified zone with a tool speed of 60 mm/min and a spindle speed of 500 rpm. Figure 7 shows the magnified microstructure of the base metal and the FSP and FCAW zones. When the above three microstructures were compared, the ferrite and pearlite structures through the FSP were finer than those of the existing welding process (FCAW). Therefore, toughness and strength can be improved by FSP but it is difficult to improve the fatigue life of finer microstructures.
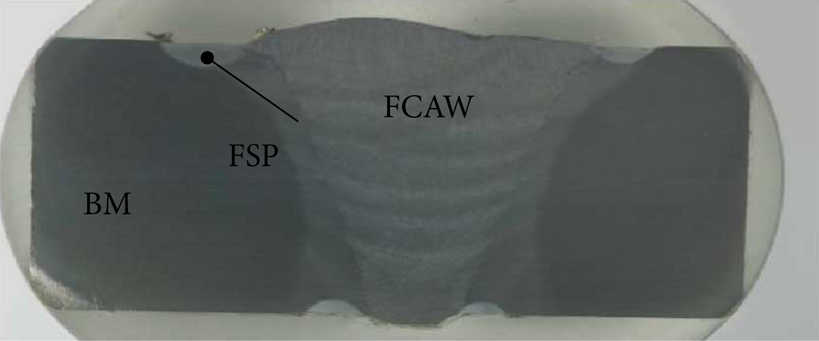
Macro-cross-section of a friction modified zone.
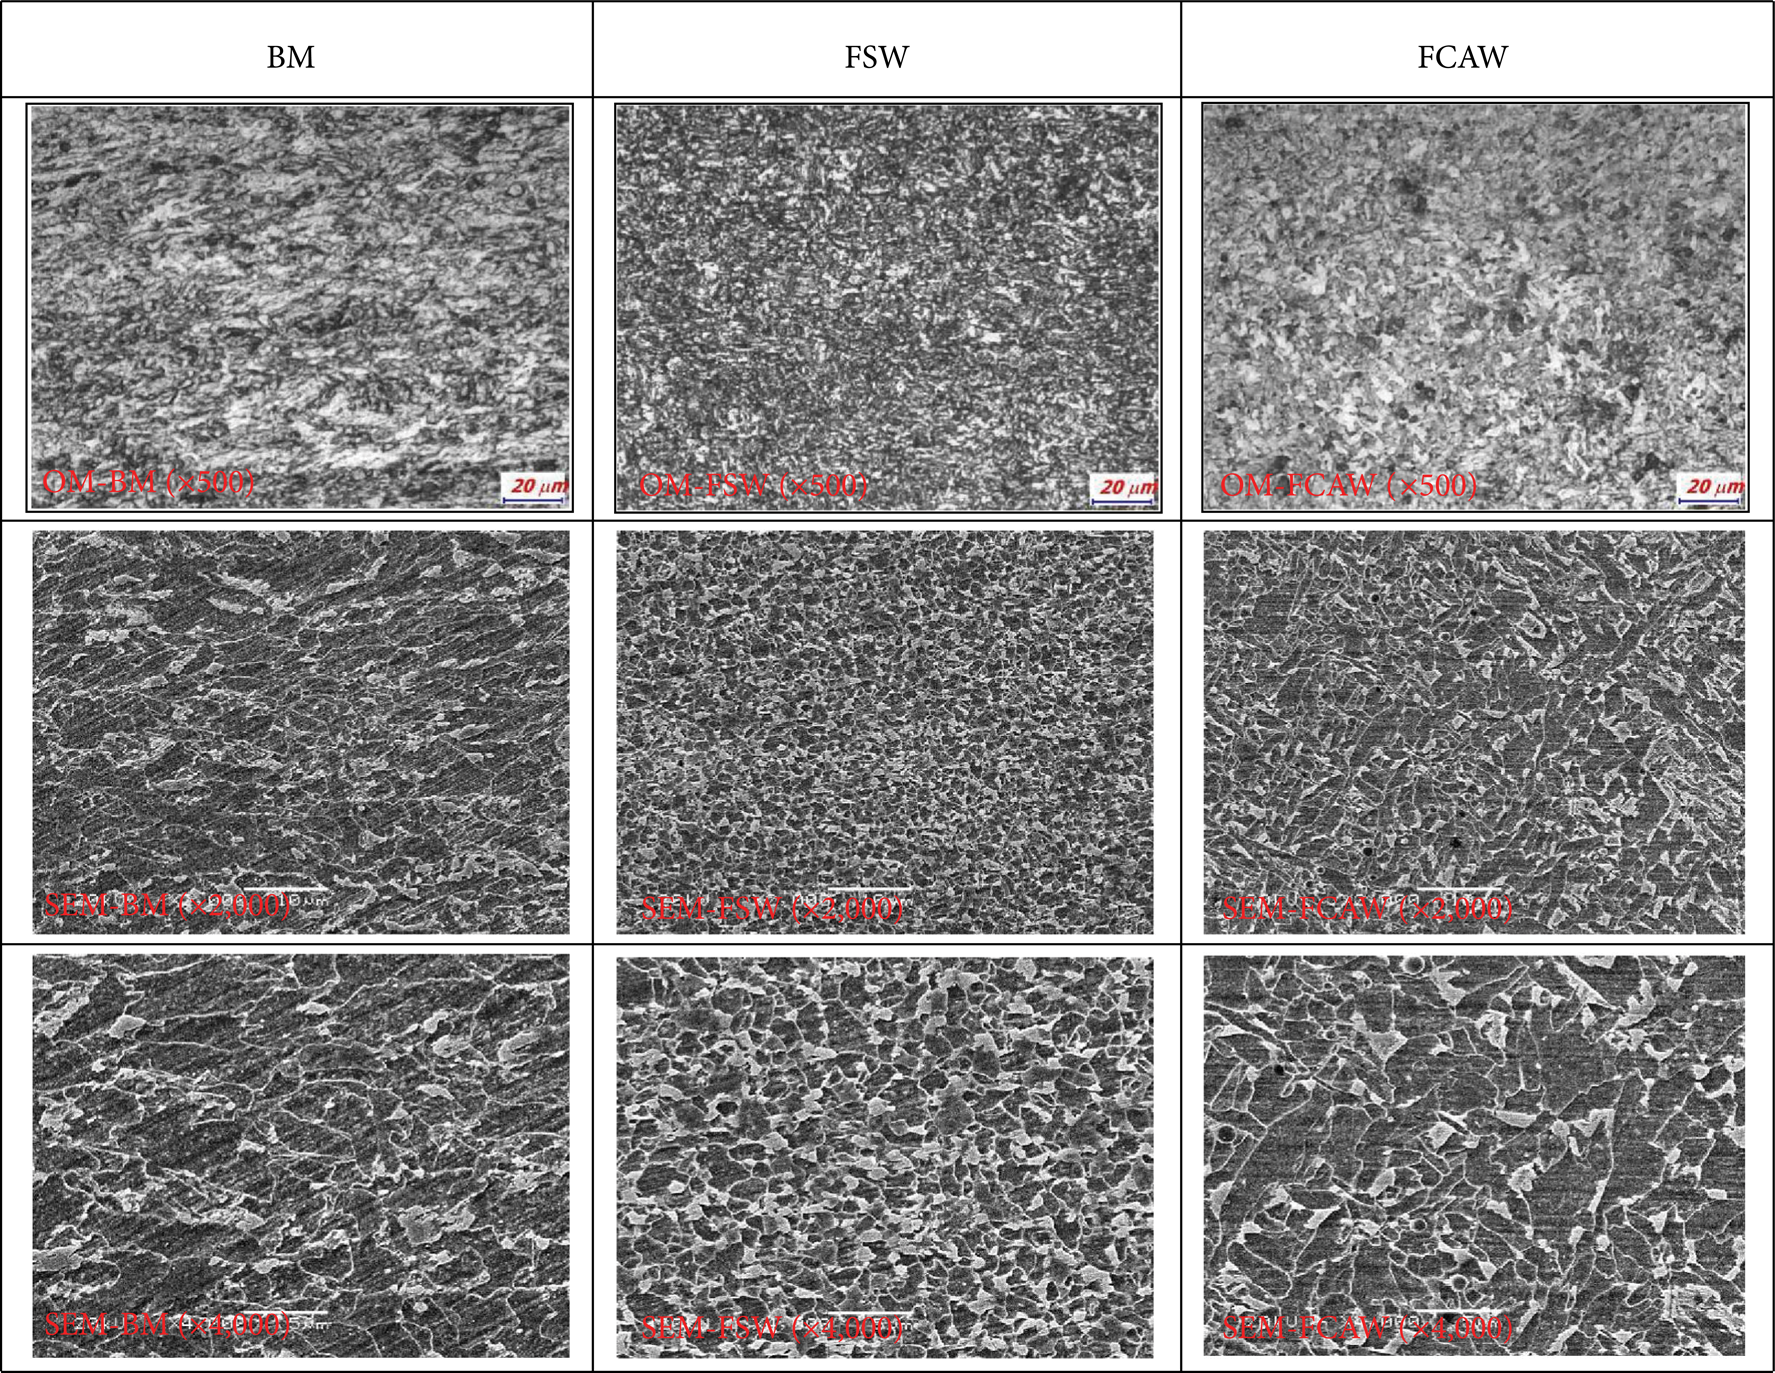
Microstructures of BM, FSW, and FCAW.
Figure 8 shows the hardness distributions at a depth of 1.73 mm in the base metal, the FCAW, and FSP zones. The hardness of the base metal is in the range of 200–210 Hv. The hardness of the FSP zone is in the range of 230–300 Hv and the FCAW zone is in the range of 210–250 Hv. The higher hardness by the FSP might be attributed to the micrograin size of the weld joint due to plastic flow.
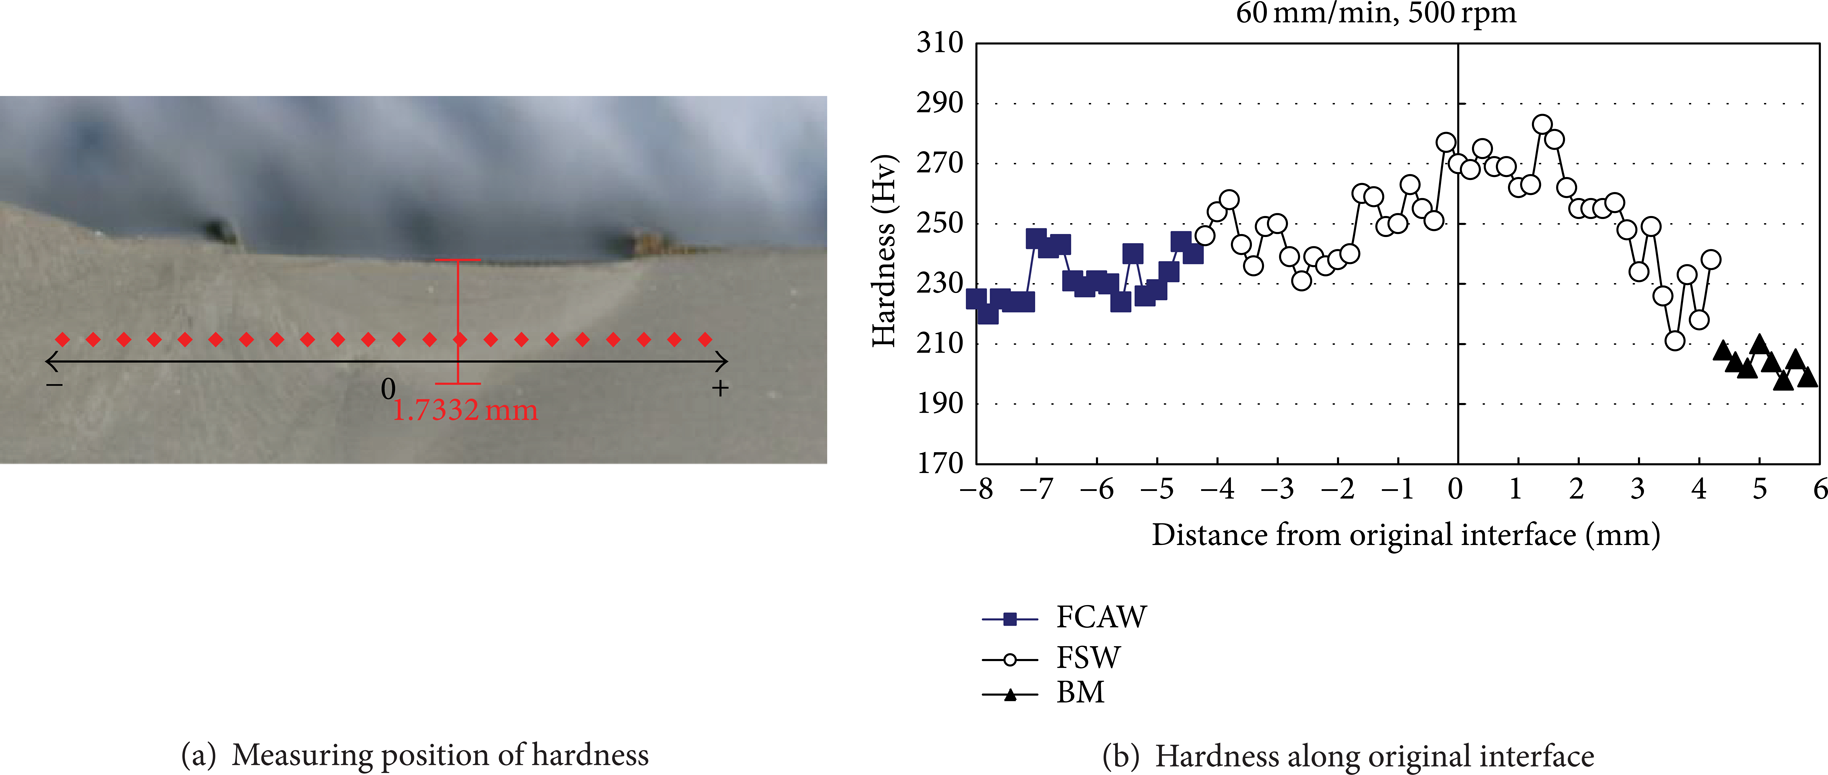
Distribution of hardness in near FSW area.
3. Fatigue Experiments
The specimen was 25 mm in thickness, 100 mm in width at the center, and 430 mm in total length as can be seen in Figure 9. The fatigue experiment was performed for both the specimens of the as-weld and the FSP. All fatigue test specimens were made by ASTM: E466-07 and the fatigue test was carried out by JSME: S002 [21].
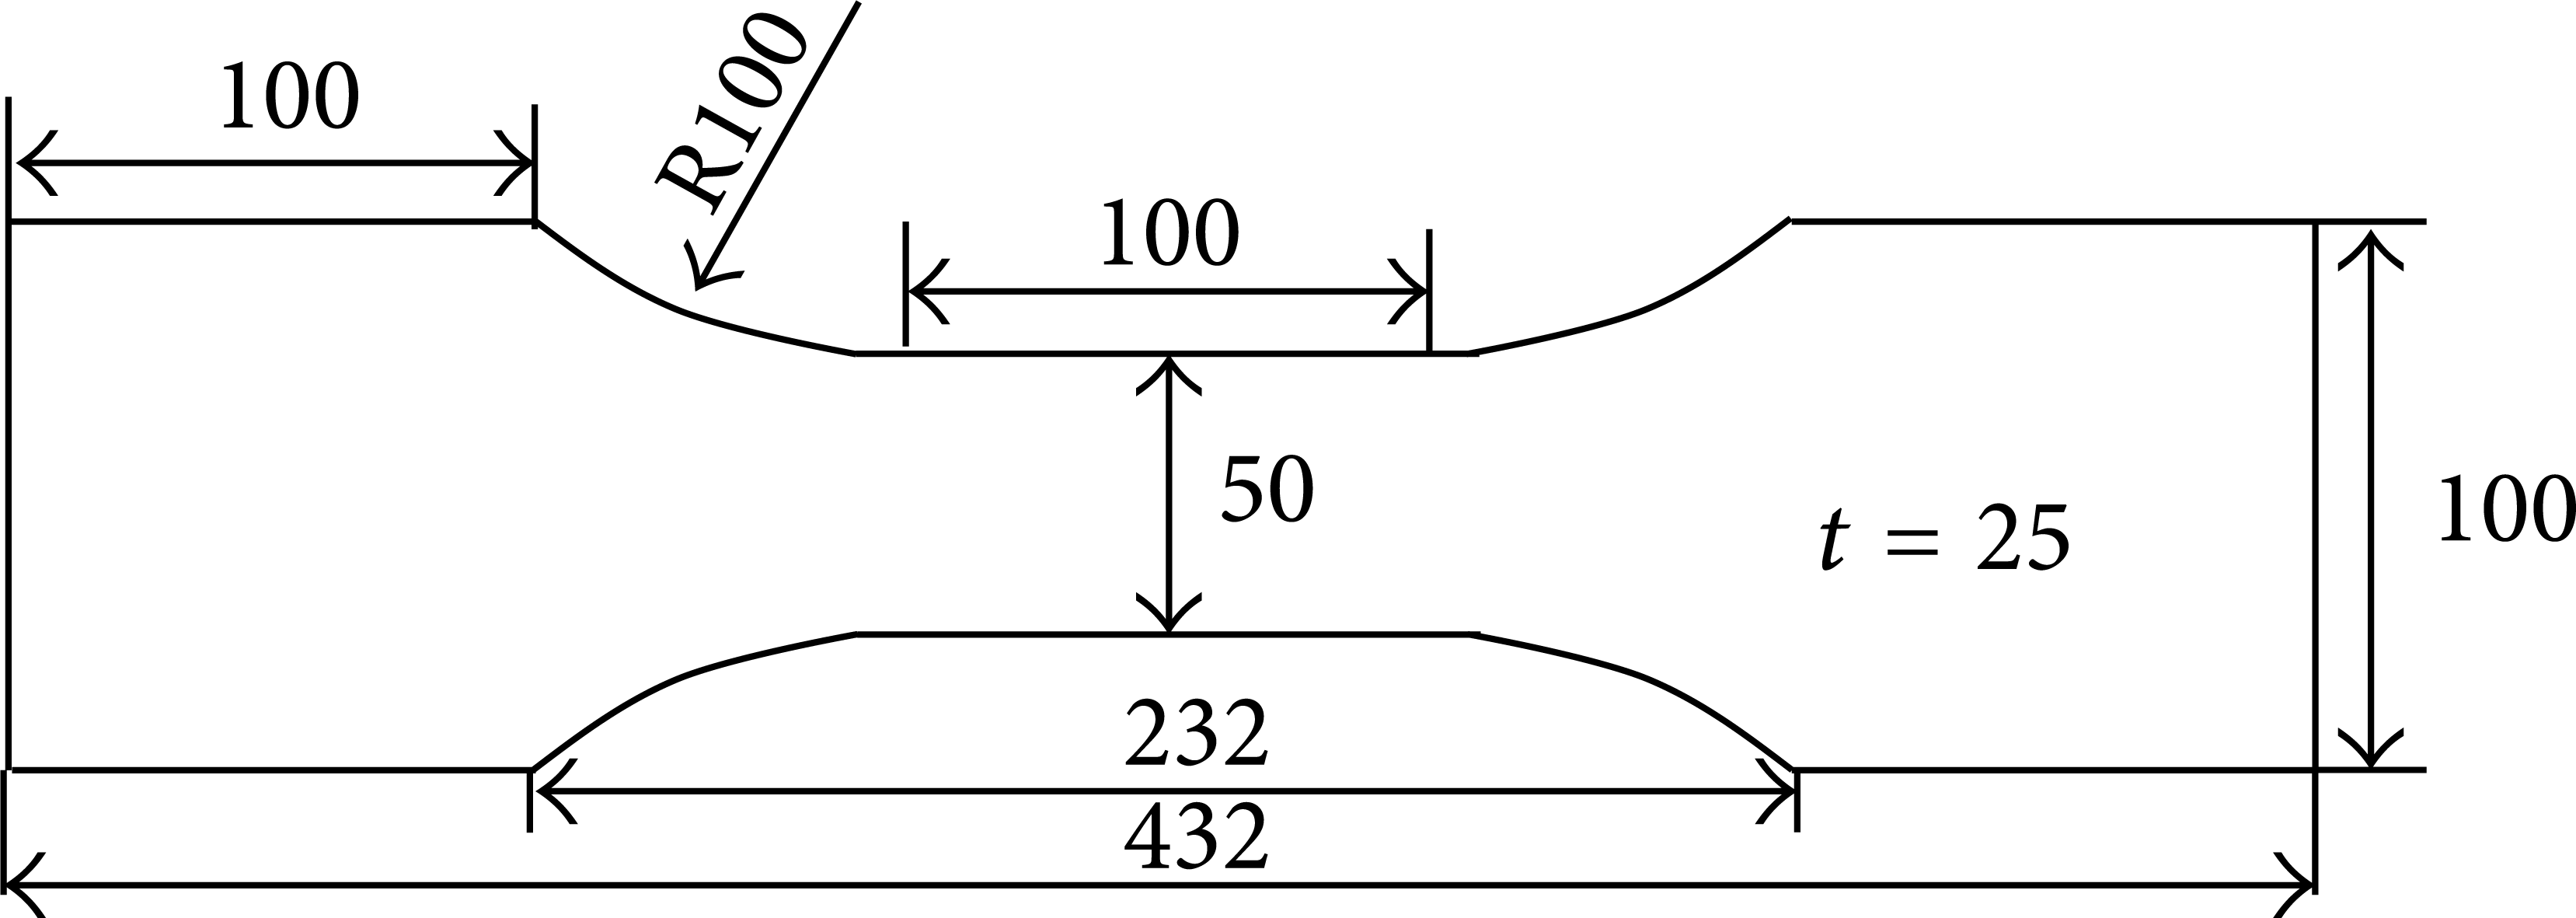
Shape and dimension of fatigue test specimen.
The specimen for FSP fatigue was prepared with a tool shape of Type A, a travel speed of 60 mm/min, and a spindle speed of the tool at 500RPM on the basis of metal structure and hardness. The fatigue load condition was set at three levels (240, 260, and 280 MPa).
The fatigue testing machine used in this study had a maximum capacity of ±50 tons for axis tensile/compression driven by the hydraulic servo. The experiment was conducted using a load control mode. The waveform of the fatigue load was set as a sine wave with a frequency of 4–6 Hz, depending on the load condition. The stress ratio (R) was kept at R = 0.1. Figure 10 shows an image for the fatigue experiment.
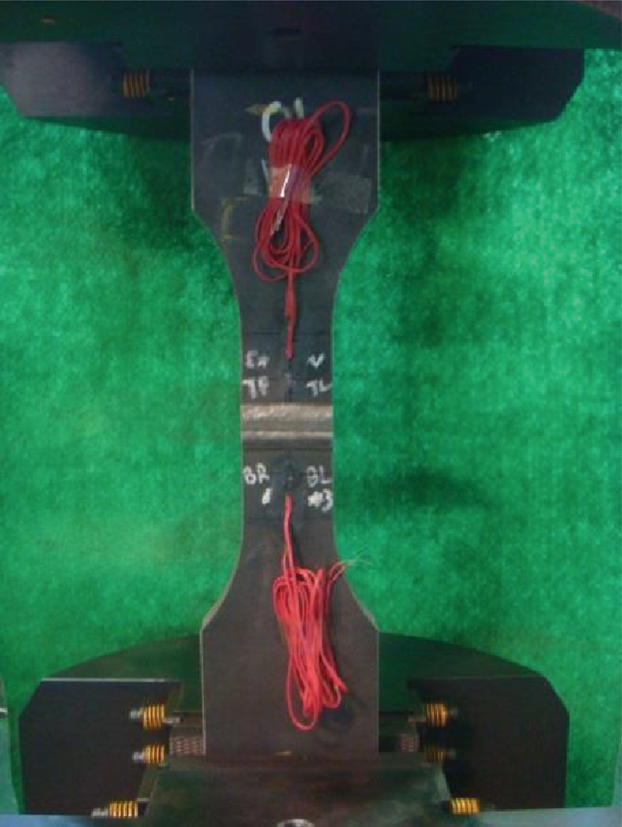
Photograph of fatigue test.
4. Results and Discussions
4.1. Fatigue Experiments
The fatigue tests were carried out to evaluate fatigue performance in weld joints which were made by FSP for the development of fatigue strength. The fracture surface of the fatigue specimen is shown in Figure 11 where a fatigue crack originates from the weld toe zone on the back face of the weld. The fatigue crack started from the root weld toe in specimen 280-1 because the stress concentration factor was bigger in the root toe compared with the face toe. However, fatigue crack initiation points appeared randomly in the test specimens.

Photograph of fatigue fracture mode and surface (number 280-1).
Table 4 shows the fatigue test results in the specimens prepared by FSP, as-weld, and base metal. The starting points of fatigue cracks appeared on the root side of seven of a total of nine specimens as can be seen in Table 4. Cracks were advanced through HAZ and finally resulted in breakage. Figure 12 shows the graph for the fatigue experiment results as an S-N curve. Here, items with the symbol “blue circle” display the fatigue experiment results in the specimens of the as-weld. Items with the symbol “red box” show the fatigue experiment results from the specimens improved by FSP. The experiment was carried out three times under three different stress levels. Generally, the S-N curve is prepared for fatigue experiment results with 14–16 observations. However, the fatigue experiment was performed at the stress level corresponding to the slope portion of the S-N curve, as this study aimed to evaluate the possible implementation of FSP technology on improving fatigue performance. From the fatigue experiment results, a reduction in the stress concentration by improving the weld bead shape by FSP proved to increase fatigue performance. Fatigue life was also improved by around 42% under the design load (280 MPa) of the steel that was adopted in this study. Also, it is well known that fatigue strength increases with fine microstructure. Figure 7 shows the magnified microstructure of the base metal and the FSP and FCAW zones. The FSP microstructures are finer than those of the existing welding process (FCAW). Therefore, toughness and strength can be improved by FSP but it is difficult to distinguish each effect to improve fatigue performance in stress concentration effect and fine microstructure effect.
Results of fatigue test.


S-N curves of fatigue test results.
4.2. Evaluation of Stress Concentration Effects
4.2.1. Stress Concentration Effects between As-Weld and FSP
Finite element analysis was performed to evaluate the stress concentration factor with the as-welded and FSP specimens. The analysis tool used was the nonlinear common program MSC Marc.
Figure 13 shows the as-weld model, FSP model, and stress distributions used for the finite element analysis. A 1/2-size model was used during analysis to consider its symmetry. The element used for the analysis was a 2-D shell element with a thickness of 25 mm. The boundary condition was set with one side fixed. The load was imposed on the other side of the model to receive a tensile stress of 280 MPa. The stress concentration coefficient was then estimated from the stress at the weld toe. The mechanical properties used were a modulus of elasticity (E = 205.3 GPa) and Poisson's ratio (0.3).

Model and stress distribution with as-welded and FSP specimens.
From all the analysis models, it was clear that stress concentration occurred at the weld toe of the welding bead. The FE analysis results are shown in Table 5. In the as-weld model, the stress concentration factor which was at the toe zone in the upper face was 1.812, while it was 1.989 at the toe zone located at the back face. The larger stress concentration was thus found to be generated in the weld toe zone at the back face. In the FSP model, the stress concentration factor at the weld toe zone in the upper face of the specimen was 1.527 while at the weld toe zone in the back face it was 1.726. Therefore, the stress concentration with the FSP was reduced by 13.22–15.73% compared to that of the as-welded specimen. Generally, fatigue crack initiation is expected to occur at the weld toe where stress is concentrated to occur in the back face, even though stress concentration is reduced by the FSP. However, the fatigue life of the FSP specimen would improve more than in the as-welded specimen by reducing the stress concentration in FSP.
Results of FE analysis to evaluate stress concentration factors.

4.2.2. Effects of Stress Concentration by Hot-Spot Stress and Structural Stress
Hot-spot stress (HSS) and structural stress (SS) were assessed by conducting an experiment and comparing the obtained values to evaluate the stress at the weld toe where welding fatigue cracks propagate. To measure the stress at the weld toe, 2 mm strain gages having one axis were attached at a specified distance from the end of the weld toe as shown in Figure 14.

Strain gauge locations.
HSS was estimated by using an extrapolation of stresses at a point of specified distance from the weld toe because cracks occurred mainly at a discontinued part such as the weld toe. As methods to predict HSS, there were ① extrapolation of stresses at 0.4t and 1t (t: thickness) ② extrapolation of stresses at 0.5t and 1.5t, and ③ using a stress value at 0.5t from the weld toe. In this study, the HSS was assessed by using the second method that is (1) proposed by Niemi [22]
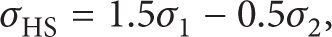
where σ1 is a stress at 0.5t and σ2 is a stress at 1.5t.
SS (σ s ) [23] is comprised of membrane stress (σ m ) and bending stress (σ b ). The maximum stress was obtained from the end of the weld toe as in Figure 15. The strain gage has to be attached to the upper and back faces of a plate to measure the stress at the weld toe in the SS method. However, it was not possible to attach the strain gage due to the upper bead profile, making it impossible to assess the SS on the back side of the plate. Therefore, SS was measured only at the upper side of the plate. This distribution of stress shows a simple decreasing trend along the thickness. The SS (σ s ) at the end of the weld toe (A-A) in Figure 15 was assessed after calculating the membrane stress (σ m ) and bending stress (σ b ) of Section B-B and Section C-C by using the measurement values from Sections B-B and C-C, on which strain gages were attached, and by using

where σTop B , σBot B , σTop C , and σBot C are the calculated stress values at Section B-B and Section C-C.
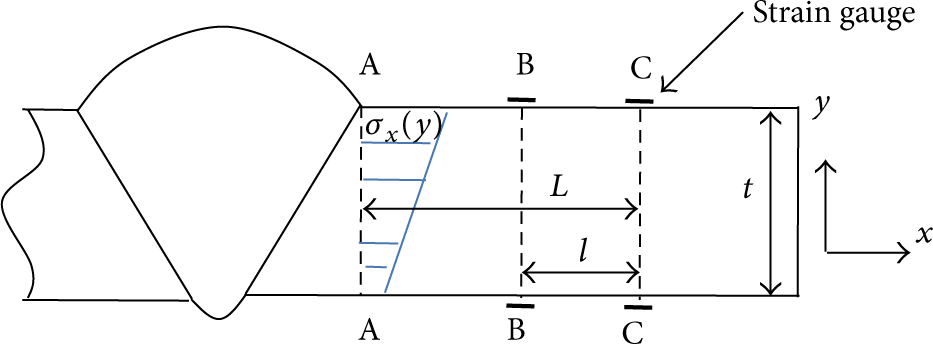
Illustration of structural stress measurement.
Membrane stress and bending stress at the end of the weld toe can be assessed with a proportional expression based on the membrane stress and bending stress calculated from each cross section and distance from the end of the weld toe using

Finally, the SS (σ s ) at the end of the weld toe (A-A) is calculated with the sum of membrane stress (σ m ) and bending stress (σ b ) as below:

Figure 16 shows the HSS with a “circle” symbol and structural stresses with a “blue circle” symbol. Stress concentration factors of HSS and SS, as a whole, show small and very similar values except TR (top right) for the specimen 280-1. However, HSS and SS cannot accurately predict the stress at the weld toe since these stress values are measured only at the center of the specimen as can be seen in Figure 15, while the FSP fatigue specimen has reduced stress due to the smooth curvature at the weld toe as seen in Figure 17. Therefore, it is necessary to consider the stress concentration factor from the point where fatigue cracks are propagated by using finite element analysis and the simplified calculation method to assess a more accurate stress concentration factor.

Comparison of stress concentration factors.

Illustration of stress distribution at weld toe.
4.2.3. Effects of Stress Concentration by FE Calculation and Simplicity Formula by Weld Bead Shape
The stress concentration factor of the FSP specimen was determined by the simplified equation [24] and finite element analysis according to bead profile and both results were compared. First of all, silicone putty meant for dentures was used to mold the weld bead shape. The molding of the whole bead including weld toe was done to measure the bead profile from the specimen. The putty molding was cut with a 5 mm gap along the bead length, the cut bead shape was magnified 20 times by an optical microscope, and the bead width (L, mm), bead height (h, mm), toe radius (ρ, mm), and flank angle (θ,°) were measured as shown in Figure 18. Figure 19 shows the cut bead profile of a weld joint at the upper face and the measurement values for specimen 280-1. The cut bead profile was measured for the six specimens among a total of nine specimens. The stress concentration factor (K t ) was obtained from a measured bead profile by using [24]

Where

Notation for parameters of welded bead profiles.

Typical measurement mode of bead shape (top bead of specimen 280-1).
In Figure 16, stress concentration factors calculated from the bead profiles of six specimens are shown by the “red box” symbol. The calculated stress concentration factors were, as a whole, around 1.5 though there was a slight difference in each value. Further, the large stress concentration factor at the starting point of fatigue crack propagation occurred in all specimens. In the results measured by the simplified equation, since it estimated the stress concentration factor from the bead profiles, there was a limit in representing a reasonable stress concentration factor if the weld toe profile had a smooth curvature as in the case of FSP.
The stress concentration factor was also estimated by finite element analysis after measuring the bead profile which was the same as stress concentration factor of the simplified calculation method using silicone putty molding for the weld beads. The same analysis condition was applied in Section 4.2.1. The stress concentration factors estimated by finite element analysis were presented as the symbol “box” in Figure 16. Figure 20 shows a typical stress distribution calculated by finite element analysis. The stress concentration factor was 1.509–2.239 on the upper face and 1.789–2.35 on the back face of the bead. Therefore, it was found that the stress concentration factor was highest at the starting point of fatigue crack propagation compared with those in other fatigue specimens. The stress concentration factor based on the finite element analysis was, as a whole, larger by around 30% compared with the stress concentration factor obtained by the simplified calculation method.

Typical stress distribution of finite element calculation (280-1).
Therefore, if the shape of the weld toe had a smooth curvature as in the case of the FSP specimen, it was not possible to calculate the stress concentration factor appropriately by the HSS, SS, and simplified equation. The reason was that, in the HSS and SS, stress concentration factors were expressed by the extrapolation of stresses from a specified distance from the weld toe, while the simplified calculation method calculated the stress concentration factor by using only bead profile. On the contrary, finite element calculation could reasonably calculate the stress concentration factor for an FSP specimen because it considered not only bead profile but also weld toe profile. In addition, the stress concentration factor was relatively larger at the fatigue crack starting point compared with other parts.
4.3. Improvement in Fatigue Life with Postprocess (FSP Method)
The fatigue experimental results of the various techniques that improved the fatigue strength of the weld itself were presented for transverse welded plates in bending. According to the results, the range in fatigue strength improvement at 2 × 10⁶ cycles was 25–30% for AWS profiled joint [25], 50–200% depending on the type of joint for burr grinding [26], 20–50% for disc ground [26], approximately 50% for TIG dressing [27], and 50–200% for ultrasonic impact peening [13]. Meanwhile, to compare improvements to the fatigue strength of the reference data above and FSP, two S-N curves were drawn from FSP in Figure 12. The S-N curve was drawn using the results of the FSP fatigue experiment and another S-N curve using the same S-N curve slope for the as-welded specimen to evaluate fatigue strength improvements conservatively.
As a result of the comparison, the fatigue strength for FSP at 2 × 10⁶ cycles was predicted to increase by a range of 50–110%. Also, in the magnified microstructure of the base metal, the FSP, and the FCAW, it was observed that ferrite and pearlite structures through the FSP were finer than those of the FCAW. With the increase of fatigue life in an FSP specimen, its grain size became smaller than the FCAW specimen's. Usually, fatigue life increases as a microstructure becomes smaller. Therefore, the fatigue life improvement method proposed by this study is effective at improving fatigue life at weld joints.
5. Conclusions
In this study, a new postweld treatment method is presented that enhances fatigue life by improving the weld bead shape and metal structure at the welding zone using the welding process friction stir processing (FSP). The results of this study are as follows.
The optimum pin shape and process conditions are drawn to improve fatigue life in the weld toe by implementing FSP.
The new postweld treatment method for fatigue life controlling stress concentration through modifying the weld toe using the FSP method is recommended. FSP contributes to reducing the stress concentration factor by 13.22–15.73% compared to the as-weld.
Fatigue life at the improved weld joint for FSP is improved by around 42% compared to the as-welded specimen under the design load (280 MPa).
Hot-spot stress, structural stress, and simplified calculation methods cannot accurately predict the stress at the weld toe in case the shape of the weld toe has a smooth curvature as in the case of the FSP specimen. This is because the stress concentration factor is determined by extrapolating the stress from a specified distance from the weld toe and calculated by using only the weld bead profile.
The stress concentration factor by finite element calculation considers not only bead profile but also weld toe profile. Thus, the stress concentration factor for the FSP specimen could be assessed reasonably by FE analysis. The stress concentration factor is calculated to be relatively larger at the starting point of fatigue crack propagation.
Highlights
The optimum process condition was drawn to improve fatigue life by implementing FSW.
Friction stir processing contributed to reducing the stress.
Fatigue life was improved by around 42% compared to that of the as-welded specimen.
Conflict of Interests
The authors declare that they have no conflict of interests regarding the publication of this paper.
Footnotes
Acknowledgment
This research was supported by Basic Science Research Program through the National Research Foundation of Korea (NRF) funded by the Ministry of Education, Science and Technology (no. 2013-056169).