
Abstract
Bulge deformation of the slab is one of the main factors that affect slab quality in continuous casting. This paper describes an investigation into bulge deformation using ABAQUS to model the solidification process. A three-dimensional finite element analysis model of the slab solidification process has been first established because the bulge deformation is closely related to slab temperature distributions. Based on slab temperature distributions, a three-dimensional thermomechanical coupling model including the slab, the rollers, and the dynamic contact between them has also been constructed and applied to a case study. The thermomechanical coupling model produces outputs such as the rules of bulge deformation. Moreover, the three-dimensional model has been compared with a two-dimensional model to discuss the differences between the two models in calculating the bulge deformation. The results show that the platform zone exists in the wide side of the slab and the bulge deformation is affected strongly by the ratio of width-to-thickness. The indications are also that the difference of the bulge deformation for the two modeling ways is little when the ratio of width-to-thickness is larger than six.
1. Introduction
Bulge deformation of the slab is one of the main factors that cause inner crack and decline in slab quality in continuous casting. However, bulge deformation measurement has been a very difficult problem to be solved due to the production feature of continuous casting. Only a few papers [1, 2] presented experimental data of bulge deformation. In recent years, some measurement methods and patents have been proposed, but these methods applied in bulge deformation measurement have not been reported. Therefore, the analytical method and the finite element method have been widely adopted to predict this deformation by many researchers.
At the beginning of the study, analytical methods have been used because of their convenience. In these methods, continuous beam models and plate models are usually suggested. The slab was regarded as a beam in beam models based on the theory of bending beam [3, 4]. And the slab was regarded as a plate in plate models based on the plate theory [5, 6]. Moreover, the analytical model of calculating the resistance from bulge deformation was derived from the energy of bulge deformation [7]. However, analytical calculation precision is low because there are some differences between the actual conditions and the analytical model that is simplified too much. The development of the computer makes it possible to simulate bulge deformation with FEM [8, 9]. The two-dimensional models have been adopted by the majority of previous researches [10, 11]. Bulge deformation on a longitudinal section along the center of the slab is considered in these models. And a reasonable creep material model used in FEM analysis for bulge of cast slab was determined based on the comparative results between simulation and experimental data [12]. The genetic phenomenon of bulge deformation in the continuous casting process was explained [13]. But the bulge deformation of the narrow side in these models cannot be investigated. Moreover, temperature changes of the wide side are neglected. Unfortunately, these temperature changes are related to the bulge deformation of the slab. Therefore, some three-dimensional models have been developed by some researchers [14, 15]. In order to simulate the effect of casting speed on slab broadening in the secondary cooling zone, a three-dimensional viscoelastic-plastic thermal-mechanical coupled model was suggested [16]. And Zhang et al. proposed a thermal-mechanical model with the elastoviscoplastic constitution to predict bulge deformation of the strand [17]. But the dynamic contacts between the rollers and slab or the deformation of narrow side have not been considered in these models.
In this paper, an improved three-dimensional thermomechanical coupling model has been built by considering the viscoelastic property and movement of the slab based on the actual solidification process of the slab in continuous casting. Moreover, the three-dimensional model has been compared with a two-dimensional model to discuss the differences between the two models in calculating the bulge deformation.
2. The Analysis of Temperature Field
Bulge deformation is closely related to the temperature fields of the slab. However, the temperature changes of the wide side and the narrow side cannot be truly reflected in the two-dimensional model. Therefore, the solidification process has been first simulated by using the three-dimensional heat transfer model. A three-dimensional solidification model has been compared with that of a two-dimensional model.
2.1. The Finite Element Models of Temperature Field
In the three-dimensional solidification model, a quarter model of the slab was built because of the symmetry of the structure. Element type DC3D8 was chosen to mesh the slab. There are 44400 elements and 54135 nodes in this model. But the differences of the slab heat transfer conditions between the inner arc and the outer arc were not considered.
A two-dimensional solidification model was also established in this study. The inner temperature of the slab shell was applied as the liquid temperature and the outer temperature of the slab shell was imposed based on the solidification analysis.
2.2. Physical Property Parameters
The material of slab is Q235. The geometry of the slab and other parameters has been listed in Table 1.
Thermal conductivity.
Thermal conductivity was defined as follows.
Solid thermal conductivity was obtained as follows [18]:

Liquid thermal conductivity was considered as follows:

Mushy thermal conductivity was defined as follows:
Specific heat.
Specific heat was defined as follows.
Solid specific heat was obtained as follows [19]:
Liquid specific heat was defined as follows:

The latent heat was considered to calculate mushy specific heat. The latent heat was modeled using the equivalent specific heat as follows:

where L f is the latent heat and the value for Q235 steel is 2.84 × 10⁵ J·Kg−1.
Simulation constants for solidification analysis.

2.3. Boundary Conditions
The following boundary conditions were used in the solidification analysis. The heat flux in the mould was defined as follows [20]:

The heat flux in the secondary cooling zone was considered as follows:

The heat flux in the air-cooling zone was defined as follows:

In this paper, the cooling water heat transfer, the slab surface radiation, and the heat transfer between the rollers and the slab have been defined as the equivalent convection coefficient heq. As shown in Figure 1, a quarter model of the slab has been divided into 6 zones to define the heq. In order to simulate the solidification process, the heq values of 25 time steps are specified and listed in Table 2.
heq value in different time steps.


Different zones to set up different heq.
As shown in Figure 2, the simulation results of the temperature of the slab's surface are compared with the monitoring temperature during the continuous casting. The curves show that the simulation results of the solidification agree relatively well with the measured data.

Comparison between the simulation results and measured data.
2.4. Analysis Results
The temperature fields have been obtained in continuous casting and the temperature fields at the end of the no.5 segment were chosen to analyze.
Temperature field contours of the two models are compared in Figure 3. As shown in Figure 3(a), the thickness of the slab shell is approximately 68.5 mm (the chromatic section). Large temperature gradients exist in the wide side and the narrow side of slab because of the uneven cooling conditions. The temperature near the corner is the lowest because of the 2D cooling effect.

Temperature fields of two models at the end of no.5 segment.
As shown in Figure 3(b), the inner temperature of slab shell is the liquidus temperature 1456°C and the outer temperature of that is 940°C. It can be seen that the temperature distributions of the wide side and the narrow side cannot be considered in the two-dimensional model. However, the absence of the actual temperature distributions would lead to inaccuracies in the two-dimensional model because the bulge deformation is closely related to the temperature fields.
As shown in Figure 4(a), the temperature distributions of the wide and the narrow side have been obtained. The temperature of the centre of the wide side is 929°C. The highest temperature is 1053°C which is at 0.45 m from the centre of the wide side due to the decline in water cooling. The lowest temperature is 656°C which is at 0.6 m from the centre of the wide side due to the strong 2D cooling effect. The difference in temperature of the wide side is 397°C and the temperature drops by 37.7%. The mean temperature of the wide side is approximately 937.3°C.
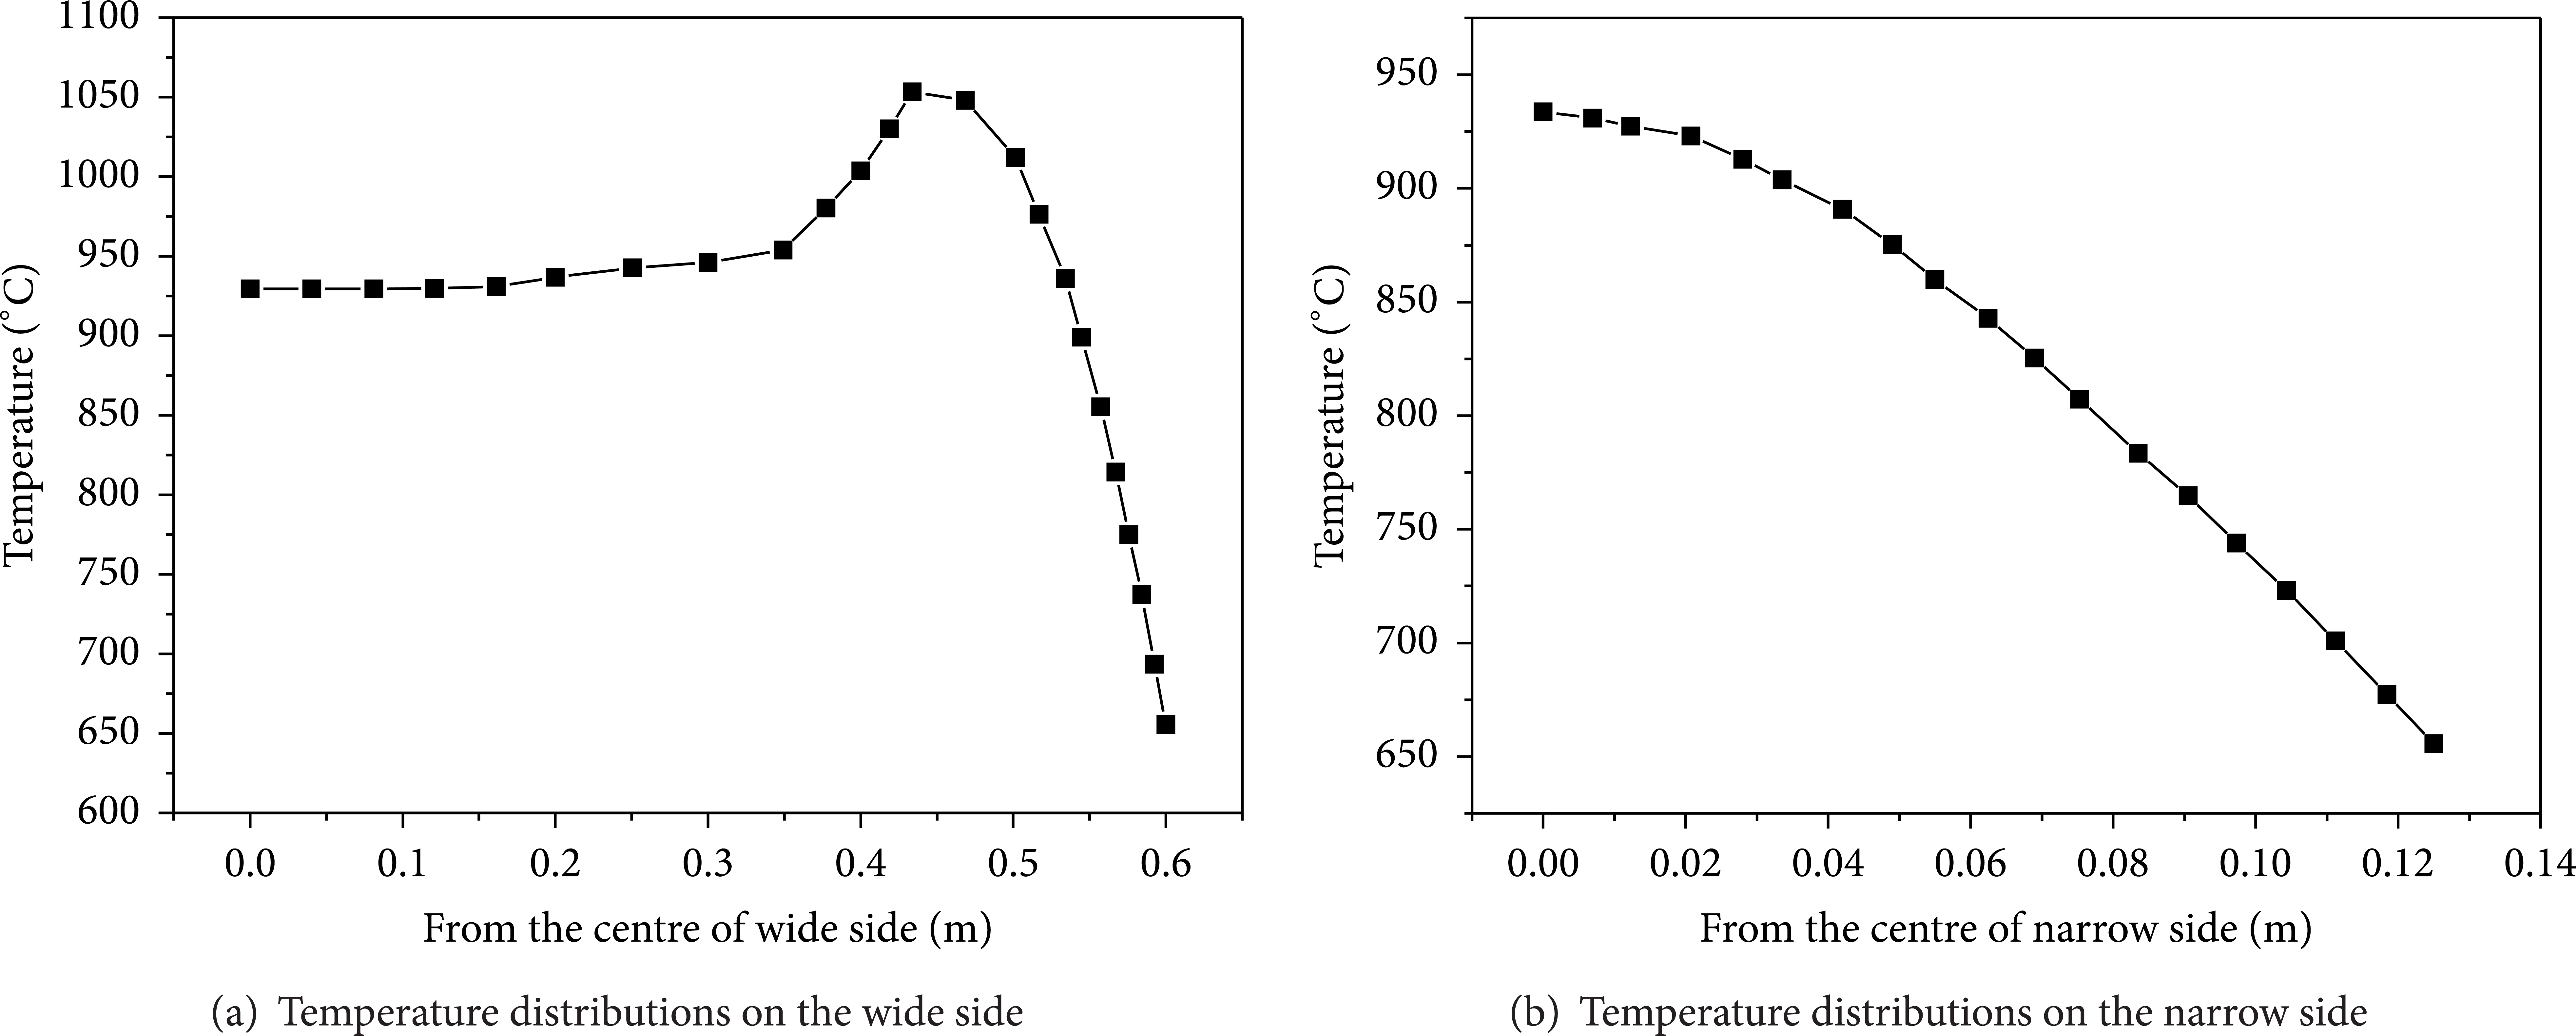
Three-dimensional temperature distributions at the end of no.5 segment.
As shown in Figure 4(b), the temperature of the narrow side decreases when the distance increases. The highest temperature is 934°C which is at the centre of the narrow side. The lowest temperature is 656°C which is at 0.125 m from the centre of the narrow side. The difference in temperature of the narrow side is 278°C and temperature drops by 29.8%. The mean temperature of the narrow side is about 830°C.
3. The Analysis of Bulge Deformation
Bulge analysis involves the highly nonlinear behaviors including multiple objects and complex thermomechanical coupling problems. This analysis process is shown in Figure 5. Some simplified methods have been adopted as follows.
A quarter model of the slab and rollers was built because of the symmetry of the heat transfer and the slab structure.
The liquid core inside the solidified shell was replaced by a cavity by remodifying the bulge mesh model based on the three-dimensional solidification analysis, and the ferrostatic pressure caused by the liquid core was applied outward at the surface of the shell.
The driving rollers and the driven rollers were assumed to be the rigid bodies.

The analysis process of slab solidification and bulge deformation.
A three-dimensional bulge model involving thermomechanical coupling has been built, as shown in Figure 6(a). Besides, a two-dimensional model has been also established in this study, as shown in Figure 6(b). Element type C3D8T and CPE4T were chosen to mesh the three-dimensional and the two-dimensional model, respectively. The dynamic contact and heat transfer between the rollers and the slab were taken into account in the two models.

Three-dimensional and two-dimensional bulge models.
3.1. Material Model
3.1.1. Mechanics Parameters
Young's modulus.
In this study, Young's modulus for Q235 steel was from [21], as listed in Table 3.
Poisson's ratio.
The Poisson's ratio was from [16] as follows:

Yield stress.
The yield stress was from [15] as follows:

Coefficient of thermal expansion.
The coefficient of thermal expansion for Q235 steel was from the experimental data [16], as shown in Figure 7.
Young's modulus for Q235.


Coefficient of thermal expansion for Q235 steel.
3.1.2. Creep Model
Bulge deformation is not only composed of the time-independent elastic deformation, but also the time-dependent creep deformation at high temperature. In general, the creep deformation is four times bigger than the elastic deformation [4]. So it is necessary to consider the material creep property. The time hardening creep model was used to describe the viscoelastic behavior of the slab as follows:
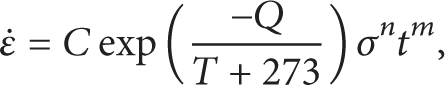
where
In this paper, the carbon content of Q235 steel is 0.18%, and the value of the creep parameters is listed in Table 4.
The value of the creep parameters.

3.2. Boundary Conditions and Contact Definition
The symmetrical displacement constraint was applied to the symmetry area of the quarter model.
Both ends of the slab were constrained to control the translate and rotate.
The ferrostatic pressure caused by the liquid core was applied as the node force increased linearly with distance below the liquid steel meniscus.
The penalty friction model was applied to simulate the contact between the rollers and the slab. The driving roller friction coefficient was considered as 0.3 and for driven roller the value was 0.001, according to the conversion of friction coefficient of the ball bearing.
The angular velocity was applied to the driving roller according to the casting speed and radius of the roller.
Temperature field solutions with the mesh generation were directly loaded into the three-dimensional bulge analysis.
3.3. Bulge Analysis
As shown in Figure 8, the slab is bulging between the rollers due to the ferrostatic pressure and the contact between the slab and the rollers. Besides, the deformation concentrates around the centre position both in the two models, because these regions meet Saint-Venant's Principle and are not affected by boundary conditions. Moreover, the bulge deformation in the inner surface of the slab shell is bigger than that of the outer surface because the inner temperature is higher.

Contours of the bulge deformation.
As shown in Figure 9, the bulge deformations of the wide side and the narrow side are closely related. The bugle deformation of the wide side increases and achieves the maximum and then decreases when the distance increases. The changing trend of the bulge deformation of the narrow side is opposite to that of the wide side. The maximum bulge deformation of the wide side is 1.62 mm when the bulge deformation of the narrow side is minimum value 0.47 mm, and the bulge deformation of the narrow side accounts for 29% of that of the wide side. Bulge deformation of the narrow side is a result of that of the wide side, and the narrow side will be inner concave when the wide side is outer convex.
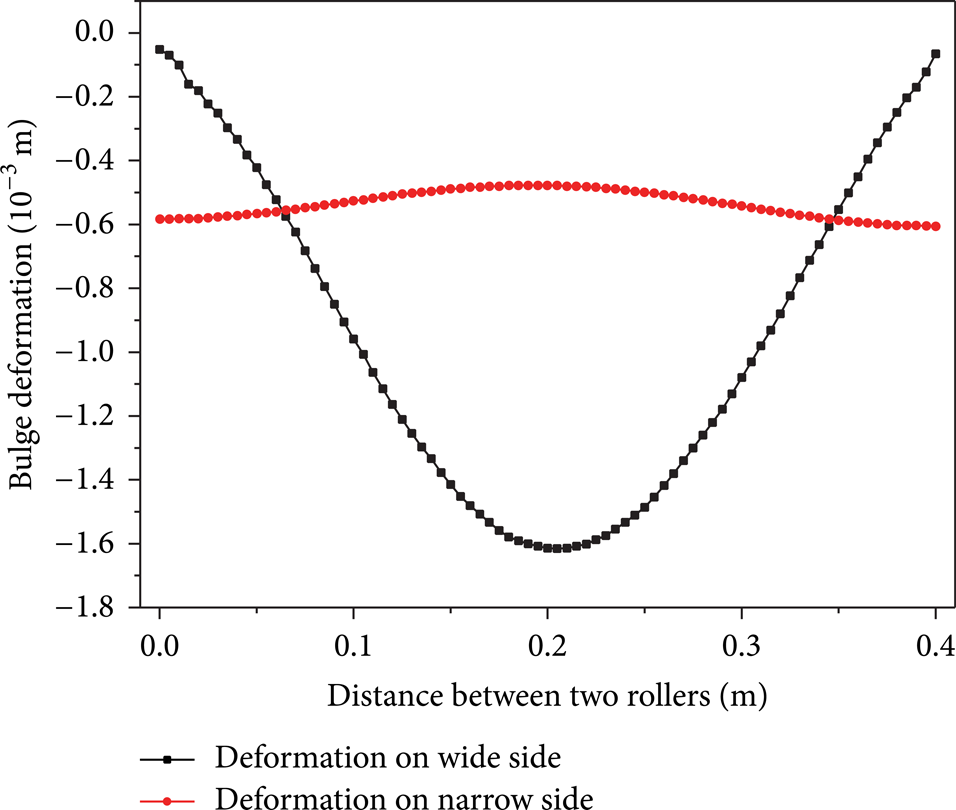
Bulge deformation on wide side and narrow side.
4. Analysis of Bulge Deformation in Two Models
As shown in Figure 10, the bugle deformation increases and achieves the maximum and then decreases when the distance increases in both models. Besides, the location of the maximum deformation was not at the midpoint between the two rollers but in the downstream casting direction. However, the maximum bulge deformation of the three-dimensional model is 1.62 mm while that of the two-dimensional is 1.74 mm.

Bulge deformation between two rollers.
In the direction of width, the bulge deformation at the centre of the two rollers is shown in Figure 11. It can be seen that the bulge deformation increases with the increasing distance along the direction of width. The width region can be divided into three zones according to the changing rate of the bulge deformation: rapid decline zone, transition zone, and platform zone. The changing rate of the bulge deformation in rapid decline zone is the largest, the next one is transition zone, and the last one is platform zone. The platform zone is defined as the zone where the bulge deformation is independent of the width. However, the bulge deformation is dependent of the width of the slab, and the platform zone which accounts for 13% of the width of the slab is so small that the bulge deformation is affected by the other two zones. Therefore, it is the reason that the bulge deformation of the two models is different.

Bulge deformation in the direction of width.
The maximum bulge deformation with different ratios of width-to-thickness is listed in Table 5 to investigate the effect of width on the bulge deformation. The two-dimensional bulge deformation is also listed in Table 5. It can be seen that the bulge deformation is strongly affected by the ratio of width-to-thickness. The bulge deformation changes from 1.06 mm to 1.71 mm with the ratio of width-to-thickness changing from 2.4 to 8.4, and the bulge deformation reaches the constant 1.71 mm when the ratio of width-to-thickness is larger than six. Besides, the two-dimensional result is 1.74 mm. The results show that the difference of the bulge deformation for the two modeling ways is little when the ratio of width-to-thickness is larger than six.
Bulge deformation with different ratio of the slab width-to-thickness.

In the direction of width, the bulge deformation located at the centre of the two rollers with different ratios of width-to-thickness is shown in Figure 12. The bulge deformation zone does not exist the platform zone when the ratios of width-to-thickness are 2.4 and 3.6. The ratios of platform-to-width are 13%, 27%, 61%, and 62% when the ratios of width-to-thickness are 4.8, 6, 7.2, and 8.4, respectively. The results show that the size of the Platform Zone is an important factor that affects the bulge deformation. The difference of the bulge deformation for the two modeling ways is little when the ratio of platform-to-width is larger than 60%.

Bulge deformation in the direction of width.
In conclusion, the bulge deformation of the wide side and the narrow side can be fully reflected in the three-dimensional model. Besides, the temperature changes of the two sides affecting the bulge deformation can also be considered. From the perspective of the modeling process, the two-dimensional model is more efficient than the three-dimensional model due to its simplification. To reduce computational costs, the three-dimensional model can be replaced by the two-dimensional model when the ratio of width-to-thickness is larger than six.
5. Conclusions
The temperature of the centre of the wide side is 929°C. The highest temperature of the wide side is 1053°C which is at 0.45 m from the centre while the lowest is 656°C which is at 0.6 m from the centre of the wide side. The difference in temperature of the wide side is 397°C and the temperature drops by 37.7%.
The slab temperature of the narrow side decreases when the distance increases. The highest temperature is 934°C which is at the centre of the narrow side while the lowest is 656°C which is at 0.125 m from the centre of the narrow side. The difference in temperature of the narrow side is 278°C and the temperature drops by 29.8%.
There are some differences in the maximum bulge deformation between the two-dimensional model and the three-dimensional model. The maximum bulge deformation of the three-dimensional model is 1.62 mm and that of the two-dimensional model is 1.74 mm when the ratio of width-to-thickness is 4.8.
The platform zone exists in the wide side of the slab and the bulge deformation is affected strongly by the ratio of width-to-thickness. The difference of the bulge deformation for the two modeling ways is little when the ratio of width-to-thickness is larger than six.
Footnotes
Nomenclatures
Conflict of Interests
The authors declare that there is no conflict of interests regarding the publication of this paper.
Acknowledgment
This paper is supported by the National Natural Science Foundation of China (no. 51375041).