
Abstract
Coiled tubing drilling has become an important development direction of drilling. The method of combining theoretical calculation with the experimental verification is adopted to analyze the flow of the coiled tubing drilling system. A set of experimental bench is developed, three kinds of curvature ratio of coiled tubing are used, and the frictional pressure losses of coiled tubing and partial pressure drop of each downhole tool are tested. The results of experiments with water agree well with rough pipe calculation model. The pressure losses of coiled tube are obviously larger than that of straight tube, and the value of it is about 11–17%. The larger the curvature ratio is, the more the pressure losses of coiled tubing are. The fluid experiment with the polymer presents obviously the drag reduction effect. Experiment of simulated bottom hole assembly shows that partial pressure drop of bottom hole assembly is large. It has a little effect on the pressure losses of coiled tubing when whole bottom hole assemblies are connected. The research results can be used as the basis for formulating coiled tubing drilling process parameters, which will provide a guide for engineering practice.
1. Introduction
Coiled tubing unit (CTU), playing an increasingly important role in exploration and development of oil and gas, has been widely applied in oil and gas project including servicing, drilling, completion, and logging. Coiled tubing drilling (CTD) has many characteristics such as small tube diameter, large frictional pressure losses of coiled tube, pipe flow variation after sinusoidal, and helical buckling occurring in the well. A large and variable frictional pressure loss of CTD has a great effect on drilling performance and efficiency and even leads to a drilling failure. Bottom holes assembly (BHA) of CTD is complicated and so are the changes of its frictional pressure losses.
Recent related experimental researches mainly focus on the analysis of frictional pressure drop of Newtonian flow and non-Newtonian flow and the analysis of the impact of drag reducer and solid phase on fluid flow pressure drop. McCann and IsIas [1] carried on turbulent frictional pressure losses experiments of CT by using a mixed fluid composed of bentonite, lime, and fresh water and contrast the results in theory. Khade and Shah [2] took foam fluids as the experimental fluid and found that empirical friction losses correlation can be used to predict an accurate Fanning friction factor for foam fluids in CT. Medjani and Shah [3] studied the influence factors about frictional pressure losses of three kinds of polymer with different concentrations and obtained the frictional pressure losses correlations which can be applicable to several kinds of fluid through fitting experimental data according to the power-law regression. Shah et al. [4] and Shah and Zhou [5] studied influence on drag reduction effect through the polymer concentration, the curvature of CT, and velocity of flow and found that the drag reduction effect is closely relative to turbulent intensity. Willingham and Shah [6] studied the law of frictional pressure losses of four kinds of polymer with different concentration and a kind of drilling mud and arrived at frictional pressure losses correlations which are applicable to the above fluid by fitting the experimental data according to the least squares method. Jain et al. [7] studied the impact of bending curvature of CT with water and non-Newtonian fluids on pressure losses, and by comparing results of straight and coiled tube, they found that curvature effects are more significant for flow of non-Newtonian fluids as compared to Newtonian fluids. From Zhou and Shah [8, 9], there has been an excellent agreement between the new friction factor correlation and the experimental data obtained from experiments of typical drilling and completion fluids in the full-scale coiled tubing flow loop. Ke et al. [10] carried out the research about evaluation of friction reducers for high-density brines and their application in coiled tubing at high temperatures. Shah and Kamel [11] made the research about investigation of flow behavior of slick-water in large straight and coiled tubing; curvature of CT and roughness affect drag reduction characteristics of this polymeric fracturing fluid significantly. Ogugbue and Shah [12] presented the results of an experimental study carried out to investigate frictional pressure losses behavior of drag reducing polymer solutions, flowing turbulently through an eccentric annulus. Shah et al. [13] and Shah [14] studied the impact of containing sand on friction pressure losses of fracturing fluid and drilling fluid. Properties of drilling fluid affected the friction pressure losses observably, it was found that drill cuttings in drilling fluid can significantly increase friction pressure losses of fluid in CT, and the higher the flow rate is, the more significantly the friction losses increase. In Ma et al. [15], the mathematical model of pressure losses in circulation system is established for coiled tubing ultrashort radius radial drilling, and there are some researches on the calculation of pressure losses of high pressure hose. However, as far as we know, there is no research on the calculation of pressure losses of whole coiled tubing drilling system (CTDS) including BHA, coiled tubing, and straight tubing.
In this paper, in order to analyze the flow behavior of CTDS, a set of experimental bench is developed on the basis of the similarity theory. The experimental bench connects BHA of CTDS and contains three segments with specifications curvature ratio (CR) of CT. The experimental fluid mediums are three kinds of polymer fluid and water, respectively, and the experimental bench conforms to the actual working condition of CTD and can verify related theoretical model. For the experiment, the frictional pressure losses of flow in coiled and straight tube of CT are contrasted. Impact of different polymer additives, bending diameters of coiled tubing, and the existence of BHA on fluid pressure losses of CT are conducted, and the partial pressure drop of each downhole tool and BHA are tested. The experimental results show that the calculation model of rough pipe has good agreement with the experiment. The drag reduction effect can be reflected obviously by polymer fluid, and the drag reduction effect of PF as main additives is better. The partial pressure drop of BHA is also large except for screw motor and bit, and it should be considered in CTD. The research results in this paper can be used as the basis for formulating process parameters of CTD, which will provide a guide for engineering practice.
2. Fluid Similarity Design
Full size experiments need a very large space, and it is difficult to coil CT with a large diameter. In order to fit laboratory experiments, similar experiments and fluid design must be carried out.
2.1. Similarity Criterion
According to Newton similarity criterion, which requires two Newtonian flow numbers to be equal, in other words, it requires that various force attempting to change the flow state and inertia force should maintain the same scale. That is almost impossible to be achieved in the model test. There is usually only one force playing a leading role in a particular flow. Therefore, it just needs to make this force satisfy the similar conditions for the model test. In addition, Reynolds criterion, Froude criteria, and Euler criteria are also used widely.
The pipe flow in this experiment is fluid flow which is mainly affected by flow resistance, that is, viscous force. It is a pressurized flow but gravity does not affect the velocity distribution, so this kind of similar flow requires similar Reynolds numbers. The model test can only guarantee approximate similarity. That is, the forces playing a main role to the flow are similar. There are two different conditions for studying pipe flow generally: (1) Reynolds number is small (in the laminar zone, critical transition zone, turbulent smooth zone, and turbulent transition zone), and the main factor influencing velocity and flow resistance is viscous force; so Renault criterion is adopted to design the similarity model; (2) Reynolds number is large (in the turbulent rough zone), and flow resistance is only related to the roughness and has nothing to do with Reynolds number. At this time, as long as geometry similarity is guaranteed, flow will achieve dynamic similarity.
Circulating fluid is all in turbulent smooth zone and turbulent transition zone during CTD. So in order to reach dynamic similarity of the model, Reynolds criterion must be satisfied.
2.2. Similar Scale
When Reynolds criterion is met, and the same fluid is adopted, viscosity and density scale are as follows:

Make length scale as the basic scale:
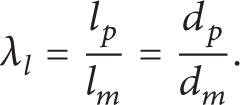
The relationships between velocity, flow scale, and length scale are as follows:


For the design of model, in general, the length scale is chosen first in accordance with the test range required by the model, size of existing test site, and the conditions to manufacture and measure the model. The model law is selected according to the analysis of fluid force, and it is required that the force which plays a main role in flowing is similar. The required flow rate of the model is calculated according to the maximum flow rate of prototype and the chosen similarity criterion. It should check whether the experimental facilities can meet demands of flow rate of model test. If it can not meet demand, length scale should be adjusted or liquid capacity of laboratory should be increased. We can calculate the pressure losses in pipe flow as follows:
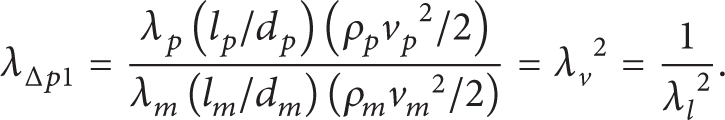
Carrying on analysis on pipe pressure drop scale by (5), experimenting with pipes of the same roughness and the same fluid, and considering Reynolds criterion, we come to the following conclusion:
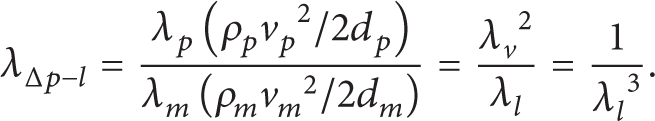
The internal structure of downhole tool shows that partial pressure drop is mainly caused by fluid changing suddenly when fluid passes a hole or flow section. In both cases, the pressure drop scale should be respectively calculated by the following:

The pressure losses of the pipe increase with the length linearly. Due to the limited experiment field, the length of experimental pipe cannot meet the geometric scale. So we adopt the frictional pressure losses gradient at this time. The frictional pressure losses gradient scale is given by
Because bending angles are commanded the same for geometric similarity, the ratio of diameter of tube to roller diameter of the model and prototype should be the same. For the coiled tube in experiments, the CR of coiled tube needs to be within the minimum to maximum CR of CT.
3. Experiment Setup
3.1. Experiment Bench
The fluid characteristics experiment bench of CTDS is mainly composed of four functional modules: hydraulic supply system, test data acquisition display system, coiled tubing segment system, and simulated BHA system. Hydraulic supply system contains three storage tanks whose volume is 6 m3 and one pump group. Pump group system adopts triplex plunger pump, whose rated capacity is 267 L/min and rated pressure is 12 MPa, connected with high pressure hose and energy accumulator to reduce water hammer and also the safety valve is equipped. Data acquisition test display system can easily derive the flow rate and differential pressure value of each tube section and simulated tools by a flow sensor, thirteen pressure sensors, acquisition cards, and a secondary instrument, and then the system can collect data to the computer for analysis. Three kinds of coiled tube with different diameters and a certain length of straight tube are adopted by the experiment bench of CTDS. Simulated BHA system contains CT connector, quick connector, orienting tool, dual flapper check valve, release tool, dual actuated circulating valve, ultralight thruster, restrictor sub, and hammer. Figure 1 shows the fluid characteristics experiment bench of CTDS.

Fluid characteristics experiment bench of CTDS.
3.2. Parameters Design
In order to imitate the actual field situation and keep a similar roughness, CT used in the experiment is industrial CT. If small tube is connected with other tool string, it may cause the excess of the maximum pump pressure; if the diameter of tube is large, it is difficult to coil. Therefore, 1-in. CT is adopted in our experiment. In some researches about CTD, such as Kelessidis and Mpandelis [16] and Cox et al. [17], 2–7/8-in. CT is applied in scene, and pump capacity is mostly between 300 and 600 L/min. The upcoming actual drilling operation also uses 2–7/8-in. CT. The experimental length scale here is

Substituting (9) into (4), when the Reynolds numbers are equal, we will come to the conclusion that flow rate required to supply for the experiment should reach about 210 L/min, so the selection of the pump meets requirements.
In order to discuss the influence of different diameters of coiled tube, we chose three different specifications of coiled tube in the experiment. The length of CT at site is 3500 m, and diameter of roller is 2.6 m. Calculate the ratio of different CT radius to bending radius of coiled tube, r0/R, which is called curvature ratio (CR). When there is only one layer of CT on roller, the value of CR is 0.0281; the value of CR is 0.0242 when the length of drilling is 2500 m and only 1000 m CT remaining on roller; and the value of CR is 0.0213 when the length of drilling is 1500 m and only 2000 m coiled tubing remaining on roller. The range of CR for 2–7/8-in. CT used in the industry is from 0.01 to 0.03; it is thus clear that the above three groups of r0/R are appropriate.
According to the geometric similarity, the CR of the experimental tube should be consistent with that of the actual prototype. Three kinds of roller diameter are designed according to the above three kinds of CR when we use 1-in. CT. For the length of straight tube in experiments, it only needs to guarantee that flow enters steadily into tool string from the coiled tube, and 6 m is suiTable in this experiment. This value is large enough relative to diameter. The specific experimental parameters of CT are shown in Table 1.
Specifications of CT used in experiments.

In this experiment, we adopt tool size mating with 2–7/8-in. CT as prototype and then design simulated downhole tools in accordance with to the length scale.
3.3. Experimental Fluid Medium
In order to verify theoretical model and close to actual situation on site at the same time, we adopt four kinds of fluid in the experiment. Water can be used to verify the situation of Newton flow. In order to inspect flow and drag reduction of the polymeric non-Newtonian fluid, we use Xanthan in the experiment. In addition, through the experimental study, we have developed two kinds of drilling fluid which can be used for CTD, and their main additive codes are JH and PF. These two kinds of fluid are used in experiment according to actual compounding concentration. Table 2 shows flow properties and rheological properties of experimental fluids. In order to reflect better the correlation between the non-Newtonian fluid and power-law, we have calculated the error between the experiment test parameters and calculation parameters of constitutive equations by using the power-law, shown in Table 2.
Rheological and pipe flow properties of experimental fluids.
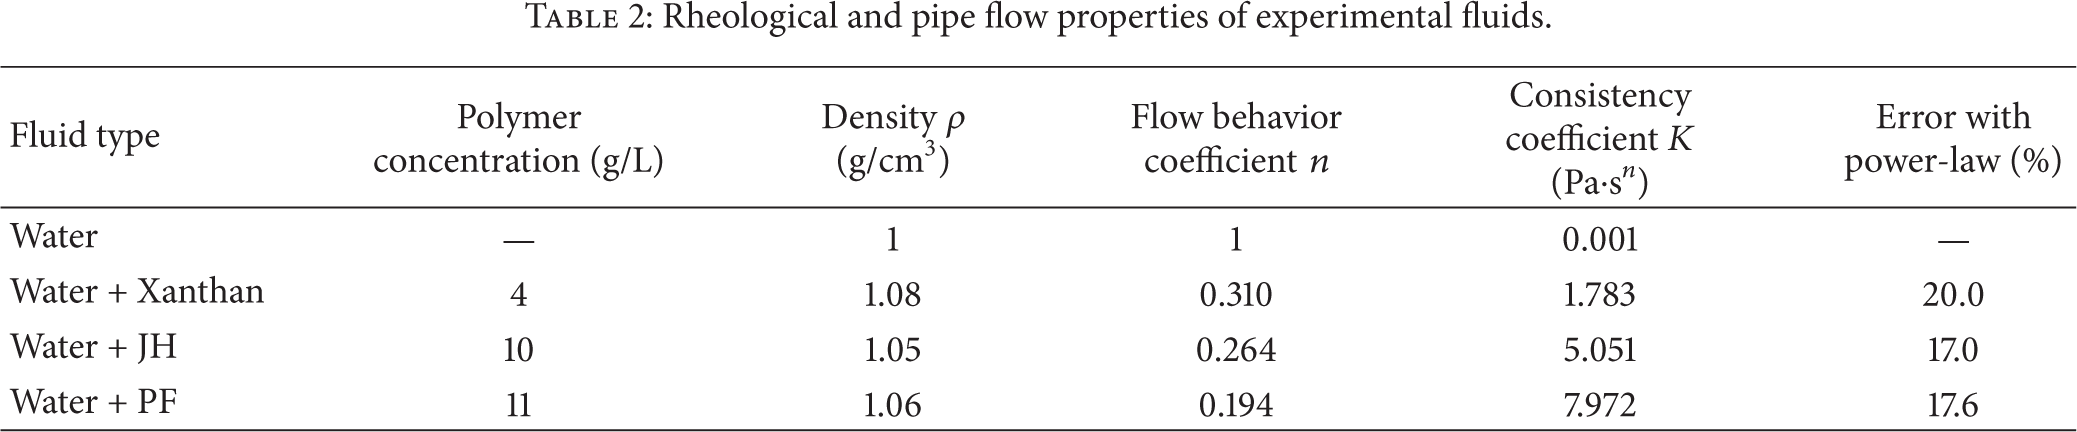
For Xanthan, we adopt concentration of 4 g/L, the rheological parameters of which are within the recommended range of Shah and Zhou [18]; its experimental data can be compared with the data in the literature.
3.4. Experiment Procedures
Twelve groups of experiments are, respectively, carried out with 4 kinds of fluid and 3 kinds of CT with different CR. Each group of experiment contains the following specifics: without simulated BHA, only containing coiled and straight tube; connecting nine simulated BHA with CT separately; connecting with all simulated tools after coiled and straight tube. The specific experimental steps are as follows: checking and cleaning tools; cleaning filter; confirming to open suction valve and discharge valve of the fluid tank in this experiment and closing other valves; opening the back pressure valve and bypass valve; checking all sensors and corresponding collection channels, opening collection system, and recording; measuring viscosity after pump circulating for 2 minutes; looping over the experiments connected with BHA and no BHA for three times and the other experiments twice; closing the bypass valve gradually until pump reaches its maximum delivery capacity; when first sensor shows that the pressure is more than 9 MPa, opening the bypass valve immediately; recording and deriving the experiment data. It should be pointed out that flow rate needs to be controlled in the experiment with CT connected with BHA, and the pressure of the system will become large at this time.
4. Results and Discussion
4.1. Frictional Pressure Losses of Experimental Fluid
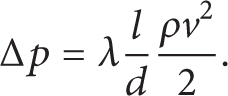
Sufficient experiment with water has been carried out, and the experiment results are compared with the related theoretical model. The frictional pressure losses in CT are usually expressed as a form of pressure drop; that is,

where L is the length of CT, d is the inner diameter of CT, v is the average velocity of tube fluid, and f is Fanning friction factor which is associated with the factors such as Reynolds number of fluid and wall roughness.
The Fanning friction factor correlations for Newtonian fluids in straight and coiled tube have been discussed in McCann and IsIas [1], Shah and Kamel [11], Zhou and Shah [19], and Rao [20]. Among them, the calculation model of CTES software is more appropriate. For turbulent flow in this study, the calculating model of tube is divided into rough pipes and smooth pipes, which are, respectively, Blasius and Colebrook-White (C-W) correlations:
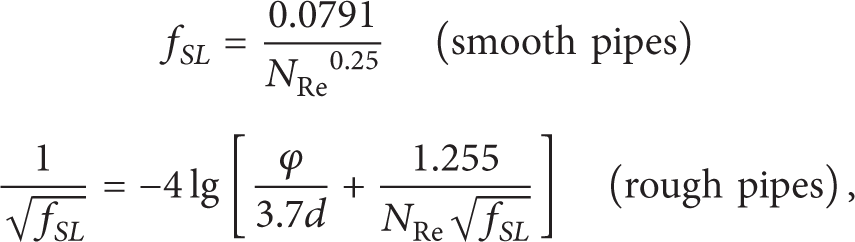
where φ is the absolute roughness of the CT and the value of it is approximately equal to 0.04725 mm for commercial steel pipes.
For coiled tube of CT, we adopt the Sas-Jaworsky (S-J) correlation:

where D is the bending diameter of coiled tube.
Compare the experimental results with the results of previous correlations. Figures 2 and 3 show the pressure losses gradient of water in 1-in. CT test. We compare the test data with Blasius, C-W, and S-J correlations. In the case, from Figures 2 and 3, we find that the correlations of C-W and S-J match the test data well. The experiment is based on the similar principles, so the calculation model of rough pipe is more reasonable for CTD.
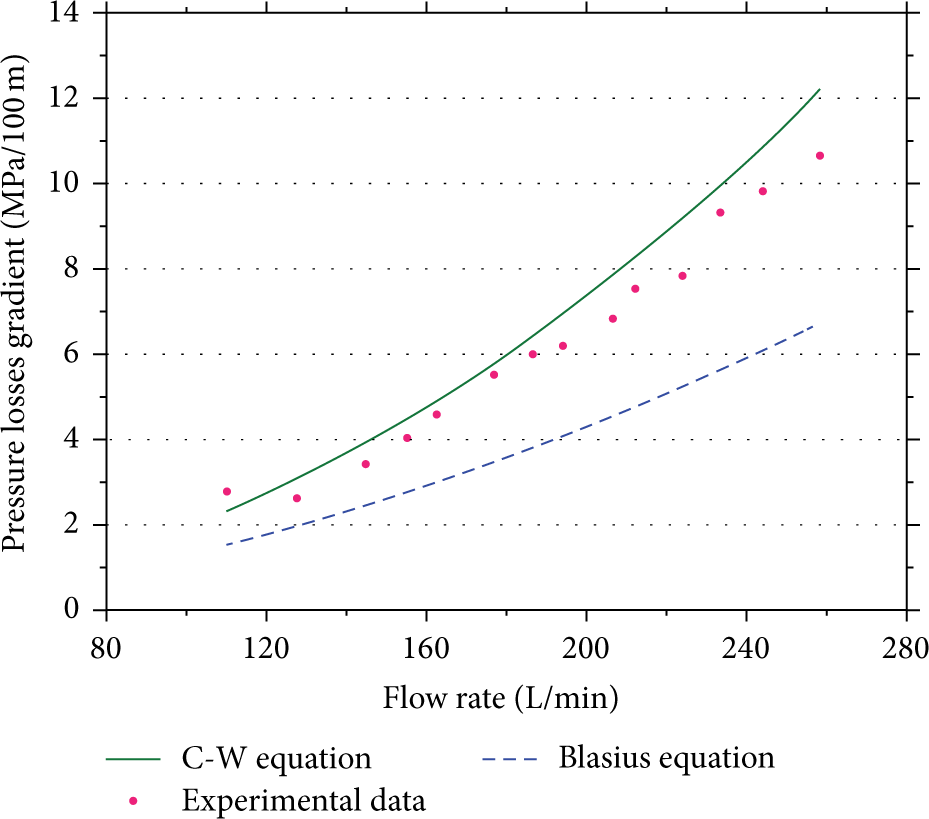
Comparison between experimental data and predicted values of pressure losses gradient for water in straight tube.
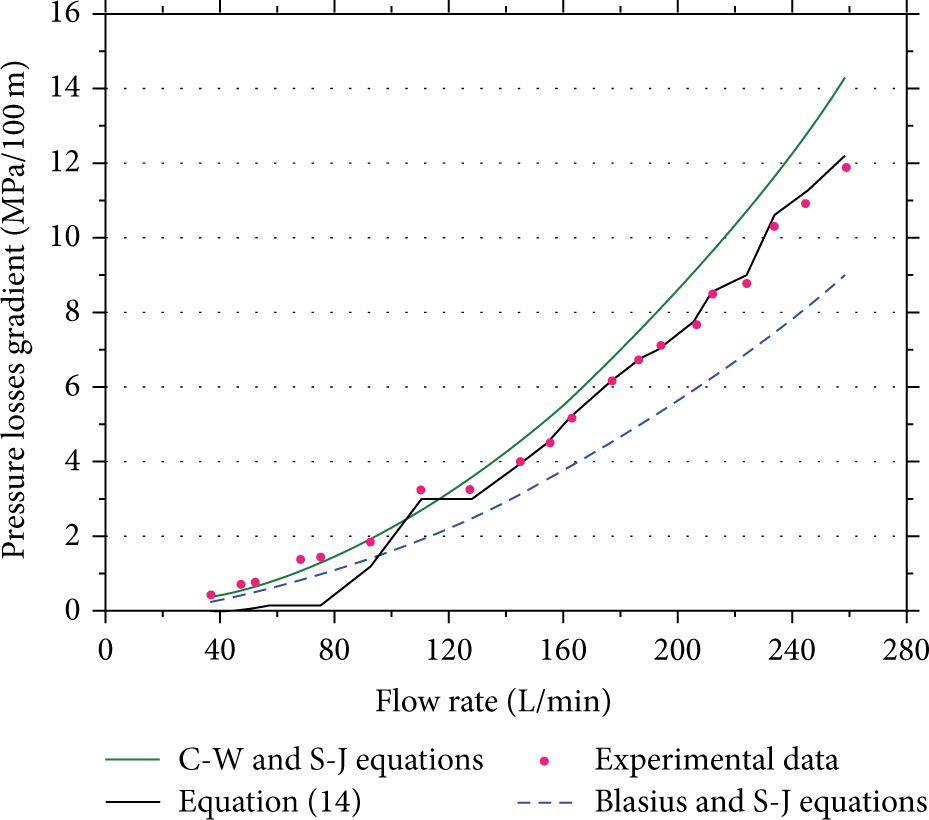
Comparison between experimental data and predicted values of pressure losses gradient for water in coiled tube.
In order to compare the experiment results with the calculation results obtained by Sas-Jaworsky (S-J) correlation, we put forward a new correlation:

For experimental results of different experimental fluids, different coefficient K can be obtained.
In Figure 3, experimental data are used for fitting and shown as black curve. The coefficient K of water is also derived as follows:

The experimental data of other three kinds of experimental fluid are used for fitting, and correlations can be derived as follows.
For Xanthan,

For JH,
For PF,

It is shown that the three coefficients K are all less than the coefficient of water, and this has certain relation with polymer drag reduction and the incomplete compliance between experimental fluid with power-law fluid.
Figure 4 shows the pressure losses gradient contrast of coiled and straight tube, where the value of CR for CT is 0.0242. A significant increase in pressure losses in CT is observed as compared to that of straight tube in Figure 4, and the experimental results of coiled tube are about 11–17% higher than that of straight tube, which is very close to the results of Jain et al. [7]. We can also find out that the calculation results derived by Sas-Jaworsky (S-J) correlation are slightly larger than the experiment results.
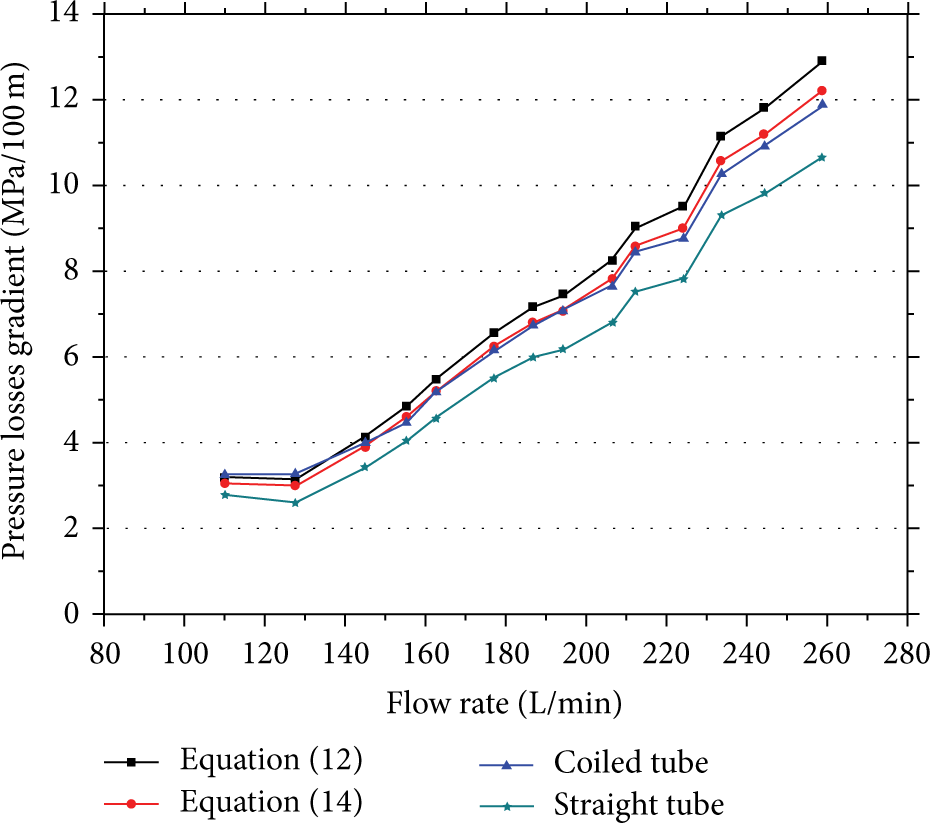
Comparison between experimental data of pressure losses gradient for water in straight and coiled tube (CR = 0.0242).
4.2. Polymer Drag Reduction Performance
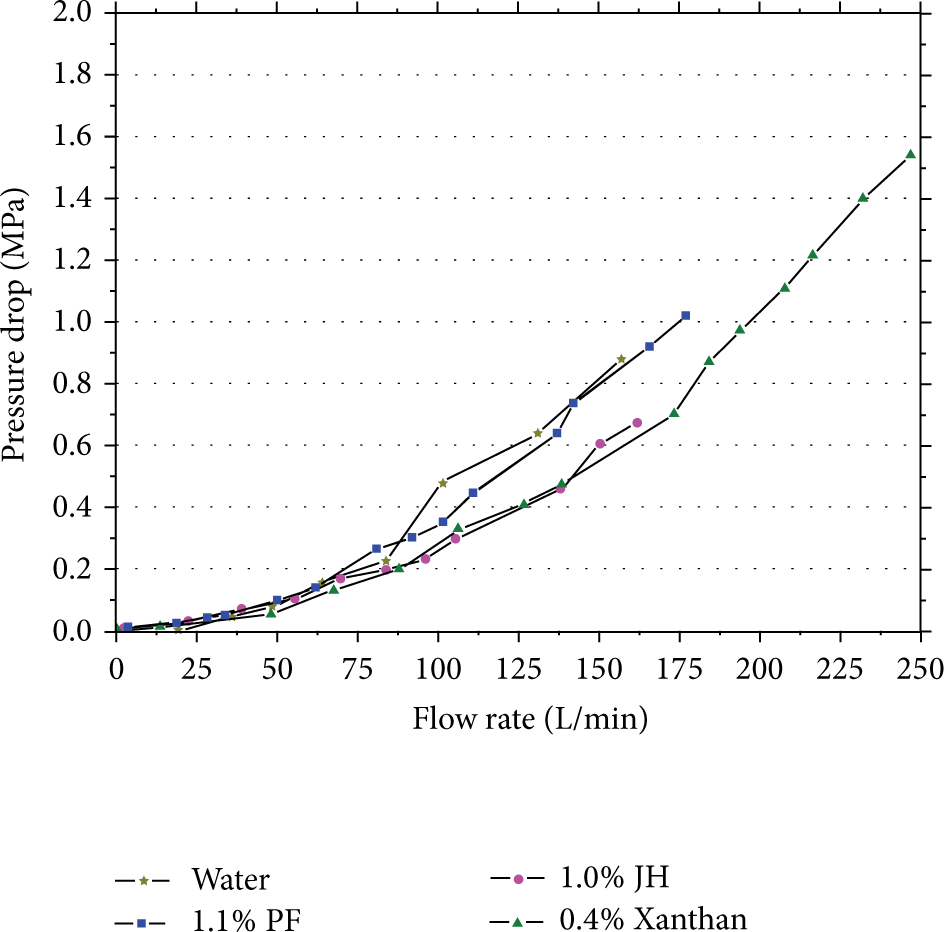
Experiments are, respectively, carried out with three kinds of polymer experimental fluid in Table 2 and pressure losses of CT are compared with the experimental results of water; then the drag reduction ratio (DRR) of them is obtained. Figure 5 depicts the curves of DRR as a function of solvent Reynolds number for Xanthan, JH, and PF polymeric fluid in CT with curvature ratio (CR = 0.0281), respectively. These curves reveal the effect of polymer concentration on drag reduction in coiled and straight tube of CT. In order to show the changes of pressure gradient along with NReg, pressure gradient curve is also reflected in Figure 5. Among three kinds of polymer experimental fluid, the drag reduction effect of PF is the best. In Shah and Zhou's [5] experiment with 1-in. CT, the solvent is Xanthan with concentration of 40 lb/Mgal and the experimental conditions of which are similar to that of our experiment. When the maximum flow rate and Reynolds number are achieved in Xanthan experiment, the maximum value of DRR is about 60%, which is very close to the results of Shah and Zhou [5]. When the circulation flow rate is small, namely, under the low Reynolds number, the effect of polymers does not afford to drag reduction but increases the pressure losses of experimental fluid.
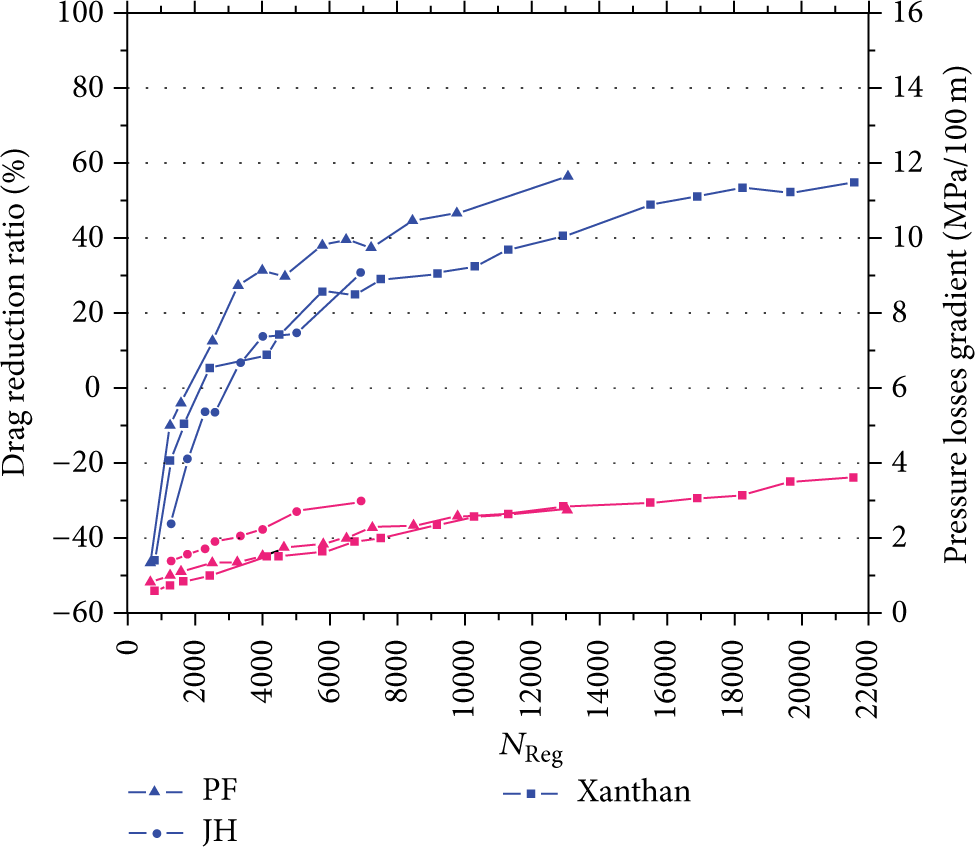
Comparison of drag reduction and pressure losses gradient of different fluids with the changes in Reynolds number.
4.3. Effect of Curvature Ratio
Figure 6 shows the experimental results with three kinds of specifications of CR for CT in water; with the increase of CR, the pressure losses of CT also increase, but as a result of the small flow rate used in the experiment, the amount of increase is small. Using the frictional pressure losses gradient scale, the difference among the final pressure losses of three kinds of CR for 2–7/8-in. CT is only about 0.2–0.3 MPa, which is less than 5%. Therefore, we can only calculate the pressure losses of the smallest CR for CT, which can ensure the safety, and the values are within the range of engineering error.

Experimental pressure losses gradient of water in 1-in. CT for different curvature ratios.
4.4. Effect of BHA
In order to make our conditions better meet the actual drilling conditions, in this subsection, we not only carry out the fluid experiment of CT, but also conduct the flow experiment of CT connected with each downhole tool and BHA, which is different from the related literature.
Figures 7, 8, and 9 show, respectively, the pressure drop of four kinds of fluid experiments of CT connected with hammer, orienting tool, and release tool when the value of CR is 0.0281. We can find that partial pressure drop of BHA mainly depends on its internal flow channel structure and is independent of fluid medium in the case of similar fluid density. At this time, the drag reduction effect of polymer is not obvious in partial pressure drop of BHA.

Experimental pressure drop of hammer connected with CT (CR = 0.0281) for different fluids.
Experimental pressure drop of orienting tool connected with CT (CR = 0.0281) for different fluids.
Experimental pressure drop of release tool connected with CT (CR = 0.0281) for different fluids.
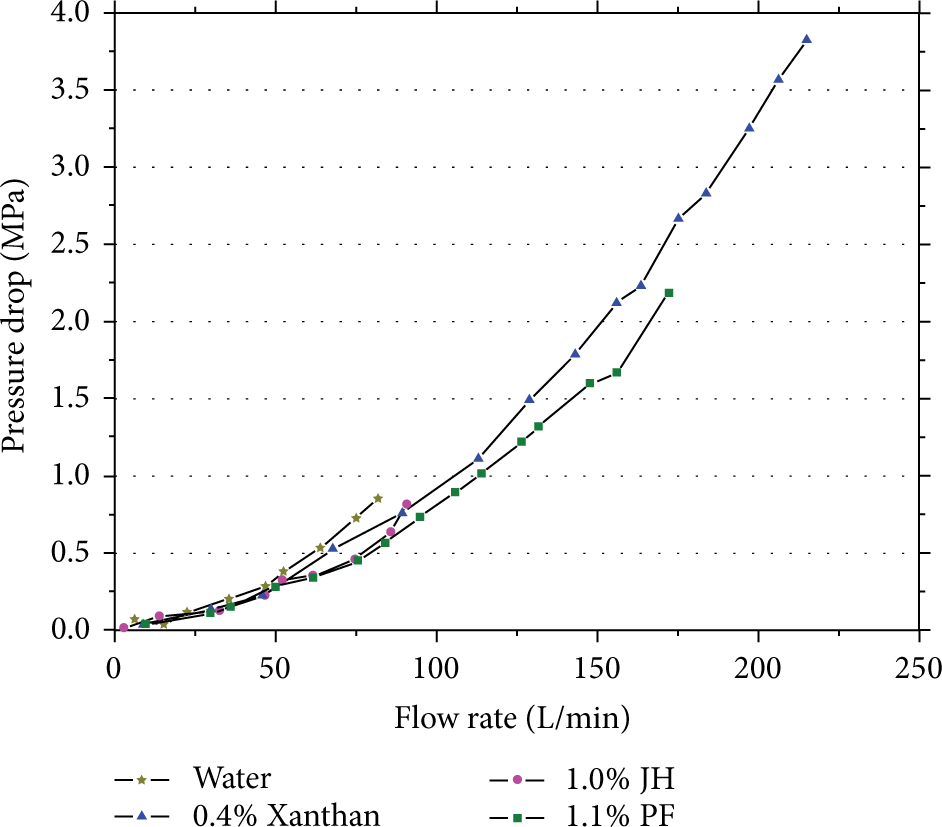
Figure 10 shows partial pressure drop changing with flow rate for each tool after connecting BHA with CT (CR = 0.0281). From the figure, pressure drop of each downhole tool connected with CT can be reflected, so as to understand the situation of whole BHA, which can provide reference for selecting tool in actual operation. Although the flow rate is not large, the partial pressure drop of BHA is very large. Referring to the pump delivery capacity of actual CTDS by curve fitting the similar scale of partial pressure can be calculated according to (7). If tool sets mentioned in this paper are adopted, the partial pressure drop of BHA not including screw motor and bit is 5–6 MPa. Obviously it does not conform to some actual experiences for CTD, which only consider pressure drop of screw motor and bit and ignore pressure drop of other downhole tools.

Experimental pressure drop of each downhole tool connected with CT (CR = 0.0281) for water.
In order to compare the influence of the flow pressure losses of CT connected with BHA with that of CT connected without BHA, Figure 11 shows pressure losses gradient of CT in the above cases when the value of CR is 0.0281. Through calculation, the average error of the two experimental curves is 7.75%, which is very close. From Figure 11, we can find that there is so little difference on pressure losses of CT between both cases, which means that the impact on estimation for actual flow pressure losses of CT is small after CT is connected with BHA.
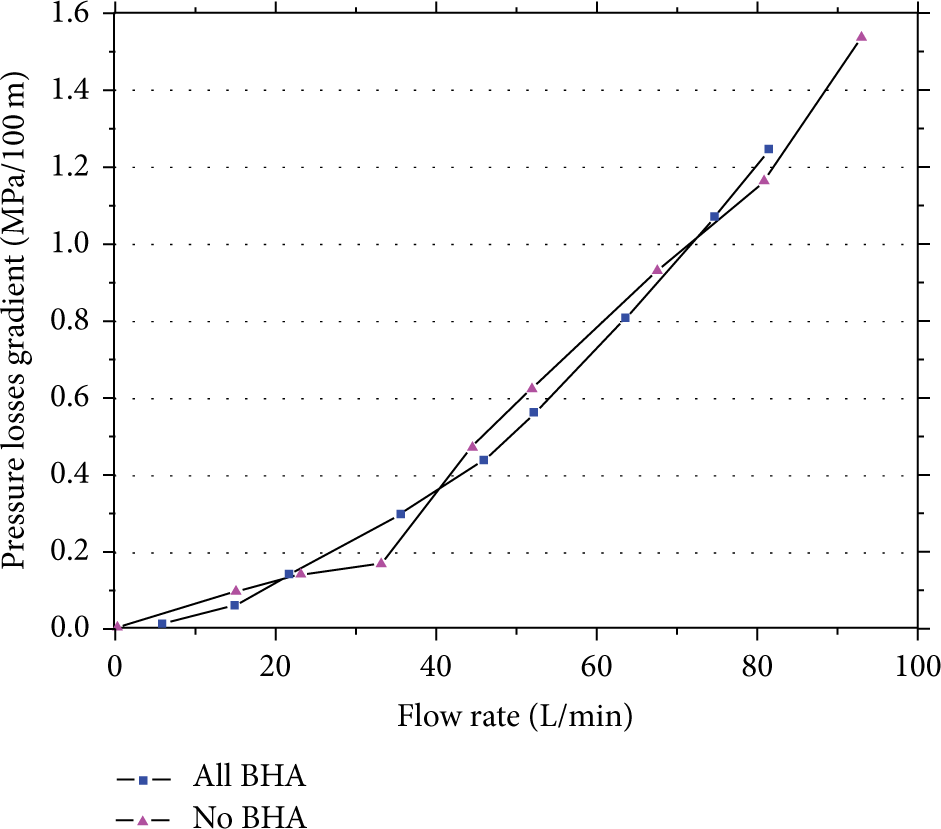
Comparison of pressure losses gradient of CT connected with BHA and no BHA.
5. Conclusion
Based on the analysis of a series of experiments conducted in tube test system, the results can be drawn as follows.
The experimental results show that the Colebrook-White rough pipe calculation model is closer to reality under the working condition of CTD. The pressure losses of coiled tube of CT are obviously larger than that of straight tube and the value of which is about 11–17%. CR has certain influence on pressure losses; the greater the CR is, the more the pressure losses of CT are. But considering the difference of CR caused by different number of layers of coiled tube, the difference of pressure losses of CT is very small, so pressure losses of CT with the smallest value of CR can be the basis of calculating drilling process parameters.
Drag reduction effect can be reflected obviously by flow experiments of CT which is carried out with polymer fluid. Experimental results of Xanthan show that the maximum drag reduction rate under the rated flow is close to the experimental data in the related literature. The drag reduction effect of PF is better among two types of actual drilling fluid additive used on CTD.
Experiment of simulated BHA has been carried on. Results show that partial pressure drop of BHA is large except for screw motor and bit, and it should be considered in the actual CTD. The experiment also shows that the effects on pressure losses of CT connected with BHA and no BHA are little. For actual CTD, it is feasible to estimate the pressure losses of CT only using the calculation model of tube.
Conflict of Interests
The authors declare that there is no conflict of interests regarding the publication of this paper.
Footnotes
Acknowledgments
This study was jointly supported by the PetroChina Innovation Foundation (no. 2012D-5006-0307), the National Natural Science Foundation of China (nos. 51275057 and U1262108), and the Major National Science and Technology Projects of China (no. 2011ZX05036-006).