
Abstract
Sewage centrifugal pumps can operate at different flow rates with variable rotating speeds to meet different performance requirements and achieve certain energy consumption criteria in pipeline systems. In this paper, the unsteady pressure field has been investigated numerically by CFD calculation to evaluate the transient pressure variation in a single-blade pump running with low rotating speeds. Based on the CFD results, the pressure fluctuation intensity was analyzed quantitatively by defining the standard deviation of the pressure fluctuation of a revolution period. The analysis of the results shows that the flow rate can influence the fluctuation intensity distribution obviously, and the same intensity distribution law can be found in the volute domain for the same flow rates with different rotating speeds. Obvious asymmetrical distributions can be observed in both front and back side chamber channels, and the pressure fluctuation intensity in back side chamber is weaker than in front side chamber. This work can obtain the knowledge of unsteady pressure phenomenon for typical flow rates in the low-speed running single-blade pump and can provide basis to optimize and to obtain more reliable pump at variable rotating speeds.
1. Introduction
Sewage centrifugal pumps with single-blade impeller, due to the smallest number of blade and the largest flow channel required, are widely used for pumping wastewater with large portions of fibers and solids in order to avoid flow disturbances by clogging. However, a severe problem caused by strong rotor-stator interaction is faced with this hydrodynamic unbalanced impeller structure, especially when the sewage pumps are developed for large scale and high power nowadays. The strong unsteady flow and pressure fluctuations caused by RSI in the pump generally cause the periodically hydrodynamic force acting on the impeller surface and result in strong rotor vibrations [1, 2]. The reliability of the pump, therefore, will be decreased obviously, and the pump users will face the high maintenance cost of the pump and other severe problems. In addition, sewage centrifugal pumps generally may operate under off-design conditions in practical pipeline systems, constant nominal running speed with nonconstant flow rates, or variable running speed conditions, to achieve different performances and energy-saving operation strategies required in their lifetime, and stronger unstable turbulent flow and more complex flow structure may be caused. Therefore, it is important to investigate the pressure fluctuation behaviors to enhance the knowledge of unsteady flow in the pump for multiflow rates and multirotating speeds conditions.
During the past decade, some research work for single-blade pumps has been carried out using numerical and experimental methods. For example, Benra et al. [3] presented an investigation of the periodic unsteady flow in a single-blade pump by the CFD simulation and PIV measurement method. The results of transient numerical simulations compared very well to velocity measurements, but this was only true when all flow details were included into the numerical calculation. Pei et al. [4] investigated numerically by computational fluid dynamics (CFD) calculation the transient pressure variation in a single-blade pump for different flow rates under nominal rotating speed. The strength of the pressure fluctuation was analyzed quantitatively by defining the standard deviation of the pressure fluctuation of a revolution period. In addition, the periodically unsteady flow-induced impeller oscillations for a single-blade pump were investigated both numerically and experimentally under off-design conditions, and a partitioned strategy with load transfer method was selected for achieving successful fluid–structure interaction (FSI) simulations with both two-way coupling and one-way coupling methods [5, 6]. Souza et al. [7] focused on the optimization of single-blade impeller hydraulics from the perspective of both performance and solids handling ability by numerical prediction. Nishi et al. [8] proposed a method of designing a single-blade centrifugal impeller for which the passed particle size was specified based on the CFD analysis. Souza et al. [9] addressed volute design as they applied it to single-blade impeller pumps. Keays and Meskell [10] executed a numerical study of a single-vanned wastewater pump using commercial CFD software.
Although, in these researches, the studies have been done focusing on the design methods, optimization issue, and the unsteady flow field behavior caused by RSI for nominal speed condition, few results of unsteady pressure behaviors have been discussed in sewage centrifugal pump during low-speed operations.
The objective of this study was to propose the pressure fluctuation intensity coefficient to analyze the time-dependent flow behaviors in the pump with several typical low rotating speeds (n = 1250 r/min and n = 1000 r/min) based on the 3D CFD simulations. The pressure fluctuation intensity distributions in the impeller channel, volute channel, and the impeller outlet area have been analyzed.
2. CFD Simulations and Parameter Definitions
2.1. Pressure Fluctuation Intensity Definitions
For the transient simulations obtained by URANS equations, the pressure fluctuation components are only the phase-averaged values which are highly periodic on each grid node in the whole computational domain, and no instantaneous fluctuating pressure components are obtained. Therefore, the periodically unsteady pressure p at a grid node can be decomposed into two parts: the time-averaged pressure
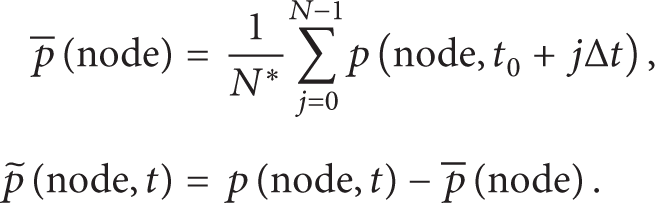
Therefore, to determine the magnitude of the pressure fluctuations for an entire revolution period, a nondimensional pressure fluctuation intensity coefficient C P * is defined as the same as in our former work [4]:

and it is calculated by the standard deviation of the unsteady pressure normalized by the dynamic pressure based on the impeller tip speed U2. Here,N* represents the sample number during one revolution period and t0 is the starting time for one period of transient simulation.
2.2. CFD Simulation Method
Parameters of the pump are shown in Table 1. The cross-section of the pump is shown in Figure 1, and the positions of sections for analyzing the results in side chamber, named as Section A for front side chamber and Section B for back side chamber, were given, respectively.
Parameters of the pump.
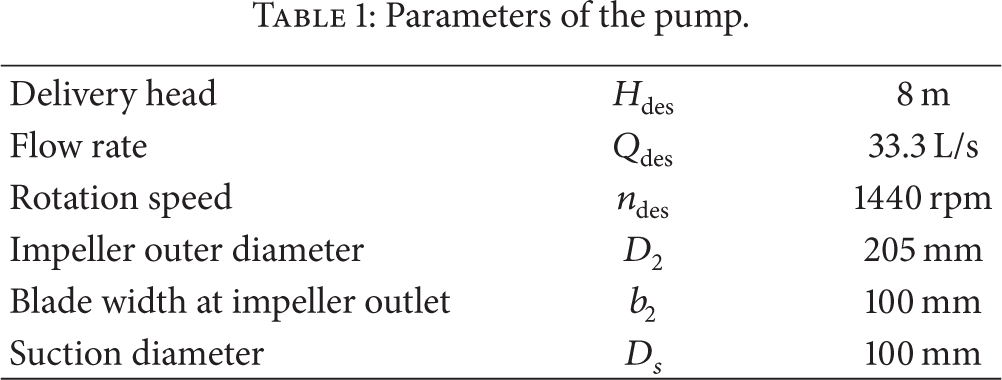
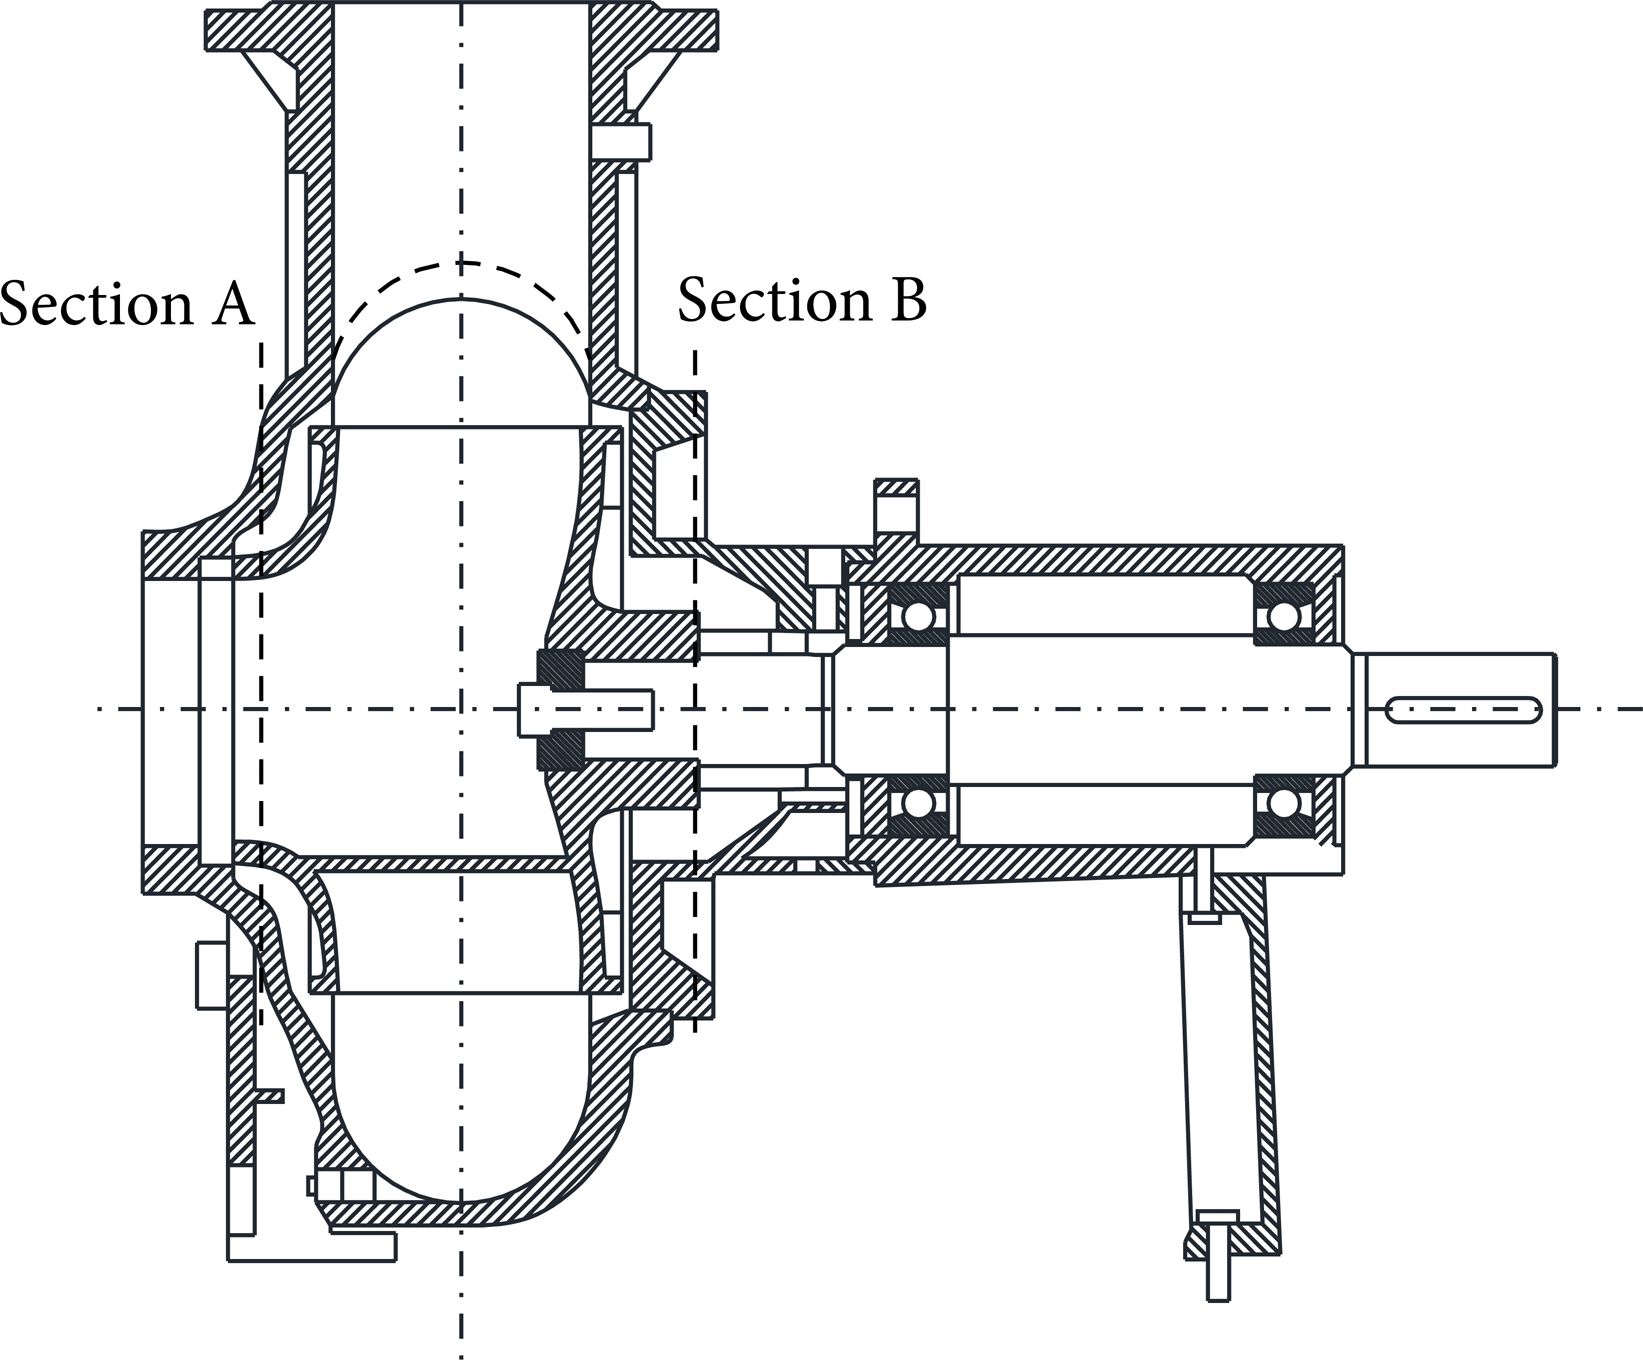
Cross-section of model pump.
Three-dimensional, unsteady Reynolds-averaged Navier–Stokes equations are solved in ANSYS CFX 12.1, and the mass conservation equation and momentum conservation equation for incompressible fluid are as follows:

where μ is dynamic viscosity, F
i
is source item, and
The shear stress transport (SST) turbulence model by Menter [13] is chosen to enclose the equations. The k − ω SST model accounts for the transport of the turbulent shear stress and gives highly accurate predictions of the onset and the amount of flow separation under adverse pressure gradients by the inclusion of effects into the formulation of the eddy viscosity. This turbulence model is a blending between the k − ω model near the surface and the k − ε model in the outer region. It consists of a transformation of the k − ε model to a k − ω formulation and a subsequent addition of the corresponding equations. The Wilcox model is thereby multiplied by a blending function F1 and the transformed k − ε model by a function (1 − F1). F1 is equal to one near the surface and switches over to zero inside the boundary layer. At the boundary layer edge and outside the boundary layer, the standard k − ε model is therefore recovered. The equations are as follows:

The structured grids for the computational domains are generated using the grid generation tool ICEM-CFD 12.1; the grid is shown in Figure 2, and the number of grid nodes is totally 2, 182, 132 for both the rotating and the stationary domains. The maximum of nondimensional wall distance y+ < 80 has been obtained in the complete flow field.

Calculation grid for fluid domain.
The discretization in space is of second-order accuracy, and the second-order backward Euler scheme is chosen for the time discretization. The interface between the impeller and casing is set to “transient rotor-stator” to capture the transient rotor-stator interaction in the flow, because the relative position between the impeller and the casing is changed for each time step with this kind of interface. Two different coordinate systems are utilized for rotation and stationary domain, respectively. Inlet boundary condition is set to total pressure in stationary frame while outlet condition is mass flow rate, and all specific values are obtained from laboratory test. Smooth wall condition is used for near wall function. The chosen time step Δt for the transient simulation is 4 × 10⁻⁴ s for rotating speed n = 1250 r/min and is 5 × 10⁻⁴ s for rotating speed n = 1000 r/min corresponding to the changed angle of 3°; therefore, 120 transient results are included for one impeller revolution calculation. Within each time step, the number of iterations 10 has been chosen and the iteration stops when maximum residual is less than 10−3. The convergence criterion for the transient problem is that the result has reached its stable periodicity; 9 revolutions of the impeller for each operational condition in this case are conducted.
For analyzing the pressure fluctuation intensity results, two coordinate systems are defined, stationary coordinate frame was marked as x, y, and rotating coordinate frame was marked as ψ, ξ, as shown in Figure 3. The rotation position of the impeller is indicated by defining the rotating angle φ between positive axis ψ of rotating coordinate frame and positive y axis of stationary coordinate frame in clockwise direction, and φ = 0° is obtained when the trailing edge of the impeller is at the top position. The angle of circumferential position in the stationary coordinate is defined as θ, and θ = 0° when x = 0 m and y > 0 m. And the circumferential position angle θ increases along clockwise direction in x, y coordinate, as shown in Figure 3.
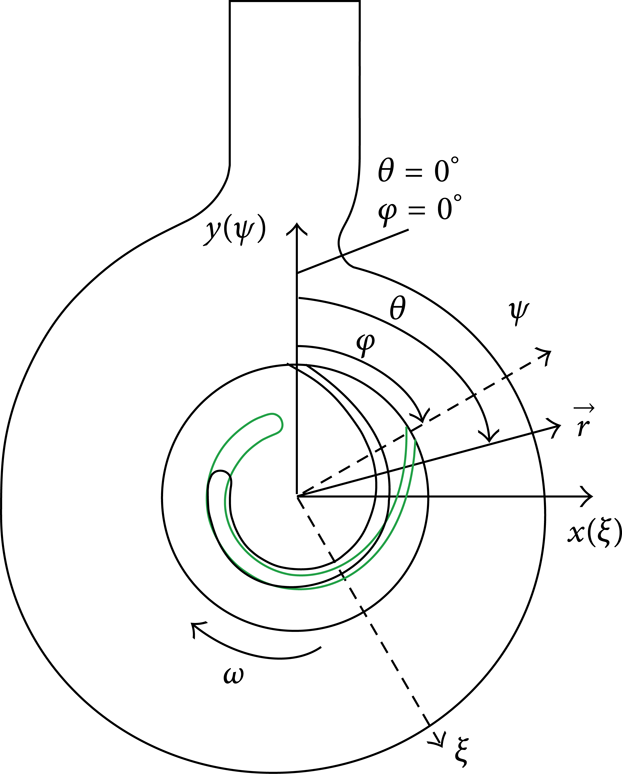
Coordinate system and angle definitions.
3. Results
To verify the accuracy of the calculation, experimental data were collected for the model pump in the laboratory. The comparisons of head curves obtained by numerical calculations and experiments for all the operational conditions with low rotating speeds are shown in Figure 4. The result obtained by numerical simulation is confirmed well by the measurement. The transient pressure results at the monitor point on the casing by both CFD and experimental methods were qualitatively compared for low rotating speed conditions, and the results for Q = 11 L/s, n = 1250 r/min and Q = 11 L/s, n = 1000 r/min conditions are shown in Figures 5 and 6, and a good agreement can be observed.
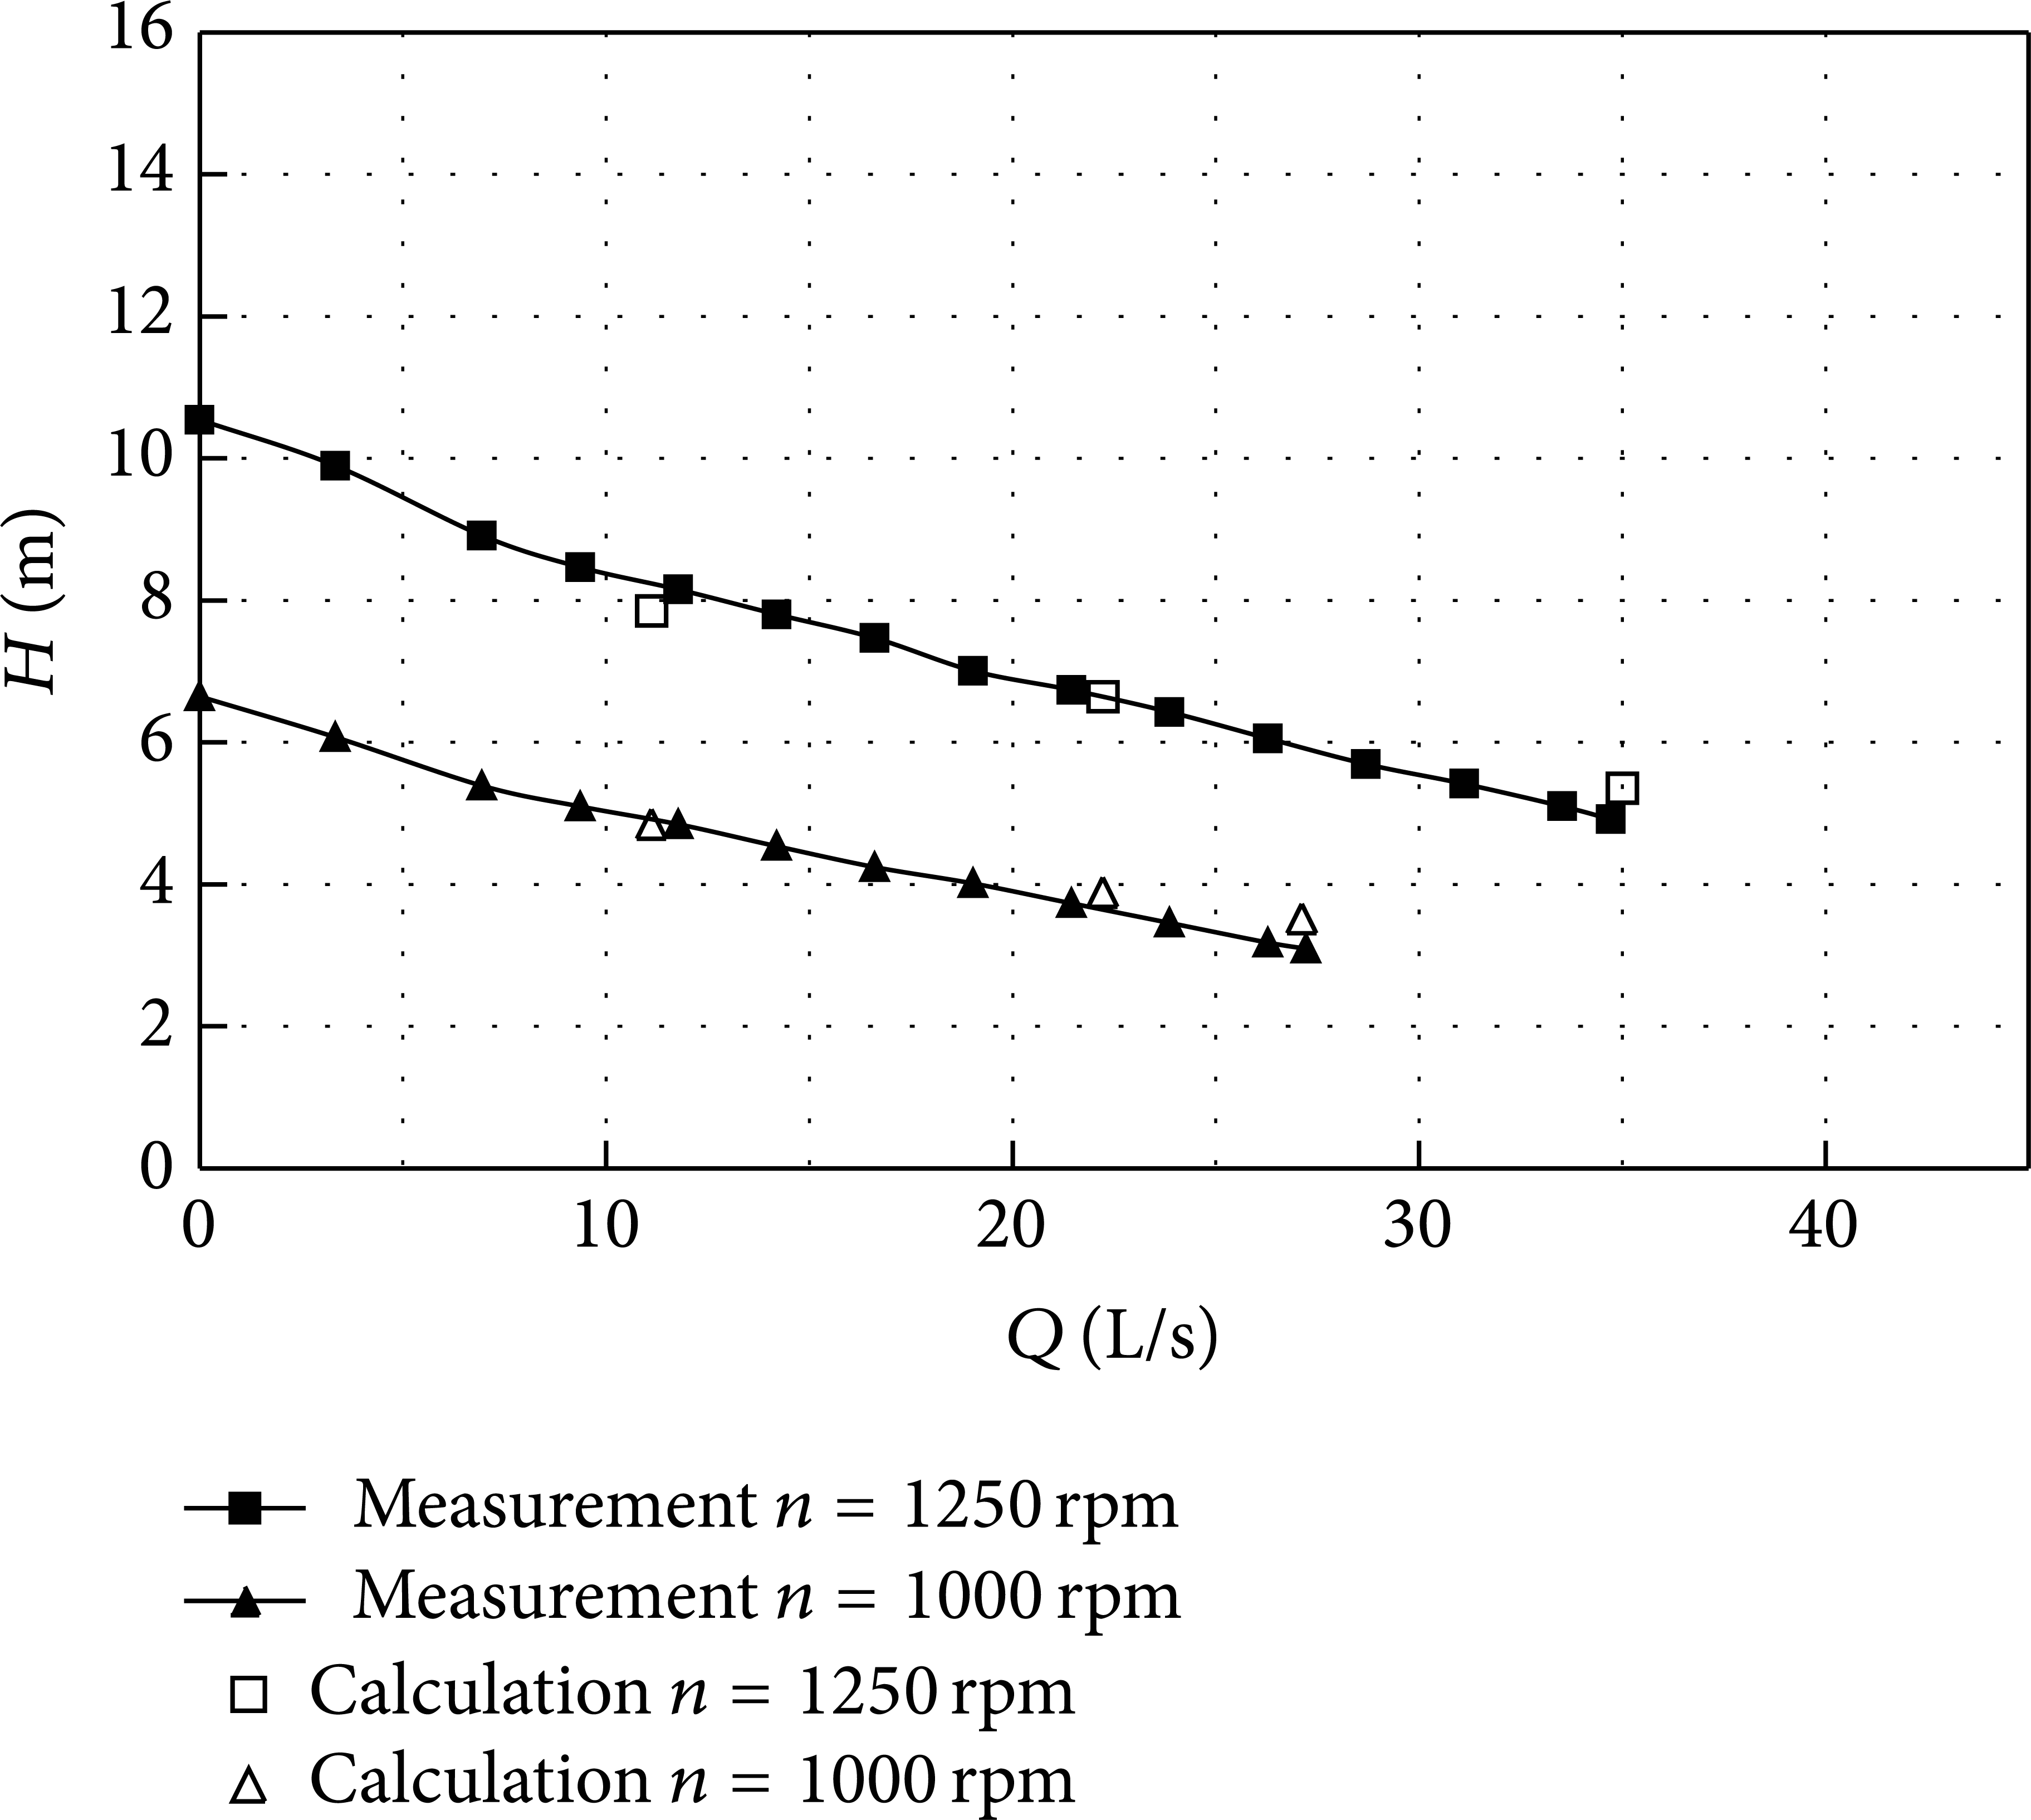
Head curves of the test pump for low rotating speed.

Comparisons of calculated and measured pressure for Q = 11 L/s, n = 1250 r/min.
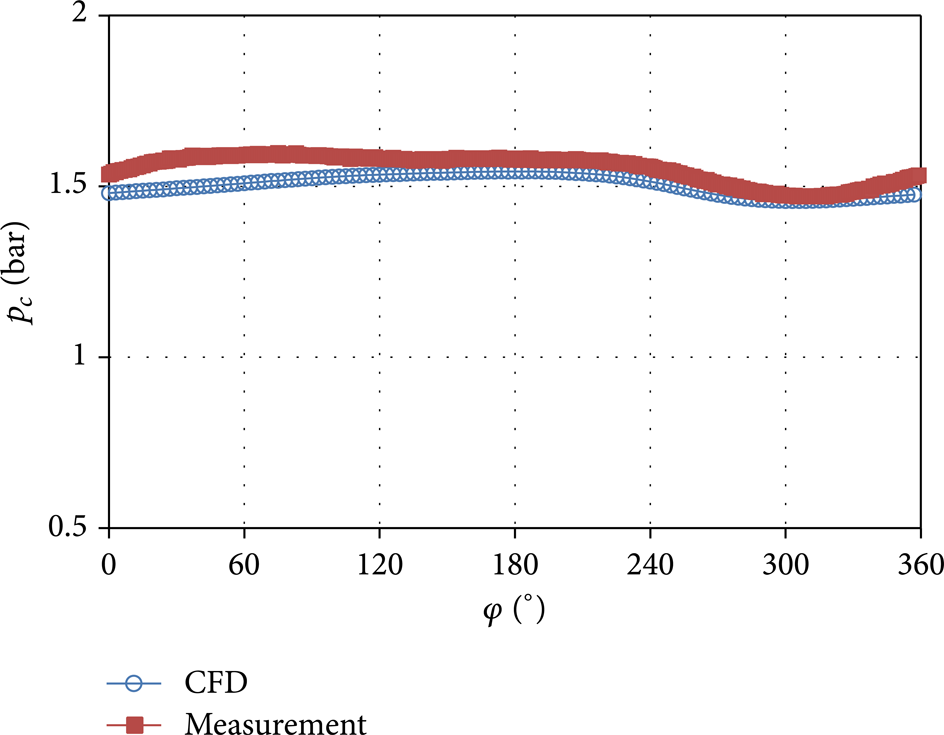
Comparisons of calculated and measured pressure for Q = 11 L/s, n = 1000 r/min.
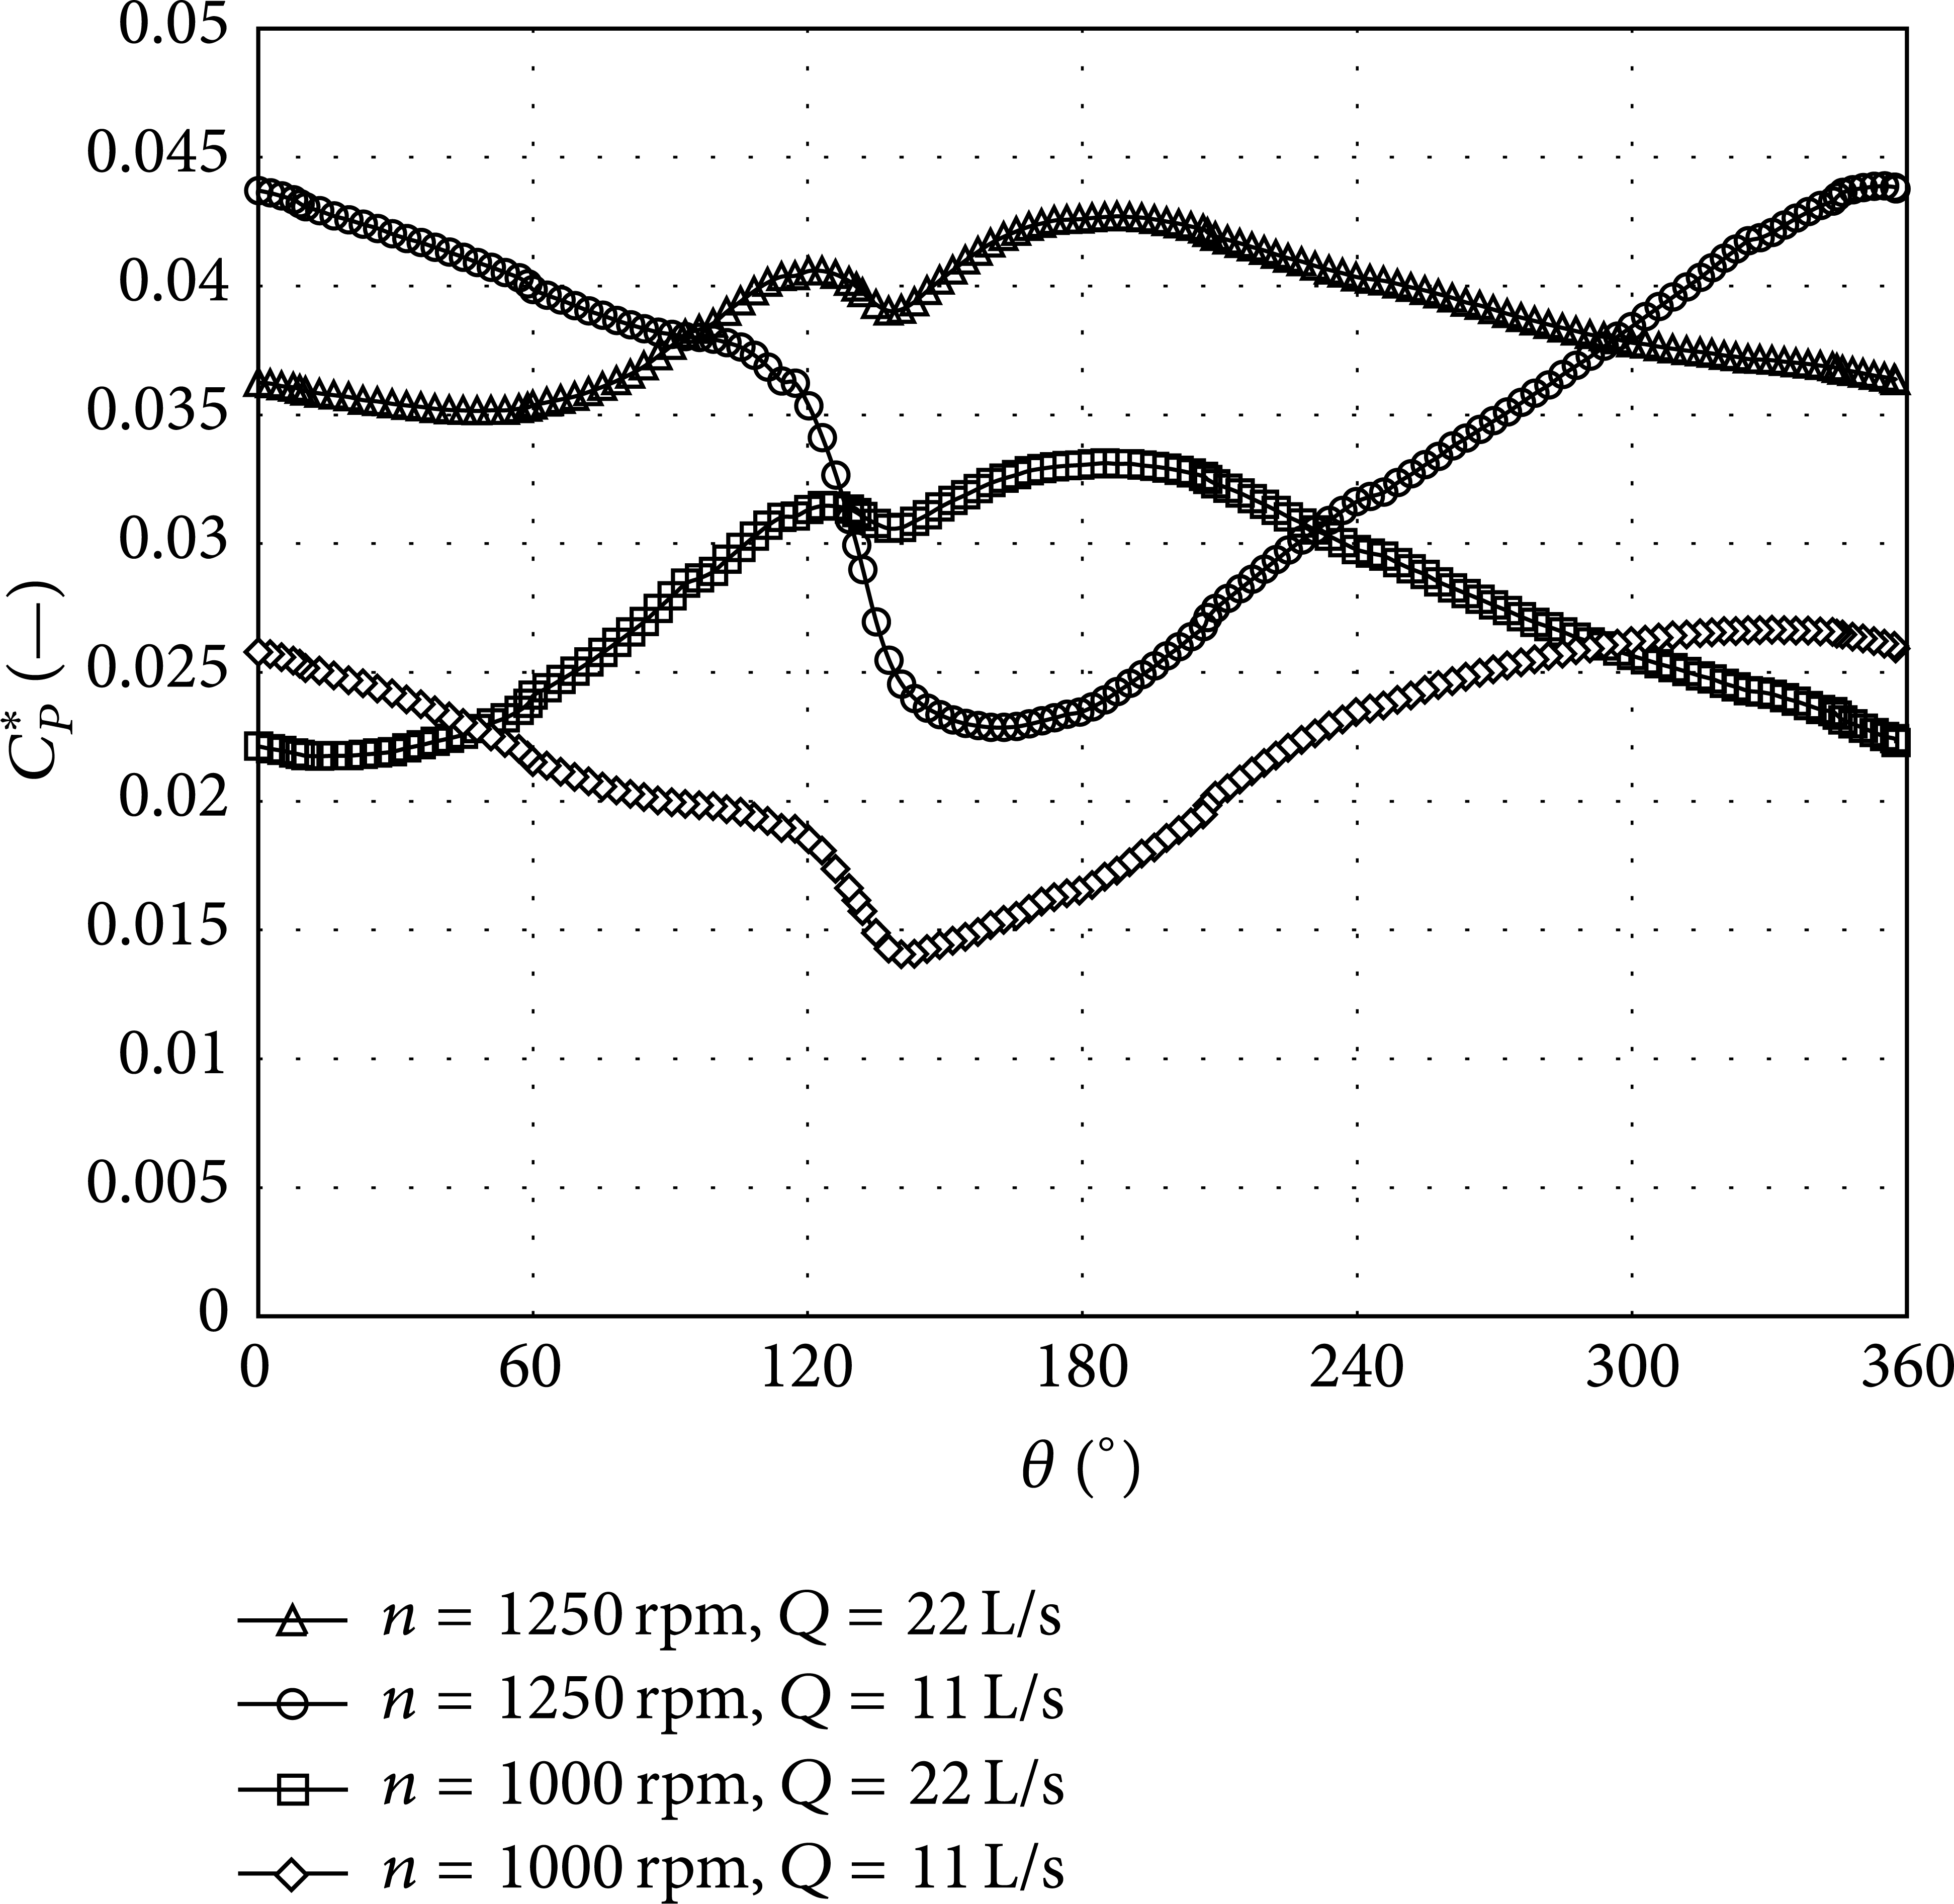
Pressure fluctuation intensity in the rotor domain can be observed for different flow rates with low rotating speeds in Figure 7. Large pressure fluctuation can be found near blade pressure side and corresponding impeller outlet area for every examined rotating speed and flow rate condition. The largest fluctuation intensity can be obtained for n = 1250 r/min, Q = 11 L/s condition near blade pressure side, and the flow rate can influence the fluctuation intensity distribution obviously for n = 1250 r/min. For n = 1000 r/min, the flow rate effect on fluctuation intensity is much weaker than for n = 1250 r/min. Figure 8 shows pressure fluctuation intensity distribution around blade surface at midspan for different flow rates and rotating speeds. Low pressure fluctuation can be clearly observed on blade suction side, which is smaller than 0.01. At the trailing edge of blade, obvious peaks can be found, and the biggest value is for n = 1250 r/min, Q = 11 L/s condition, which is bigger than 0.02. On the pressure side of the blade, stronger pressure fluctuation distribution can be observed more than that on suction side. The biggest value, which is about 0.06, can be found at the half of stream wise on the pressure side for n = 1250 r/min, Q = 11 L/s condition. For other conditions, the fluctuation intensity is smaller than 0.025. In addition, smaller difference between pressure fluctuation intensity values for Q = 11 L/s and Q = 22 L/s can be found for n = 1000 r/min, and the biggest difference can be obtained for n = 1250 r/min with the value of 0.05.

Pressure fluctuation intensity in the rotor domain at midspan, (a) n = 1250 r/min, Q = 22 L/s; (b) n = 1250 r/min, Q = 11 L/s; (c) n = 1000 r/min, Q = 22 L/s; (d) n = 1000 r/min, Q = 11 L/s.

Pressure fluctuation intensity around blade surface at midspan.
Figure 9 shows the pressure fluctuation intensity distribution in the volute domain at midspan for the flow rates with low impeller rotating speeds. Compared with the results under n = 1000 r/min condition, the fluctuation distributions under Q = 22 L/s and Q = 11 L/s conditions with n = 1250 r/min have stronger intensity. In addition, for the same flow rates with different rotating speeds, same intensity distribution law can be found. For example, for Q = 22 L/s conditions with n = 1000 r/min and n = 1250 r/min, stronger pressure fluctuation can be found near volute tongue area, while for Q = 11 L/s conditions with n = 1000 r/min and n = 1250 r/min; however, weaker pressure fluctuation can be obtained near the same area. This reserved distribution law can be also clearly seen from the pressure fluctuation intensity results on the circumference with r = 0.15 m in the volute domain at midspan shown in Figure 10. Obvious phase difference between the results for different flow rates can be observed with nearly 180°.

Pressure fluctuation intensity in the volute domain at midspan, (a) n = 1250 r/min, Q = 22 L/s; (b) n = 1250 r/min, Q = 11 L/s; (c) n = 1000 r/min, Q = 22 L/s; (d) n = 1000 r/min, Q = 11 L/s.
Pressure fluctuation intensity on the circumference in the volute domain at midspan (r = 0.15 m).
For analyzing the pressure fluctuation distribution in three-dimensional space, the pressure fluctuation intensity on the cylindrical surface close to the impeller outlet was obtained for each flow rate and rotating speed, shown in Figure 11. The results show that at the area close to the impeller outlet, the fluctuation intensity is weaker than at the area a little farther, because at the area close to the impeller outlet, the fluid has higher velocity, and velocity energy has not been transferred to pressure energy well, and the pressure fluctuation is not strong compared with the fluctuation in the volute. The fluctuation intensity distributions under Q = 22 L/s conditions with examined rotating speeds are weaker than under Q = 11 L/s conditions, and the strongest intensity can be found with n = 1250 r/min which locates from blade shroud to hub.

Pressure fluctuation intensity on the cylindrical surface close to the impeller outlet, (a) n = 1250 r/min, Q = 22 L/s; (b) n = 1250 r/min, Q = 11 L/s; (c) n = 1000 r/min, Q = 22 L/s; (d) n = 1000 r/min, Q = 11 L/s.
Figure 12 shows the comparison among pressure fluctuation intensity distributions on a flow channel section of the front side chamber for every rotating speed and flow rate. Obvious asymmetrical distributions can be observed, and relative strong intensity distributions can be found for Q = 11 L/s, while the strongest value can be seen for n = 1250 r/min with the values of 0.0567. Figure 13 shows the fluctuation intensity distributions on the section of the back side chamber channel for every rotating speed and flow rate, and asymmetrical distributions can be also found. The pressure fluctuation intensity in back side chamber is weaker than in front side chamber, and the strongest value is 0.0161, which can be found under Q = 11 L/s condition with n = 1250 r/min. In addition, the positions of fluctuation intensity are different in front and back side chamber channel.

Pressure fluctuation intensity on section A, (a) n = 1250 r/min, Q = 22 L/s; (b) n = 1250 r/min, Q = 11 L/s; (c) n = 1000 r/min, Q = 22 L/s; (d) n = 1000 r/min, Q = 11 L/s.

Pressure fluctuation intensity on section B, (a) n = 1250 r/min, Q = 22 L/s; (b) n = 1250 r/min, Q = 11 L/s; (c) n = 1000 r/min, Q = 22 L/s; (d) n = 1000 r/min, Q = 11 L/s.
4. Conclusions
In this paper, the three-dimensional unsteady pressure field has been investigated numerically by CFD calculation to evaluate the transient pressure variation in a single-blade pump running with low rotating speeds, because unsteady flow phenomenon, which has not been understood clearly for low impeller rotating speed, may also cause reliability problems in the pump and piping system. Numerical results have been verified by experimental works, of which both external characteristics and transient pressure measurement have been conducted. Based on the CFD results, the pressure fluctuation intensity was analyzed quantitatively by defining the standard deviation of the pressure fluctuation of a revolution period. The main conclusions are as follows.
Strong pressure fluctuation intensity in the low-speed single-blade pump impeller can be found near blade pressure side and corresponding impeller outlet area.
At the area close to the impeller outlet, the fluctuation intensity is weaker than at the area a little farther in the volute.
Obvious pressure fluctuation intensity distributions can be found in both front and back side chamber channels, and the intensity in back side chamber is weaker than in front side chamber.
In the next step, the estimation of unsteady pressure fluctuation in single-blade pumps should be conducted during the design process to complement the traditional design method to find the hydraulic solution to decrease the pressure unsteadiness and to increase the pump reliability under low rotating speed conditions.
Footnotes
Nomenclature
Conflict of Interests
The authors declare that they do not have any commercial or associative interest that represents a conflict of interests in connection with the work.
Acknowledgments
This work was supported by the National Natural Science Foundation of China (Grant no. 51239005, 51009072), the National Science & Technology Pillar Program of China (Grant no. 2011BAF14B04), and Research Foundation for Advanced Talents of Jiangsu University (Grant no. 13JDG084). The authors would also like to thank Professor F.-K. Benra and Dr. H. J. Dohmen from University of Duisburg-Essen in Germany for their kind help and for providing the model pump.