
Abstract
This research outlines the Taguchi optimization methodology, which is applied to optimize cutting parameters in drilling of AISI 1040 steel. The drilling parameters evaluated are cutting speed, feed rate, and helix angle. Series of experiments are conducted to relate the cutting parameters on the thrust force and torque. L27(313) orthogonal array, signal-to-noise ratio is employed to analyze the influence of these parameters on thrust force and torque during drilling. Analysis of variance (ANOVA) is used to study the effect of process parameters on machining process. The study shows that the Taguchi method is suitable to solve the stated problem with the minimum number of trials. The main objective is to find the important factors and combination of factors that influence the machining process to achieve low thrust force and torque. The analysis of the Taguchi method indicates that the feed rate is the most significant factor affecting the thrust force, while the cutting speed contributes the most to the torque.
1. Introduction
Metal cutting operations, such as drilling, turning, and milling, are widely used in manufacturing to produce a variety of mechanical components. Hole drilling is by far the most widely used process in manufacturing [1]. Conventional drilling with twist drill still remains one of the most economical and efficient machining processes for hole making as well as for riveting and fastening structural assemblies in the aerospace and automotive industries. Drilling operations are mainly dependent on the cutting parameters and drilling tools. The critical thrust force and torque at the onset of unproductiveness play the major role, and those are correlated with the process parameters. In addition, drilling problems can result in costly production because many drilling operations are usually among the final steps in fabricating a part. Among the scientific problems in drilling, determining the thrust force and torque for any drill geometry, especially the variation of helix angle, remains an issue. The understanding of parameter dependency on thrust force and torque can bring some strategic information to optimize the drilling operations. Therefore, it is necessary to understand the relationship among the various controllable parameters and to identify the important parameters that influence the quality of drilling. Moreover, it is necessary to optimize the cutting parameters to obtain an extended tool life and a better productivity, which are influenced by cutting thrust and torque [2–4].
In drilling process, the efficiency and the quality of the finished component are heavily dependent on the process, workpiece, and tool-related parameters employed while machining. Cutting speed, feed rate, and helix angle are drilling parameters that significantly affect the performance measures such as thrust force and torque [5–9]. The machining parameters are usually selected based on either the experience or the proposed guidelines of the manufacturers. This selection procedure does not lead to the optimal and economically effective use of the machines and the quality of the surface generated. Sometimes, scientific methods based on Taguchi orthogonal array are used. The objective of the Taguchi robust design is to determine the optimal process parametric settings for a given set of independent parameters and a response variable [10]. This method can analyze and provide optimum parameters for a given set of independent parameters and a response variable. If there are multiple response variables for the same set of independent variables, the methodology provides a different set of optimum operating conditions for each response variable [11]. Many researchers have been focused on determining the best drilling conditions and several numerical and experimental techniques have been developed and used in the past decade. Some of these studies are mentioned below.
The studies carried out by Strenkowski et al. [5] had described a three-dimensional drilling model for determining the thrust force and torque in drilling. Their model was based on representing the drill point geometry as a series of oblique sections. The model is applicable to general drill geometries, as characterized by the point and flute geometry, under different workpiece material and cutting conditions.
To analyze their action, Tsao and Hocheng [6] developed a new device to solve the problems of relative motion and chip removal between the outer and inner drills in drilling. In addition, this study investigates the influence of drilling parameters (cutting velocity ratio, feed rate, stretch, inner drill type, and inner drill diameter) on thrust force of compound core-special drills. Their experimental results show that the cutting velocity ratio, feed rate, and inner drill type are the most important variables among the five control factors that influence the thrust force.
Cutting variables and tool geometries in drilling process have great influence on the thrust force and torque and hence on the quality of the machined holes. Low feeds in some cases improve the surface roughness due to the reduction of thrust force. In other cases, drilling at lower feeds and high speed leads to increased generated temperature [12, 13]. On the other hand, Khashaba et al. [14] investigated the influence of drilling and material variables on thrust force and torque. Their experimental results show that the presence of sand filler in continuous-winding composites not only raised the values of cutting forces and push-out delamination but also increased their values with increasing cutting speed.
Khashaba et al. [15] investigated the effects of the drilling parameters, speed and feed, on the required cutting forces, torques, and delamination that occur at drill entrance and exit in drilling composites with different fiber volume fractions. No clear effect of the cutting speed on the delamination size is observed, while the delamination size decreases with decreasing the feed.
Palanikumar [9] presents an effective approach for the optimization of drilling parameters with multiple performance characteristics based on Taguch's method with grey relational analysis. The drilling parameters such as spindle speed and feed rate are optimized with consideration of multiple performance characteristics, such as thrust force, workpiece surface roughness, and delamination factor.
Also Palanikumar et al. [16] studied the evaluation of delamination in drilling using HSS twist drill and 4-flute cutter. Empirical models were developed by Taguchi and ANOVA for the prediction of delamination factor in drilling process.
A statistical analysis of finish surface and hole diameter accuracy was performed by Kurt et al. [7]. They investigated the influence of cutting speeds, feed rates, depths of drilling, and different drilling tools with a 118° point angle. In their study, orthogonal array of Taguchi, the signal-to-noise (S/N) ratio, the analysis of variance (ANOVA), and regression analyses are employed to find the optimal levels and to analyze the effect of the drilling parameters on surface finish and hole diameter accuracy values.
Finally Kıvak et al. [17] focus on the optimization of drilling parameters using the Taguchi technique to obtain minimum surface roughness and thrust force. A number of drilling experiments were conducted using the L16 orthogonal array on a CNC vertical machining centre. The experiments were performed on AISI 316 stainless steel blocks using uncoated and coated M35 HSS twist drills under dry cutting conditions. Analysis of variance (ANOVA) was employed to determine the most significant control factors affecting the surface roughness and thrust force. The cutting tool, cutting speed, and feed rate were selected as control factors.
The review of literatures, which had been presented above, provides the scope for the researchers to study the multiple performance optimization of machining parameters and drill point geometry on hole diameter accuracy, delamination factor, surface roughness, burr height, and tool wear in the drilling. From the previous work available on the machining of different types of composites and steels, adequate investigations have not been carried out to study the effect of cutting parameters on thrust force and torque during machining of AISI 1040 steel.
In this study, Taguchi and ANOVA techniques were composed to analyze the influence of input variables (cutting speed, feed rate, and helix angle) over response (thrust force and torque) for process optimization in drilling using twist drills. The present work begins with the experimental plan and procedure followed by the Taguchi analysis of the observed data. Then, the ANOVA have been performed to examine the most significant factor which affects the drilling process in the drilling of AISI 1040 steel, having a widespread industrial use.
1.1. Insights for Practitioners
This research will be of great benefit for future applications, especially as introduced in a real-world application, such as a manufacturing plant. Additionally, studying with wider varieties of materials, process variations, and cutting tools will demonstrate usefulness in more applications. Bringing more realistic and applicable examples of Taguchi methodology to light should be a goal of all researchers in this area.
It is also advantageous to perform studies similar to this in academia as class learning exercises. By practising Taguchi methodology projects, one can gain experience and knowledge in industrial design of experiments and statistics, as well as the in-depth study of manufacturing processes. Furthermore, just as is found in a production environment, this provides an efficient project in an academic environment as well.
2. Experimental Procedure
The material used throughout this work was AISI 1040 steel that was heat treated before testing. It was hardened to 35 HRC, and then normalization was made at 900°C for the homogeneity of material.
The drilling experiments were carried out on a milling machine (TEZSAN M20MS) using HSS twist drills with 3.2 mm web thickness and 10 mm in diameter at three different helix angles and point angle is constant. Figure 1 shows the conceptual shape of the HSS twist drill.

Geometry of twist drill.
The thrust force and torque were measured using a two-component dynamometer (Kistler 9257BA) that was connected to PC via a charge amplifier (Advantech ADAM 3016), a condition board (Advantech PCLD 8712), and a data acquisition card (Advantech PCI 1712). For data acquisition, graphical showing and mathematical processing of force and torque signals were controlled and recorded with the software PCLS-ADAMView32. The geometry of the chisel edge and the lip was modified with sharpening to reduce thrust force and torque during drilling. Geometrical parameters of drill and drilling parameters used in the tests were given in Table 1. The drilling depth on the specimens was kept constant as 30 mm since drilling length should be three times the drill diameter or less than that. Drill bits were sharpened by each drilling test identically such as point angle, clearance angle, and concentricity of chisel edge, which must be within tolerance and coincide right and left.
Geometrical data of drill and drilling parameters.

2.1. Drilling Test Setup
The test samples were fixed by a workpiece holder on dynamometer and the thrust force and torque signals obtained from the two-component drilling dynamometer were transferred to data acquisition card in a PC via a charge amplifier for evaluation. The experimental set-up is shown schematically in Figure 2.

Schematic layout of experimental set-up for thrust force and torque measurement.
3. Results and Discussion
The drilling tests were carried out using twist drills in three helix angles at cutting speeds and feed rates in three levels. In general, the thrust and torque parameters will mainly depend on the manufacturing conditions employed, such as feed, cutting speed, tool geometry, machine tool, and cutting tool rigidity. The effect of cutting parameters and the drill geometry on thrust force and torque produced was investigated.
3.1. Experimental Design Based on Taguchi Method
Prior to the coming out of Taguchi methods, factorial design of experiments was employed to investigate all the possible combinations of factors that can machine the highest quality product at certain costs. When there is a large number of factors, the factorial design approach faces four major drawbacks; namely, [18] (1) it would be costly and time consuming to perform all the experiments; (2) completely different results may be obtained from two designs of the same experiment; (3) contribution of each parameter cannot be determined; and (4) results may be difficult to be interpreted. The Taguchi method was developed to overcome these limitations by providing a systematic approach to the design of experiments. The Taguchi method makes use of a special design of orthogonal array to examine the quality characteristics through a minimal number of experiments. An orthogonal array is abbreviated as L N , where the subscript N refers to the number of trials that need to be run for a given experiment. To be more descriptive, the numbers of levels and factors are included in a parenthesis next to the abbreviation of the orthogonal array [19].
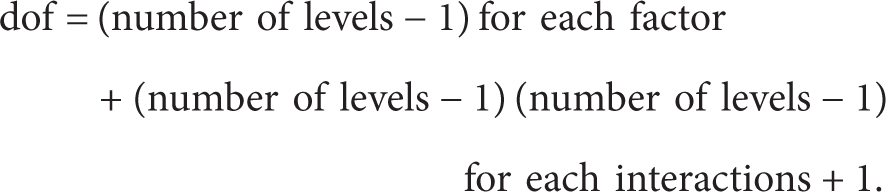
An orthogonal array can be chosen based on the total degrees of freedom (dof) required for an experiment. Dof related to a process can be calculated for each factor and each interaction as follows [20]:
In this study, with three factors at three levels each, the fractional factorial design used is a standard L27(313) orthogonal array [21]. Each row of the matrix represents one trial. The three levels of each factor are represented by a “1,” a “2,” or a “3” in the matrix. Cutting speed, feed rate, and helix angle factors are arranged in columns 1, 2, and 5, respectively, in the standard L27(313) orthogonal array (see Table 9).
The experimental design consists of 27 trials (each row in the L27(313) orthogonal array) and the columns of the orthogonal array are assigned to factors and their responses (Table 2). The corresponding linear graph is shown in Figure 3. In the linear graph, lines are used to connect interacting factors together. Each point in the linear graph represents a column within the orthogonal array. Figure 3 shows that factor v is connected to factors f and γ. The number in parenthesis shown in Figure 3 indicates the column used for estimating the effect of a factor. For example, column 3 is used for the estimation of the effect of interaction between factors v and f. Thus, column 3 should not be assigned to any other factor. It has a “nil” value as shown in Table 9. It is thus much easier to assign each factor and its interactions to the various columns of an orthogonal array using a linear graph.
Experimental design using L27(313) orthogonal array with coded factors and responses.


A linear graph of L27(313) orthogonal array.
3.2. Signal-to-Noise Ratio (S/N) Analysis
In this section, significance of controllable factors was investigated using signal-to-noise ratio (S/N) approach. Since it is required that the thrust force and torque errors should be minimum, “smaller is better” type of S/N was selected for this analysis. A small value of S/N in a particular run indicates the minimum effects of noise factors on the outputs. The S/N values for each run are calculated using
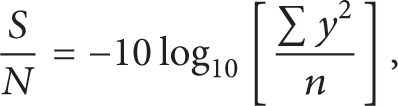
where n is the number of measurements and y the measured characteristic value. The unit of S/N ratio is decibel. Regardless of the category of the performance characteristics, a greater n value corresponds to a better performance. Therefore, the optimal level of the machining parameters is the level with the greatest n value.
Taguchi recommends analyzing the means and S/N ratio using conceptual approach that involves graphing the effects and visually identifying the factors that appear to be significant, thus making the analysis simple. Analysis of the influence of each control factor on the thrust force and torque was performed using signal-to-noise ratio response table. Response tables of S/N ratio thrust force and torque are shown in Tables 3 and 4. This table was created by calculating an average S/N value for each factor. The higher the difference between the minimum and the maximum S/N ratios in each factor, the higher the effect on thrust force and torque.
Response table for thrust force for signal-to-noise ratios: smaller is better.
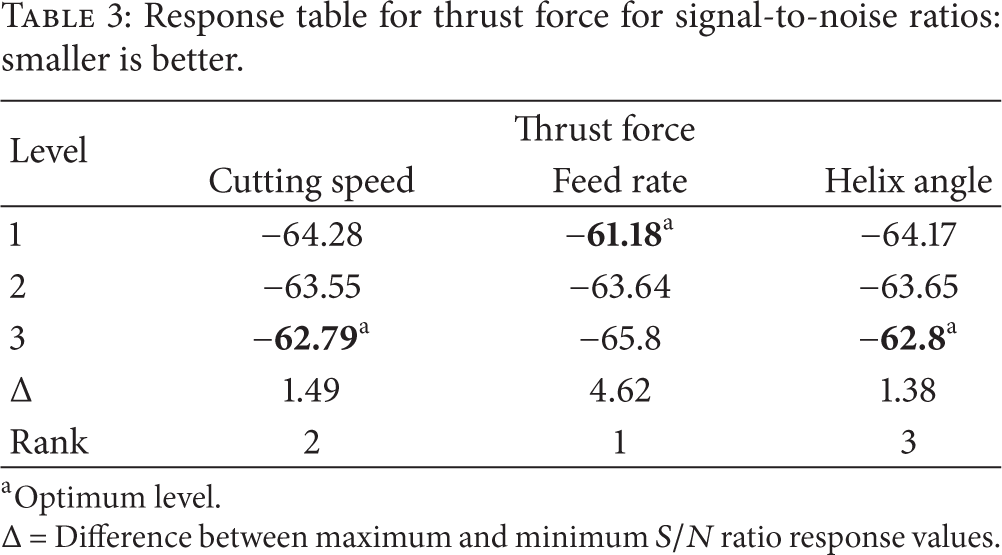
Δ = Difference between maximum and minimum S/N ratio response values.
Response table for torque for signal-to-noise ratios: smaller is better.

Δ = Difference between maximum and minimum S/N ratio response values.
The response table includes ranks based on Delta (Δ) statistics, which compare the relative magnitude of effects. The Delta statistic is the highest average for each factor minus the lowest average for the same. Ranks are assigned based on Delta values; rank 1 is assigned to the highest Delta value, rank 2 to the second highest Delta value, and so on.
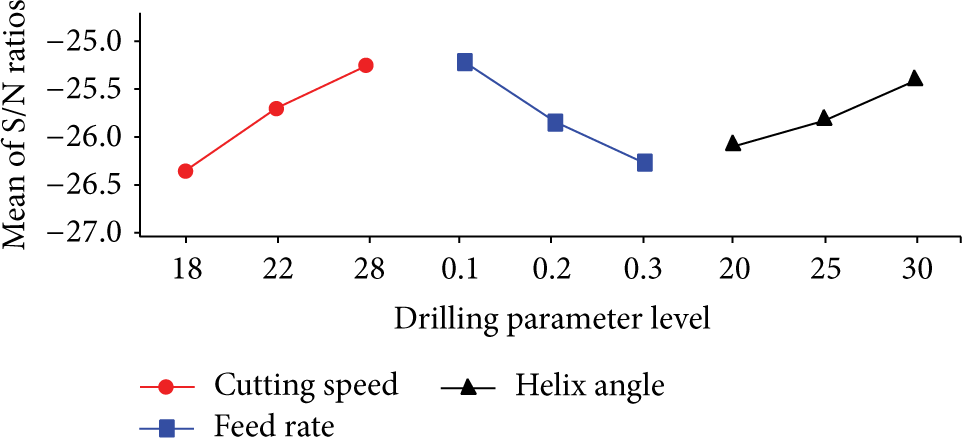
The S/N response graph for thrust force and torque is shown in Figures 4 and 5, respectively. The optimum process design is achieved when the S/N ratio is maximized. The slope of the main effect line is proportional to the size of the effect, and the direction of the curve specifies a positive or a negative influence of the effect [22, 23]. Therefore, as shown in Figure 4, the feed rate is more significant for thrust force and the next was the cutting speed and helix angle, respectively. The highest feed rate appears to be the best choice in order to achieve low value of thrust force. Hence, based on Table 3 and Figure 4, the cutting speed level 3 (28 mm/min), the feed rate level 1 (0.1 mm/rev), and the helix angle level 3 (30°) are the optimal combination to achieve low value of thrust force.
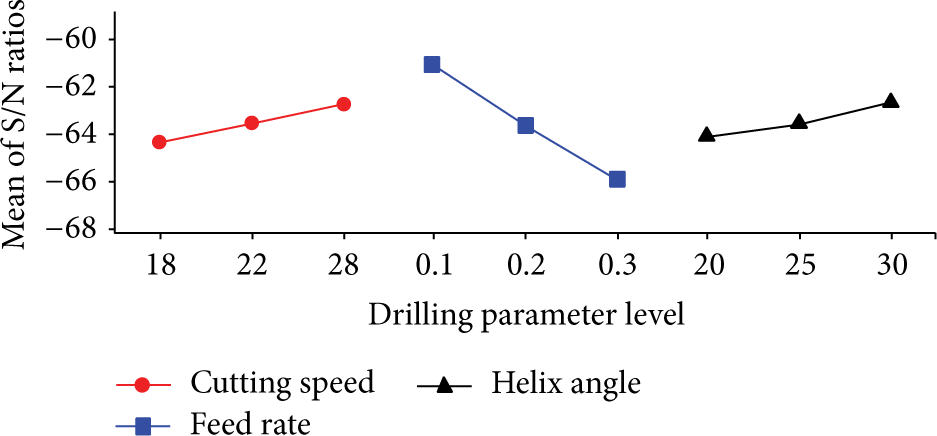
Main effects plot for thrust force (signal-to-noise: smaller is better).
Main effects plot for torque (signal-to-noise: smaller is better).
Figure 5 shows the optimal combination levels of machining parameters for minimum torque. According to Table 4 and Figure 5, the cutting speed and feed rate have the same effects on the torque as helix angle. Similarly, the optimum parameters for the minimum torque are cutting speed level 3 (28 mm/min), the feed rate level 1 (0.1 mm/rev), and the helix angle level 3 (30°).
3.3. Analysis of Variance (ANOVA)
ANOVA is a method most widely used for determining significant parameters on response and measuring their effects. In ANOVA, the ratio between the variance of the process parameter and the error variance known as F-test determines whether the parameter has significant effect on the quality characteristic. This process is carried out by comparing the F-test value of the parameter with the standard F table value (F0.05) at the 5% significance level. If the F-test value is greater than F0.05, small P value, the process parameter is considered significant.
The ANOVA results are illustrated for thrust force and torque in Tables 6 and 7, respectively. The last column of ANOVA tables indicates the percentage contribution (significance rate) of each process parameter. According to Table 5, feed rate (82%) has the most dominant effect on total variation for thrust force and it is followed by cutting speed (8%), helix angle (7%), cutting speed-feed rate (1%), and cutting speed-helix angle (0.4%) factors and interactions. The other interaction of feed rate-helix angle has not been found statistically significant. The predicted R2 (0.999) is in reasonable agreement with the adjusted R2 (0.995). Adequate precision measures the S/N ratio.
Analysis of variance for S/N ratios (thrust force).

Analysis of variance for S/N ratios (torque).

The explanation of 3D surface graphics for thrust force.

On the other hand, Table 6 shows that cutting speed (42%) was found to be the major factor affecting the torque and it is followed by feed rate (38%) and helix angle (16%) factors. The predicted R2 (0.992) is in reasonable agreement with the adjusted R2 (0.974). Adequate precision measures the S/N ratio.
ANOVA results indicated that interaction effect of feed rate-helix angle from Table 5 and all interactions of parameters from Table 6 are statistically insignificant. However, their interaction plots clearly display that these interactions has an effect on thrust force and torque (see Figures 6 and 7).

Interaction plots for thrust force.

Interaction plot for torque.
Figures 6 and 7 illustrate the interaction plots for different S/N ratios for thrust force and torque. In the main effect plot, if the line for a particular parameter is near horizontal, then the parameter has no significant effect. On the other hand, a parameter for which the line has the highest inclination will have the most significant effect. As far as the interaction plots are concerned, estimating an interaction means determining the nonparallelism of parameter effects. Thus, if the lines on the interaction plots are nonparallel, interaction occurs and if the lines cross, strong interaction occurs between parameters [24]. It can be seen that there is a strong interaction between the parameters’ cutting speed and feed rate while there is moderate interaction between the parameters’ feed rate and helix angle and between helix angle and cutting speed. Also, it can be inferred from Figure 6 that the feed rate-helix angle interaction plots show that the lowest level of thrust force is achieved at minimum level of feed rate (0.1 mm/rev) with maximum level of helix angle (30°), maximum level of cutting speed (28 mm/min) with minimum level of feed rate (0.1 mm/rev), and maximum level of cutting speed (28 mm/min) with maximum level of helix angle (30°). It is interesting to note that optimal settings of parameters for thrust force and torque are quite different and pose difficulty to achieve the goals of all objectives.
Similarly, Figure 7 interaction plot reveals that the lowest level of torque is achieved at minimum level of feed rate (0.1 mm/rev) with maximum level of helix angle (30°), maximum level of cutting speed (28 mm/min) with minimum level of feed rate (0.1 mm/rev), and maximum level of cutting speed (28 mm/min) with maximum level of helix angle (30°).
Plots were drawn for visualization of normal probability plot of residuals and predicted response surface. The normal probability plots of the residuals for thrust force and torque are shown in Figures 8 and 9, respectively. A check on the plots in Figures 8 and 9 revealed that the residuals generally fall on a straight line implying that the errors are normally distributed. That was expected. This result was also mentioned by various researchers [25, 26].

Normal probability plot of residuals for thrust force.
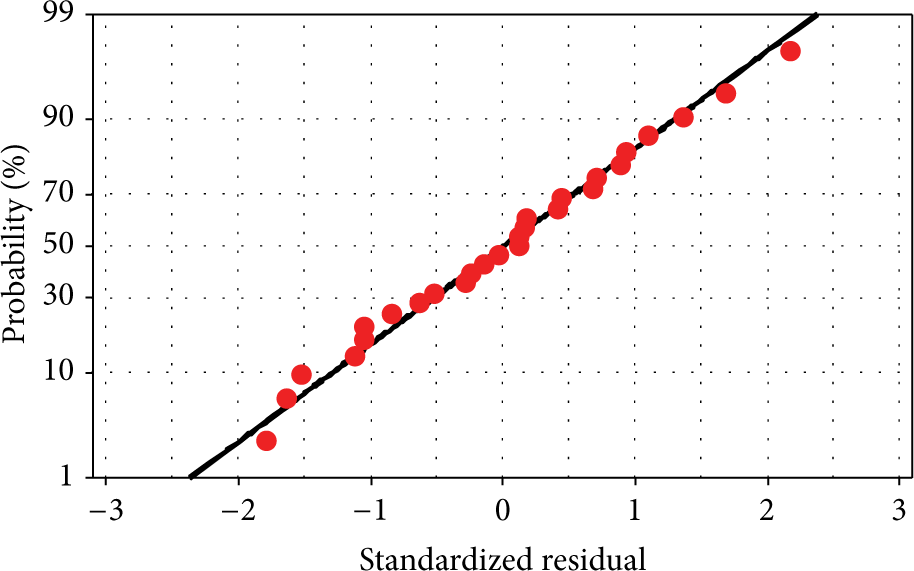
Normal probability plot of residuals for torque.
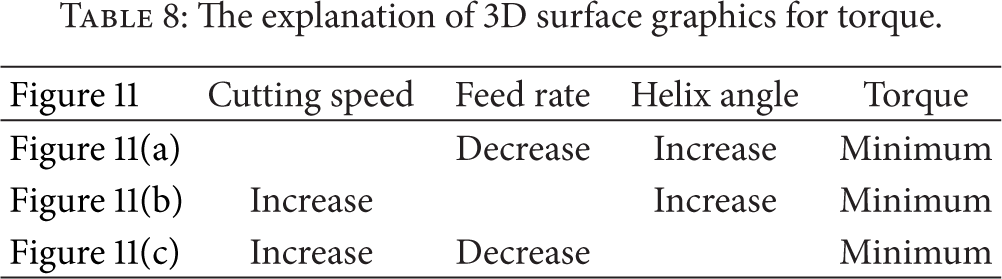
The 3D surface graphs for thrust force and torque are shown in Figures 10 and 11, while two varying parameters by keeping the other parameters at middle level.

Predicted response surface of thrust force versus helix angle, cutting speed, and feed rate.

Predicted response surface of torque versus helix angle, cutting speed, and feed rate.
For getting required thrust force and torque what cutting parameters are to be selected can be best judge from Figures 10 and 11 and Tables 7 and 8.
The explanation of 3D surface graphics for torque.
L27(313) Standard orthogonal array.

4. Conclusions
In this study, statistically designed experiments based on Taguchi methods were performed using L27(313) orthogonal array to analyze the thrust force and torque as response variables, respectively. Conceptual S/N ratios and ANOVA approaches for data analysis drew similar conclusions.
The cutting speed level 3 (28 mm/min), the feed rate level 1 (0.1 mm/rev), and the helix angle level 3 (30°) are the optimum cutting conditions to achieve low value of thrust force using the response table for S/N ratio. The result of ANOVA indicates that the experimental data are well correlated with the predicted data at 95% confidence interval; hence, this technique can be very much useful for a reliable prediction of different performances. According to ANOVA results, the most significant factors affecting the thrust force and torque are the feed rate (82%) and cutting speed (42%), respectively. It can be inferred from the interaction plots to thrust force and torque that the interaction between the parameters also has an effect on thrust force and torque. The interaction observed is more at high cutting speed (28 m/min), low feed rate (0.1 m/rev), and high helix angle (30°). 3D surface graph (Figures 10 and 11) and its Tables 7 and 8 show that the decreased helix angle and increased feed rate increase thrust force and torque. Also, decreased helix angle and cutting speed increase thrust force and torque and vice versa. Eventually, decreased cutting speed and increased feed rate increase thrust force and torque. By applying proper parameters, the responses can be controlled. The accuracy can be improved by including more number of parameters (different point angles, flute number, and so on) and levels.
Conflict of Interests
The author declares that there is no conflict of interests regarding the publication of this paper.