
Abstract
To design an efficient feeder bus route network and develop a better integrated intermodal system, it is necessary to study travelers' mode choice behavior. This paper focuses on the transfer behavior model between bus transit and urban rail. Based on the theory of Binary logit (BL) model, a new generalized travel cost model (GTC) which considers the influencing factors including travel distance, travel cost, and transfer time is established, and the choice model of bus and urban rail with the influence of transfer behavior is built. Then, a deeper analyzing process is conducted to get the significance of the model. In addition, the accuracy and feasibility of the model are verified through using the real survey data. Finally, according to the model results, some countermeasures consisting of improving the transfer condition and optimizing price charging pattern are given to promote a better public transportation system.
1. Introduction
With the rapid popularization in large cities in China, it is important to construct an ideal urban public transportation system which includes both urban rail and bus to overcome the traffic congestion problem. Usually, urban rail plays a leading role in passenger transport for its advantages of large capacity, high speed, punctuality, and efficiency. But bus transit is also necessary for its advantages in the short-distance trips.
In an ideal passenger transportation system, urban rail lines serve as a highly efficient and convenient mode of transport which is able to carry high volumes of passengers to and from the city, while the feeder bus routes serve to transport passengers from the bus stops to the rail network. This ideal transportation system should include a better integrated intermodal system, which can lead to a reduction of operating costs and an increase in revenues through maintaining shorter routes and eliminating duplicated routes by the rail and the bus, as well as a higher service quality and satisfaction level of passengers resulting from better coverage and shorter travel times with minimal delay.
The main challenge of constructing this ideal passenger transportation system is to design an efficient feeder bus route network to integrate and coordinate the bus and urban rail services. In order to improve the quantity and efficiency of transfer behavior between bus and urban rail, it is important to do research on the passengers' choices of transfer behavior.
As the mode choice behavior and its influencing factors are difficult to indicate, this paper aims to reveal the choice laws of transfer travel mode between bus and urban rail. Based on the theoretical results, this paper can optimize the operation performance of the intermodal system and improve the split rate of public traffic.
2. Literature Review
In China, studies on the transfer behavior between bus and urban rail often focused on the passenger flow data. For example, based on the questionnaire survey data of passengers on Beijing Line 5 urban rail, Zheng got the transfer mode choice laws of public passengers in arriving or leaving the urban rail system and obtained the spatial distribution laws of passenger flow [1]. According to the survey data of passenger flow, Bai et al. established a trip mode choice model based on prospect theories and analyzed the psychological interaction of passengers traveling and transfer behavior [2].
In addition, feeder bus demand forecasting also was an important research problem in the past few years. Cayford and Yim surveyed the customers' demand for feeder bus for the city of Millbrae, California. They also designed and implemented an automated system used for the feeder services [3]. Khattak and Yim explored the demand for a consumer oriented personalized feeder bus service in the San Francisco Bay Area. About 60% of those surveyed were willing to consider feeder bus as an option, and about 12% reported that they were “very likely” to use feeder bus [4]. Another work specifically on the feeder bus demand forecasting was proposed by Quadrifoglio and Li [5]. By employing continuous approximations, the authors derived handy but powerful closed-form expressions to estimate the critical demand densities, representing the switching point between the competing operating policies. In addition, analytical modeling and/or simulation have often been used to analyze feeder transit services [6].
Despite this renewed attention for transfer behavior demand forecasting, feeder bus route design became a hot topic in recent times. The transit network design is a complex nonconvex problem [7]. Chien and Yang dealt with an alternative methodology for solving feeder bus route design problem in a typical urban irregularly shaped service area, based on a model for finding just the optimal bus route location and its operating headway [8]. Differently from Chien and Yang research, the work proposed by Jerby and Ceder aimed not only to the definition of a methodology for a single feeder bus route design but also to an entire feeder bus network planning [9]. In addition, on the basis of transfer behavior analysis, feeder bus network design problem was generated and developed, which was named FBNDP by the scholars [10–13]. They defined the FBNDP using a mathematical programming model. In the model, the route structure and the operating frequency are being optimized with the objective function of minimizing the sum of passenger and operator costs. Other works showed that transfer time, distance, and cost are all the important factors for the transfer behavior and feeder bus network optimization [14].
Accordingly, the objective of this study is to build a theoretical model to evaluate the impact of transfer time, travel distance, and travel cost on passengers' transfer behavior. In detail, through the quantitative analysis of choice characters of transfer behavior between bus and urban rail, this paper will take comprehensive consideration of three main factors including travel distance, travel cost, and transfer time, to establish general choice model of transferring between bus and urban rail and analyze the sensitivity of these influencing factors.
3. Methodology
3.1. Bus and Urban Rail Transfer Behavior
According to the diffident locations of passenger's trip origins (O) and destinations (D) (on the urban rail line or in the coverage of urban rail service), public transport passengers have three kinds of trip chains to choose. The structure and characteristics of the three trip chains are shown in Table 1.
Different trip chains of passengers with different origins and destinations.

Note: transfer mode means passengers transfer from bus to rail (or from rail to bus) in their trips.
As shown in Table 1, in the first trip chain, most passengers will choose urban rail because of its advantages of rapidity, punctuality, and convenience. According to the survey data from the city of Beijing, Harbin, and Nanjing, the walking distance coverage of urban rail is 862 m, 740 m, and 904 m, respectively [2]. Based on the existing research, the walking distance coverage of urban rail is determined as 900 m in this paper. In the third trip chain, the passengers may travel by transfer twicely between bus and urban rail or bus-only. Take the influencing effect of transferring, most of the passengers may choose travel by bus-only.
When the passengers in the second trip chain choose the transfer mode or bus-only mode, they need to consider the factors including trip distance, transfer cost, and transfer time. So the second trip chain is the most attractive point which deserves a detailed research. In addition, before the urban rail network has developed largely, the rail stations could not cover most of the traffic zones. And this is a common phenomenon in most large cities in China. In this period, the distance between trip origin of the passengers and the urban rail station is long (hard to reach by walking). The passengers should think about whether to travel by bus or take the transfer mode between bus and urban rail. Besides, the phenomenon of transferring in twice also exists in some cities. However, limited by the paper length, we will only analyze the behavior of transferring between bus and urban rail.
It is assumed that passengers travel from the origin (i) to destination (j) using public transport mode: there are bus line, and partly urban rail line. The route of transfer between bus and urban bus mode and rail only is shown in Figure 1. In this situation, different trip distance and price policy would affect the trip mode choice. So the factors of trip distance and price policy can be regarded as the important indicators to evaluate the integrated conditions of bus and urban rail.

Schematic diagram of bus-only mode and transfer mode between bus and urban rail.
L indicates the total travel distance from i to j. As the position of h changes, the distance between L ih and L hj will change and the passengers' selection probability of choice between the bus-only mode and transfer mode may change as well. The choice of trip mode is individual behavior, so the discrete model is applied to simulate the behavior of passenger selection. Of all the discrete choice models, Logit Model is the most extensive developed nowadays. In this model, all the user selections can be assumed in the same stratum, and there is no topology relationship between any selections [15]. Because there are no topology relationships in the choice of passengers' transfer selection, the Logit Model is suitable in this paper.
In the Logit Model, the two modes of “transfer” mode and “bus-only” mode are the alternative parts, while function related to the transfer time, travel distance, and travel cost is utility function. To build the discrete choice models of the two public transport modes, the parameters are calibrated by the survey data.
3.2. The Basic Model of Bus and Urban Rail Transfer Behavior Choice
According to the Binary logit (BL) model, the probability of bus and urban rail transfer behavior can be shown as follows:

And the probability of bus-only mode choice is

So the trip amount of transfer mode between bus and urban rail from i to j can be expressed as

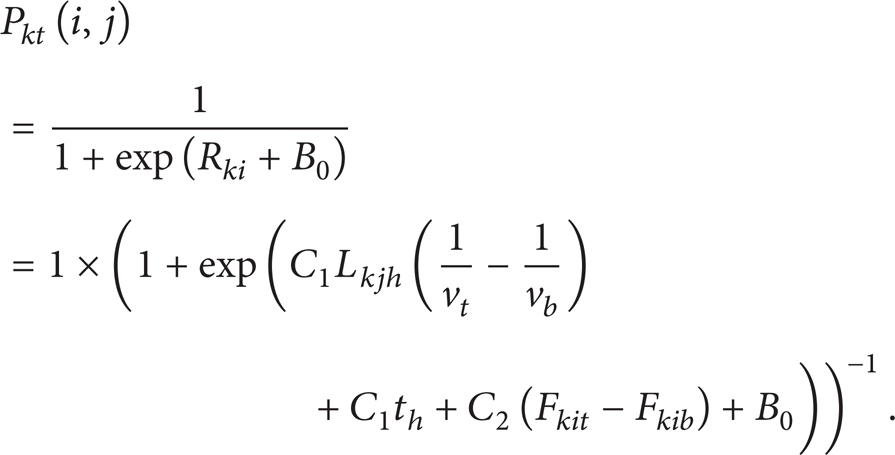
where P kt (i, j) is the probability of transfer mode choice from i to j on the effective public transit route k, R ki is the difference travel cost amount between the two modes, B0 is the constant, which can include both the time and cost factor, P kb (i, j) is the probability of the bus-only trips from i to j on the effective public transit route k, V kt (i, j) is the trip amount of transferring between bus and urban rail, and V od (i, j) is the total trip amount from i to j of the two modes, including the transfer mode and bus-only mode, which can be obtained from the bus OD backstepping technology by integrating the survey data of resident trips in recent years [16].
4. Bus and Urban Rail Transfer Mode Choice Model (BRMCM)
4.1. Utility Function Based on Generalized Travel Cost (GTC)
In order to build the BL model, the form of utility function is analyzed firstly. Trip cost is the most important factor when passengers choose trip mode. In the study, trip cost is described by a GTC function which can present the time and money cost. And in the BL model, GTC function is used as the utility function.
Trip cost may have two meanings. The trip cost usually means the money paid for trip from origin to destination. In fact, the basic factors considered by passengers include waiting time, quickness, travel time, safety, and comfort. For these needs, travel time is especially meaningful. At this situation, the cost can be named GTC, which includes both the cost in money and the indirect cost generated by time.
Most of the existing bus and urban rail transfer behavior choice models only consider the time factor. Few literatures proposed models including both time and money factor. In the study, trip modes choices analysis considering GTC can reflect the influence of different factors on the trip modes. And the BL model including GTC function is more suitable for the real traffic status in China.
To do the survey easily, GTC in the study mainly includes two indicators: travel time and ticket price. As stated before, R ki is the cost function difference of the two modes, which can be shown as follows:

where T kit is the travel time of using the transfer mode on the effective public transit route k from i to j, T kib is the travel time of using bus-only mode on the effective public transit route k from i to j, F kit is the ticket price in using transfer mode on the effective public transit route k from i to j, F kib is the ticket price in using bus-only mode on the effective public transit route k from i to j, C1 is the time utility of passengers, and this variable is positive, and C2 is the ticket price utility, and this variable is also positive.
Travel time of the transfer mode can be presented as follows:

where T kit is the total time of travelling on the effective public transit route k (h), L kih is the travel distance on the bus line (km), v b is the velocity of the bus (km/h), L kjh is the travel distance on the urban rail line (km), v t is the velocity of the urban rail (km/h), and t h is the transfer time at station h, consisting of the time of entering into rail station and the waiting time.
According to the analysis of the whole trip process, the travel time of using bus-only mode can be obtained by the following function:

where T kib is the travel time of using bus-only mode on the effective public transit route k. Actually, sometimes passengers need to wait at the bus station. As the two modes of trips are both related to waiting time, waiting time is not considered in the paper.
So the probability of the transfer mode choice is shown as
4.2. Parameter Calibration
It is assumed that there are N passengers in the transportation system. The mode choice behaviors by the passengers are independent. So the mode choice behavior can be traded as N-square Bernoulli trials.
According to the maximum likelihood estimation method, the function is shown as follows:

where F is the maximum likelihood function, N1 is the number of passengers choosing bus, N2, N3, …, N m is the number of passengers taking bus transferring to urban rail, θ is attribute coefficient vector, and p1 is the probability of choosing bus mode.
Taking the logarithm in both sides to (8),

Calculate the derivation of C1, C2, and B0, and take the derivation to 0:

Parameter values of the model can be obtained through solving the function set in (10).
The maximum likelihood estimation results of the BRMCM's parameters (C1, C2, and B0) are obtained. As the form of the BRMCM's parameter is very complex, they are not shown in detail. The solving process is simple, which can be obtained through programming by some statistical software. For example, we can design Newton-RaPhson algorithm in Matlab software to calculate the estimation values of the parameters.
5. Influencing Factors of BRMCM
5.1. The Influence of Travel Distance
The probability of transfer mode choice is presented in (7), which only include one float variable (L kjh ) related to travel distance. To analyze the changing trend of P kt (i, j) and L kjh , some variables in (7) can be replaced as follows to simplify the probability function equation:

So the model of BRMCM can be simplified as

where α and C2 are positive parameters, while β is a negative parameter.
When ticket price of the transfer mode F kit is a constant, this model is a rising concave function whose changing rate decreases. The general changing trend of BRMCM is shown in Figure 2.

The general changing trend of BRMCM.
Totally, with the increase of trip distance L kjh , the probability of transfer mode choice increases.
5.2. The Influence of Ticket Price
5.2.1. Ultrastep Price Scheme
The probability function of the transfer mode choice shown in Figure 2 is based on the assumptions of the invariant price. For example, urban rail in Beijing uses the constant ticker price mechanism, which attracts passengers choosing the transfer mode. Actually, the tickets of urban rail in many other Chinese cities are not invariable. And usually, the ticket price increases with the increasing of travel distance. This ticket price mechanism can be represented as the form of piecewise function. In order to have a simple analysis, it is assumed that price is a two-section piecewise function. The price of the bus and rail transfer mode is a piecewise function about the travel distance of urban rail:
where D is travel distance, and the ticket price changes at the place of this travel distance. F1, F2 are constant ticket price.

According to (14), the changing law of this function can be presented in Figure 3.

The changing trend of BRMCM under the ultrastep price scheme.
It can be seen in Figure 3 that when the urban rail travel distance of the transfer mode trip is less than D, the selection probability of transfer mode P kt increases with the increasing of L kjh , and this changing trend is significant. When travel distance is D, P kt is ultrastep and the change rate is 1/(1 + αexp (Dβ + F1C2)) − 1/(1 + αexp (Dβ + F2C2)). This result is caused by the ticket price, indicating that the changing trend of P kt is not consistent under the comprehensive effect of price and distance. In addition, when the urban rail travel distance of the transfer mode is larger than D, P kt can increase with the increasing of L kjh , and the changing rate keeps decreasing.
5.2.2. Linear Price Scheme
Besides, in the real transportation system, it is important to discuss the function form of price and distance. Although the existing tickets pricing schemes have different forms including coin and bus card, the ticket price absolutely increases with the increasing of distance in every distance section. However, in total, the trend of ticket price increase with the increase of distance is constant. So F kit can be presented as follows:


Under the linear price scheme, the function of the bus and rail transit transfer behavior selection probability will be a convex function with the increase of L kjh when β + C2γ < 0. Therefore, using the above condition, we can get one certain γ which can help the operator making the scientific price scheme.
5.3. The Influence of Transfer Time
According to (7), the probability of bus and rail transfer behavior decreases with the increase of transfer time (C1 is positive). When transfer time t h increases 1 minute (1/60 hour), the variable quantity of bus and urban rail transfer behavior choice probability is 1/(1 + exp (C1L kjh (1/vt − 1/v b ) + C1/60 + C2(F kit − F kib ) + B0)). When L kjh becomes smaller or when (F kit − F kib ) becomes smaller, the impact of transfer time becomes more significant with the increase of the variable quantity of the transfer time choice probability. Only when it is a short trip and the prices are the same, the transfer time becomes an important factor of travel behavior to consider.
In a word, when only one influencing factor changes, for example, travel distance increasing, travel cost decreasing, or transfer time decreasing, the probability of transfer mode choice increases significantly.
In the real transportation system, different influencing factors may change at the same time. And these factors can have interaction effects on traveler's mode choice. Compared with the factor of travel distance, price and time are relatively easy to control. So making a reasonable price policy of public transportation could be highly beneficial to provide a scientific guidance of trip mode, adjust the proportion of travel behavior, and optimize the public transport resources. Transfer time is related to the convenience of rail station and the distance between bus station and urban rail station. Transfer time can decrease by the optimization of platform design, bus operation plan design, and hub traffic flow line design. The decrease of transfer time will improve the split rate of bus and urban rail transit transfer mode.
6. Case Study
Transfer behaviors of passengers in Nanjing urban rail line 1 are used for case study. The BRMCM's parameters are calibrated by the survey data. And the functions about the relationship between the transfer mode choice probability and travel distance or ticket price are obtained together. The calibrated function can verify the accuracy and feasibility of the built model.
In the rail station of Xinjiekou in Nanjing urban rail line 1, RP (Revealed Preference) and SP (Stated Preference) survey methods are applied to obtain the travel behavior data. The students in our research team distribute questionnaire at bus station which are near urban rail station and collect those questionnaires where travelers are waiting for bus. On the one hand, we get the basic information of travelers and travel information of RP. On the other hand, we also get the SP data of transfer mode choosing in different prices and different travel distances. In this survey, 400 questionnaires are distributed and 335 are returned. The effective recovery rate of the questionnaire is 83.75%.
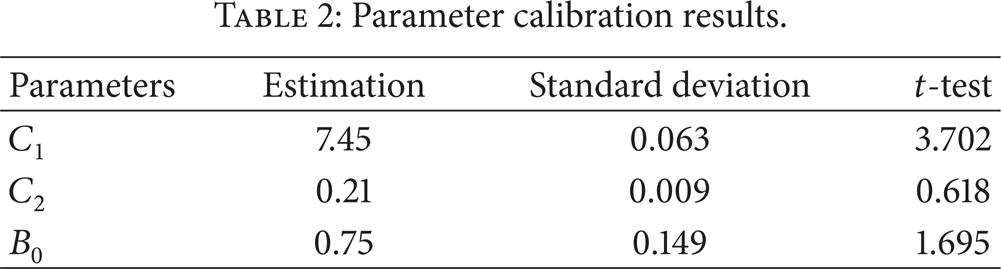
Based on the maximum likelihood estimation method in Section 4.2, the statistic software of SPSS is applied to calibrate the model, and the results are shown in Table 2.
Parameter calibration results.
Substituting the calibrated parameters into (7), the probability of the transfer mode choice from i to j is obtained in the following equation:

The built model is verified by comparing the model calculating result and practical survey data. The comparison results are shown in Table 3, and the accuracy and feasibility of the model are verified. The result suggests that the error is available and the proposed method is accurate and feasible. Although the prediction is not exact, it can reflect the general law of bus and rail transit transfer behavior and help the operator to promote a better public transport environment.
Comparison of the model calculation data and survey data.

In addition, it is shown in Table 3 that the probability of transfer mode choice keeps increasing with the change of L kjh , and the result can verify the conclusion in Section 5.1. The effect of ticket price and travel time can be concluded by substituting data into (17). Limited by the paper length, this paper will not discuss it.
7. Conclusions
Based on the utility function of GTC, this paper builds a special BL model named BRMCM to analyze the traveler's transfer behavior. And the proposed model is verified by the practical survey data. The following results are obtained.
When only one influencing factor changes, such as travel distance increasing, travel cost decreasing, or transfer time decreasing, the probability of transfer mode choice increases significantly. So this paper can propose some advices such as optimizing price charging pattern and improving the transfer condition to guide reasonable trips.
The selection behavior is influenced by several factors including travel distance, ticket price, and transfer time. The trend of split rate is uncertain as the influencing factors change simultaneously. For example, when the ticket price is an ultrastep function, the split rate of transfer mode increases as the travel distance increases; however, the changing trend of transfer mode choice rate and travel distance is not keeping increasing, and the changing trend function has an ultra-step point. In addition, only when it is a short distance trip and the prices are the same, the factor of transfer time becomes an important influencing factor for travel behavior. So it is important to optimize the public transportation system comprehensively to improve the transfer mode choice rate.
The problem studied in the paper illustrates a very special case of transfer behavior choice, characterized by its influencing factors. The model of BRMCM is calibrated by one station's survey data. Much more survey data should be obtained to verify the accuracy and feasibility of the built mode choice model. In addition, in a deeper study, based on the built route choice mode, other models should be tried to solve the feeder bus network optimization problem. In addition, based on more survey data, the relationship between the price and the time should be discussed to improve the accuracy of the model.
Conflict of Interests
The authors declare that there is no conflict of interests regarding the publication of this paper.
Footnotes
Acknowledgments
This research is supported by the National Natural Science Foundation of China (50778041). More importantly, the authors also want to thank the interviewers and the voluntary respondents for their assistance in the data collection in the survey.