
Abstract
Three-point bending creep test was used to understand the creep behavior of typical thin film/substrate systems—thermal barrier coating (TBC) systems. Firstly, a simplified model, which does not consider the local effect, has been set up to get an analytical relationship. The important result is that creep stress exponent of materials is equal to the creep load exponent of the steady-state deflection rate of BC specimens. Secondly, in order to consider the local effect of bending, the finite element method (FEM) has been carried out. FEM calculation shows that there is a steady stage of the creep deflection under a constant applied load. And the exponent of the steady-state creep deflection rate to the applied load is found to be equal to the creep stress exponent of materials. The creep constant of the materials can be obtained by a set of trials with assumed creep constants of materials and can be finally determined by the best fit method. Finally, the finite element results show that the influences of the friction, the thickness of TBCs, and the modulus ratio of TBC to the substrate on stress distribution are important.
1. Introduction
Thermal barrier coatings (TBCs) have been used in many fields to protect structural components from the intrinsic high temperatures, for example, on cooled gas turbines blades or vanes [1–3]. Determination of the mechanical properties such as the creep and the interface parameters of the TBCs has become a key technology in the thermal barrier coatings systems. Conventional tests, such as the uniaxial tensile test and double shear test, have been routinely employed to probe the creep properties of high temperature materials, and several continuum models were established [4–6]. Despite these extensive studies, due to the limitation of specimen sizes and threads of conventional testing machines, it remains quite challenging to perform uniaxial tensile or double shear creep tests at temperatures higher than 1100°C [4]. As an alternative technique, bending creep test has recently attracted attention owing to its simple experimental setup and specimen geometry. During processing and further thermal exposure, the third layer is formed between the bond coat and the top coat. This layer is commonly referred to as the thermally grown oxide (TGO), primarily made up by alumina (Al2O3). The delamination is normally associated with the TGO [7]. In the normal applications, creep, the time-dependent plastic deformation of materials, is important. Basic information on creep is experimentally obtained from creep curves which show the evolution of strain in a uniaxial tensile creep test as a function of time.
The aim of this paper is to investigate the method to obtain the creep parameters of TBCs systems and the effect factors. At first, a new method was investigated to obtain the creep parameters including creep parameter B and creep constant n of every layer. Secondly, we also investigate the influence of the friction and the thickness of the TBC. The three-point bending creep test was used here for its advantages in the bending creep testing.
2. Creep Deformation of the Three-Point Bending Test
2.1. Theoretical Model
Firstly, an analytical assessment of creep bending test is performed, as illustrated in Figure 1(a). The effects related to local stress concentrations and local deformation events at the contacts between the specimen and the three support/loading locations are neglected. The loading scenario by a beam which reacts to a load P by deflecting towards the negative z-direction is represented, as shown in Figure 1(b). The height 2h of the bar (thickness in the z-direction) is small and therefore the geometrical moment of inertia to bending is small. Our specimen bends easily, and therefore it seems reasonable to assume that the contribution of the shear displacement to the overall deflection d is small and can be neglected [8].

Geometry of three-point bending test and directions x and y. l is the distances between the two supports on (a), and a is the distances between the central support and the loading pin on (b). Bending deflections d(Δ) accumulate in the negative y-direction. In this paper, l = 4 mm, a = 12 mm (in the first try), a = 18 mm (in the second try), and the thickness of the specimen is 2h = 3 mm, respectively.
We define a space coordinate x which runs from the left support (x = 0) to the loading pin (x = l + a). The load P acting in the negative z-direction causes the rectangular beam (height: 2h, width: b) to defect by an amount d (specified in Figure 1(b)). The bending moments M in our specimen depend on x. We obtain the moment M in the left part of the specimen, between the two supports (0 ≤ x ≤ l), with s, the cross-section of the beam:

The moment M in the right part of the specimen (l ≤ x ≤ l + a) is given by

We now assume that our overall deformations are small and consider relations between the bending defection d(x,t) considering its second derivative d″(x,t) with respect to x, the radius of curvature of our specimen k(x,t), the stress σ(x,z), and the bending strain ε(x,z,t):
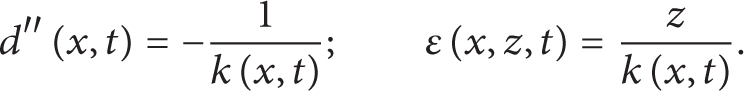
This allows us to obtain the following relations between the strain ε and the second derivative of the deflection with respect to x (dd″(x,t)/dt) and the corresponding derivatives with respect to time:

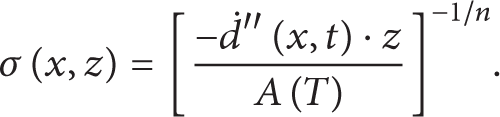
We now assume that creep rates show a power law dependence on stress:

With (5) we can write for the stress
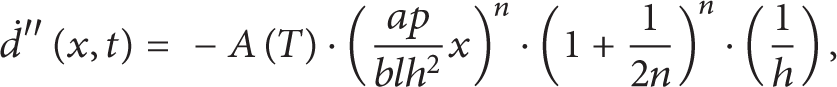
And we can insert this stress in our equations (3) and (4) for the moments:


With these equations we obtain

With the boundary conditions = 0 → d = 0,x = l → d = 0. We can now integrate (7b) twice with respect to x and obtain


For the x-position at the loading pin (x = l + a), this expression yields

This can be simplified to

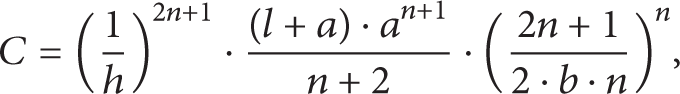
where C is a constant which depends on the geometry of our bending creep specimen and on the creep stress exponent. Our analysis shows that the power law load dependence of the deflection rate is the same as the stress dependence of the strain rate and thus our analysis suggests that creep stress exponents can be directly obtained from the load dependence of the deflection rate in our bending creep test:

where N is the creep constant which can be directly retrieved from the bending creep test. It is related to B′ (or B from (1a) and (1b)):
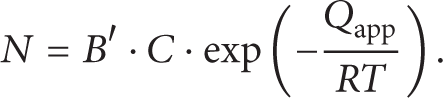
From N we can obtain the creep constant from (1a) and (1b) through

It can be seen from the above equations that the steady-state deflection rate is proportional to load to the powern. The corresponding stresses in the beam in the steady state are directly proportional to load and the strain rates are proportional to load to power n. In addition, these results also show that the present bending creep experimental fixture can be used to determine the creep properties of high temperature materials as the uniaxial tensile creep testing. In the following study, a finite element method will be used to explore the possibility of getting the creep properties of materials in detail from the bending creep test.
2.2. Finite Element Model
As shown in the model geometry (Figure 2), it consists of a superalloy substrate with a thickness 2.20 mm (at the fourth position), a bond coat with an average thickness of 145 μm (at the second position), and a thermal barrier coating of 235 μm (at the first position) average thickness. The interface region between bond coat and TBC is modeled with a TGO. Material data used in the simulation is shown in Table 1. They are nearly the same as in [9], except for the creep properties of the TBC. According to [10], the creep exponent of the TBC is 1.3, but in order to simplify the analysis, we have fitted the creep law given in [10] to be a linear law so that the creep exponent of TGO and TBC both equals 1.
Material properties used in the model.


FE model used for the numerical calculations performed in the present study: the thermal barrier coatings have been predigested into four layers. Below the bracket four positions (1–4) are highlighted. They are the positions of TBC layer, TGO layer, BC layer, and the substrate, respectively.
In order to investigate the influence of the thickness, a thickness ratio, λ, is defined for later use as
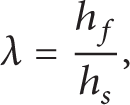
where h f and h s are the thicknesses of the TBC layer and substrate, respectively. The thickness ratio λ is varied as λ = 1/30, 1/15, 1/10, and 2/15, which is corresponding to h f = 100, 200, 300, and 400 μm for a fixed h s = 3 mm, respectively.
Young's modulus of the substrate is fixed as E S = 200 GPa [1–3]. In order to examine the effect of Young's modulus ratio, a parameter, η, is defined as
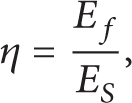
where η is changed from 0.15, 0.2, 0.4, 0.6, 0.8, and 1.0. It was reported that in-plan Young's modulus of EB-PVD TBC is 40–60 GPa (η = 0.2–0.3) and APS-TBC is 30–200 GPa (η = 0.15–1.0) [1–3]; therefore, η, the range 0.15~1.0, covers Young's modulus of typical TBC systems. In this paper, we use them as the parameter of the thin film layers. At the same time, Poisson's ratio of the thin film layers and substrate is assumed to be 0.2 and 0.3, respectively [1–3]. The materials are taken to be isotropic and completely linear elastic undergoing plane strain deformation.
In order to understand the effect of different friction between the brackets and bending creep specimen, the different friction coefficients f = 0, 0.1, 0.3, 0.5 were defined, respectively.
3. Results and Discussion
3.1. Distribution of von Mises Equivalent Stresses
Figure 3(a) shows the distribution of von Mises stress in the specimen at the creep time t = 103 s. The creep parameters are B = 7.3 × 10⁻¹⁰, n = 1. The loading is P = 10 N. Here the distance of the indenter to the bracket O: values for a and l of 4 mm and 12 mm. It can be seen that the maximum von Mises stresses are near the bracket B. From the analytical study in the above section, the moment is maximum in the specimen near the bracket B. The stress distribution shown in Figure 3(a) is quite well in agreement with the stress distribution assumptions made in the above section; that is, there is the symmetry in the beam and the sections of the beam remain plane during creep deformation. The FEM results also show that there is a stress concentration induced by the indentation of the applied loading. In order to characterize the stress distribution, Figure 3(b) shows the variation of stress with the creep time of the four points, shown in Figure 1(b) as the representatives. With the creep deformation, the stress decreases and tends to steady value with the creep time. Figure 3 also shows that the previous assumption was correct and that most of the deflection is due to bending, not to shear (the elements remain plane). Having considered the evolution of stresses in our specimen in the precious section, it is necessary to discuss the deflection of the specimen under different loads. Figure 4(a) shows deflection as a function of creep time. Three different loads, 10 N, 14 N, and 18 N, were considered using the same creep parameters in Table 1. Figure 4(a) illustrates that there is an immediate elastic increase in d at the moment of loading. We then observe decreasing deflection rates, which can be more easily identified when plotting the deflection rate d as a function of t (Figure 4(b)). For all loads, constant deflection rates are soon established and we can consider deflection rates taken after 103 s as steady-state creep data. We can perform calculations with different values of the creep parameters and calculate the corresponding dependence of the deflection rate on the bending load p = 10 N. Using this thought, a method to obtain the creep parameters of different layers of TBC system can be proposed as in Section 3.2.
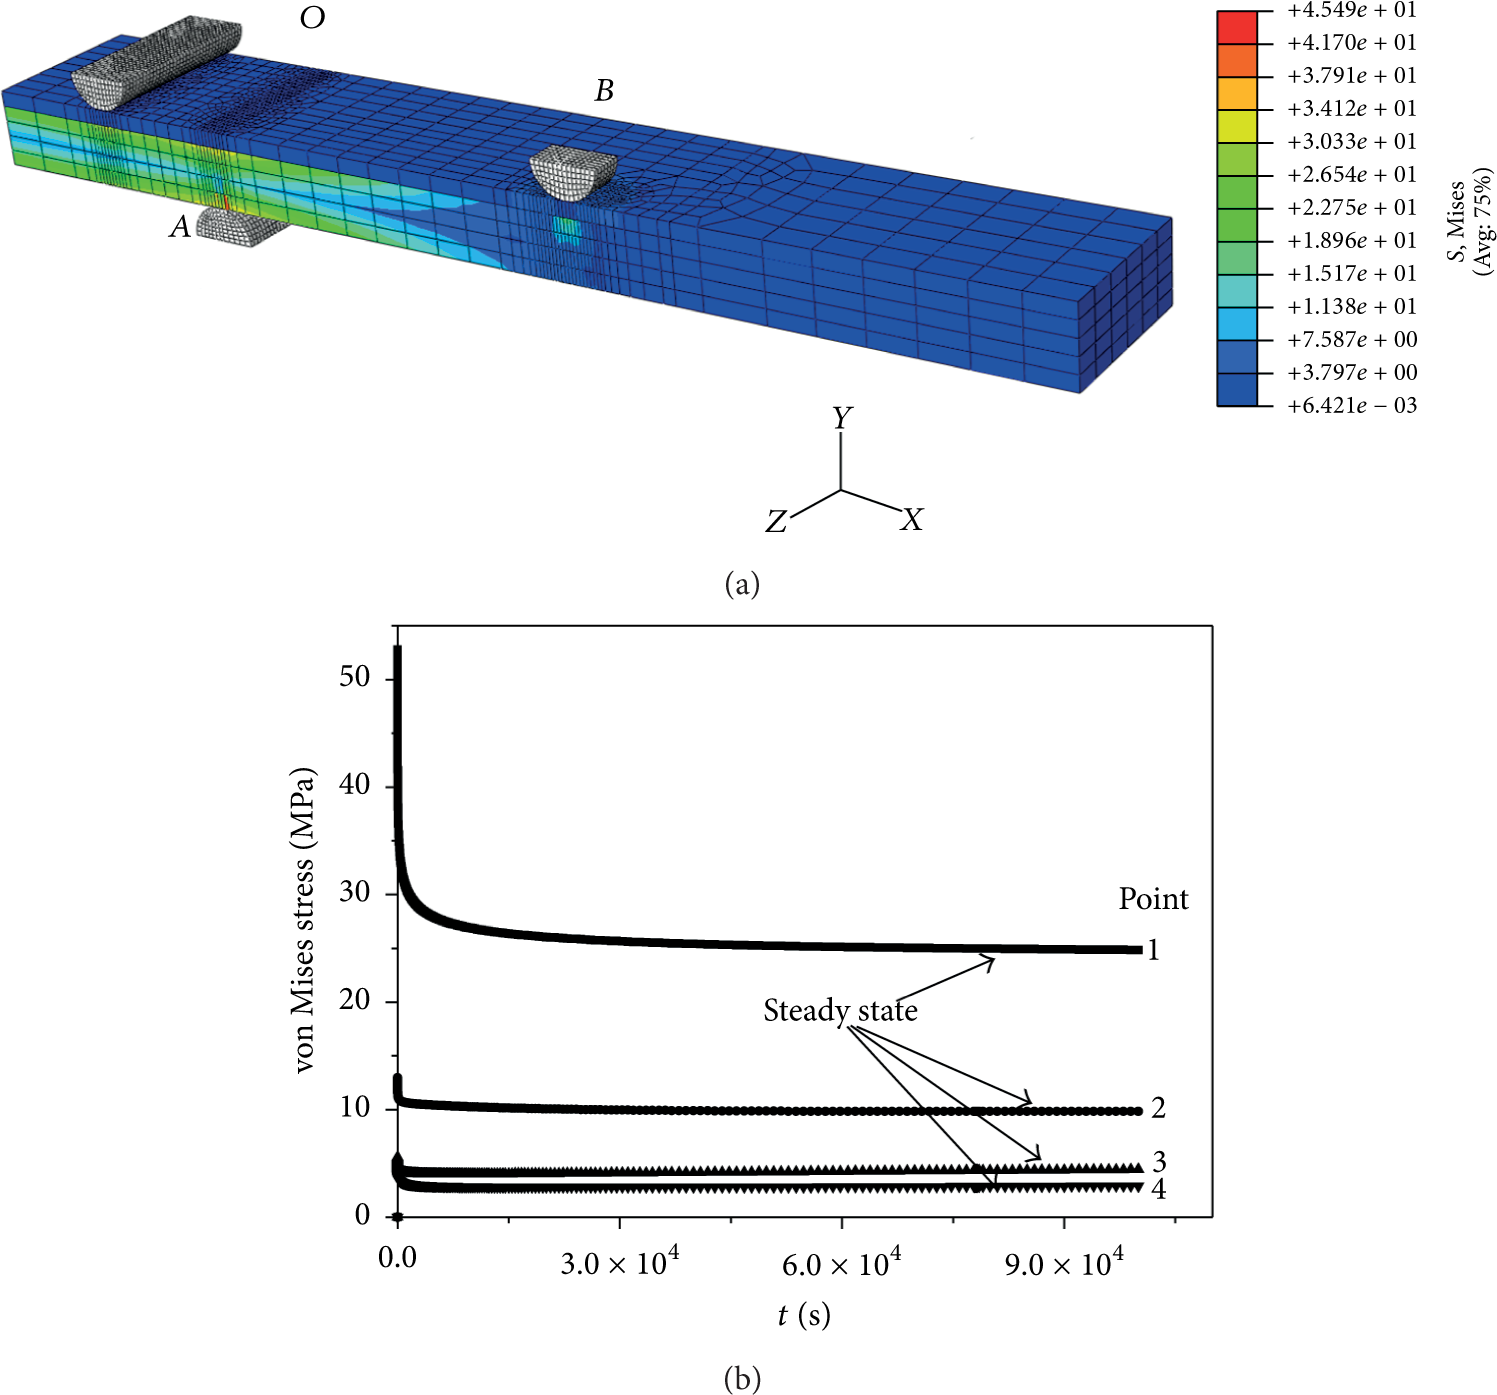
(a) Distribution of von Mises stress after bending creep testing for t = 103 s. FEM parameters are shown in Table 1, p = 10 N and a = 12 mm, and the unit of the Mises stress is MPa. (b) Redistribution of stress in a beam beneath the bracket.

Effect of different bending loads on creep deflection of TBC layer. (a) Evolution of creep deflection with time. (b) Evolution of creep defection rate with time. FEM parameters are shown in Table 1.
3.2. A Reverse Numerical Approach to Determining the Creep Properties from the Bending Creep Test
From the simplified model, it can be seen that the (dd/dt) s is also related to the positions of the bracket. Besides, the more far the distance (X) from the originations O for the bracket is, the greater (dd/dt) s will be. In this section, a procedure will be illustrated to obtain the creep constant B by starting off with a result from a set of bending creep tests under a certain creep load, for example, 10 N, for the two different distances (X = 12 mm,X = 18 mm).
And the detail procedure can be summarized in the following two steps.
Step 1. Steady-state deflection rates (dd/dt) s versus a series of assumed creep parameters were given under two different distances of loading pin (a = 12 mm and a = 18 mm), as shown in Figures 5(a) and 5(b), respectively.

The relationship between the steady-state deflection rate (lgdd/dt) under different distance between the loading pins and the specimen versus assumed creep parameters of the TBC layer: (a) a = 12 mm; (b) a = 18 mm.
Step 2. Two horizons lines (dd/dt)s1 = 3.1623E − 12 and (dd/dt)s2 = 8.7638E − 12 (assumed steady-state deflection rates (dd/dt) s in the two distances a = 12 mm and a = 18 mm, resp.) were drawn in Figures 5(a) and 5(b), respectively. The intersections provide two sets of the data of n -lgB.
Step 3. Two curves of the data of n -lgB are drawn in Figure 6 and the intersection corresponds to the values of n and B which we are looking for. They are n = 7.359 and B = 7.21E − 10.

The curves of the two sets of the intersection in Figure 5 and the intersection in this figure will result in the values of B and n in the TBC layer.
Step 4. Generally, from Steps 1 to 3, the results may not be very accurate after a first calculation step. However, by applying an iterative procedure, it is possible to refine the results by considering narrower ranges of B and n values. With the new parameters ranges, we carry the bending creep calculations to obtain a new set of B and n. If necessary, we further limit the parameters to smaller ranges to obtain new results. Until we get a satisfactory result, here, three repeated results are listed in Table 2.
Numerical results of the creep parameters of the TGO layer.

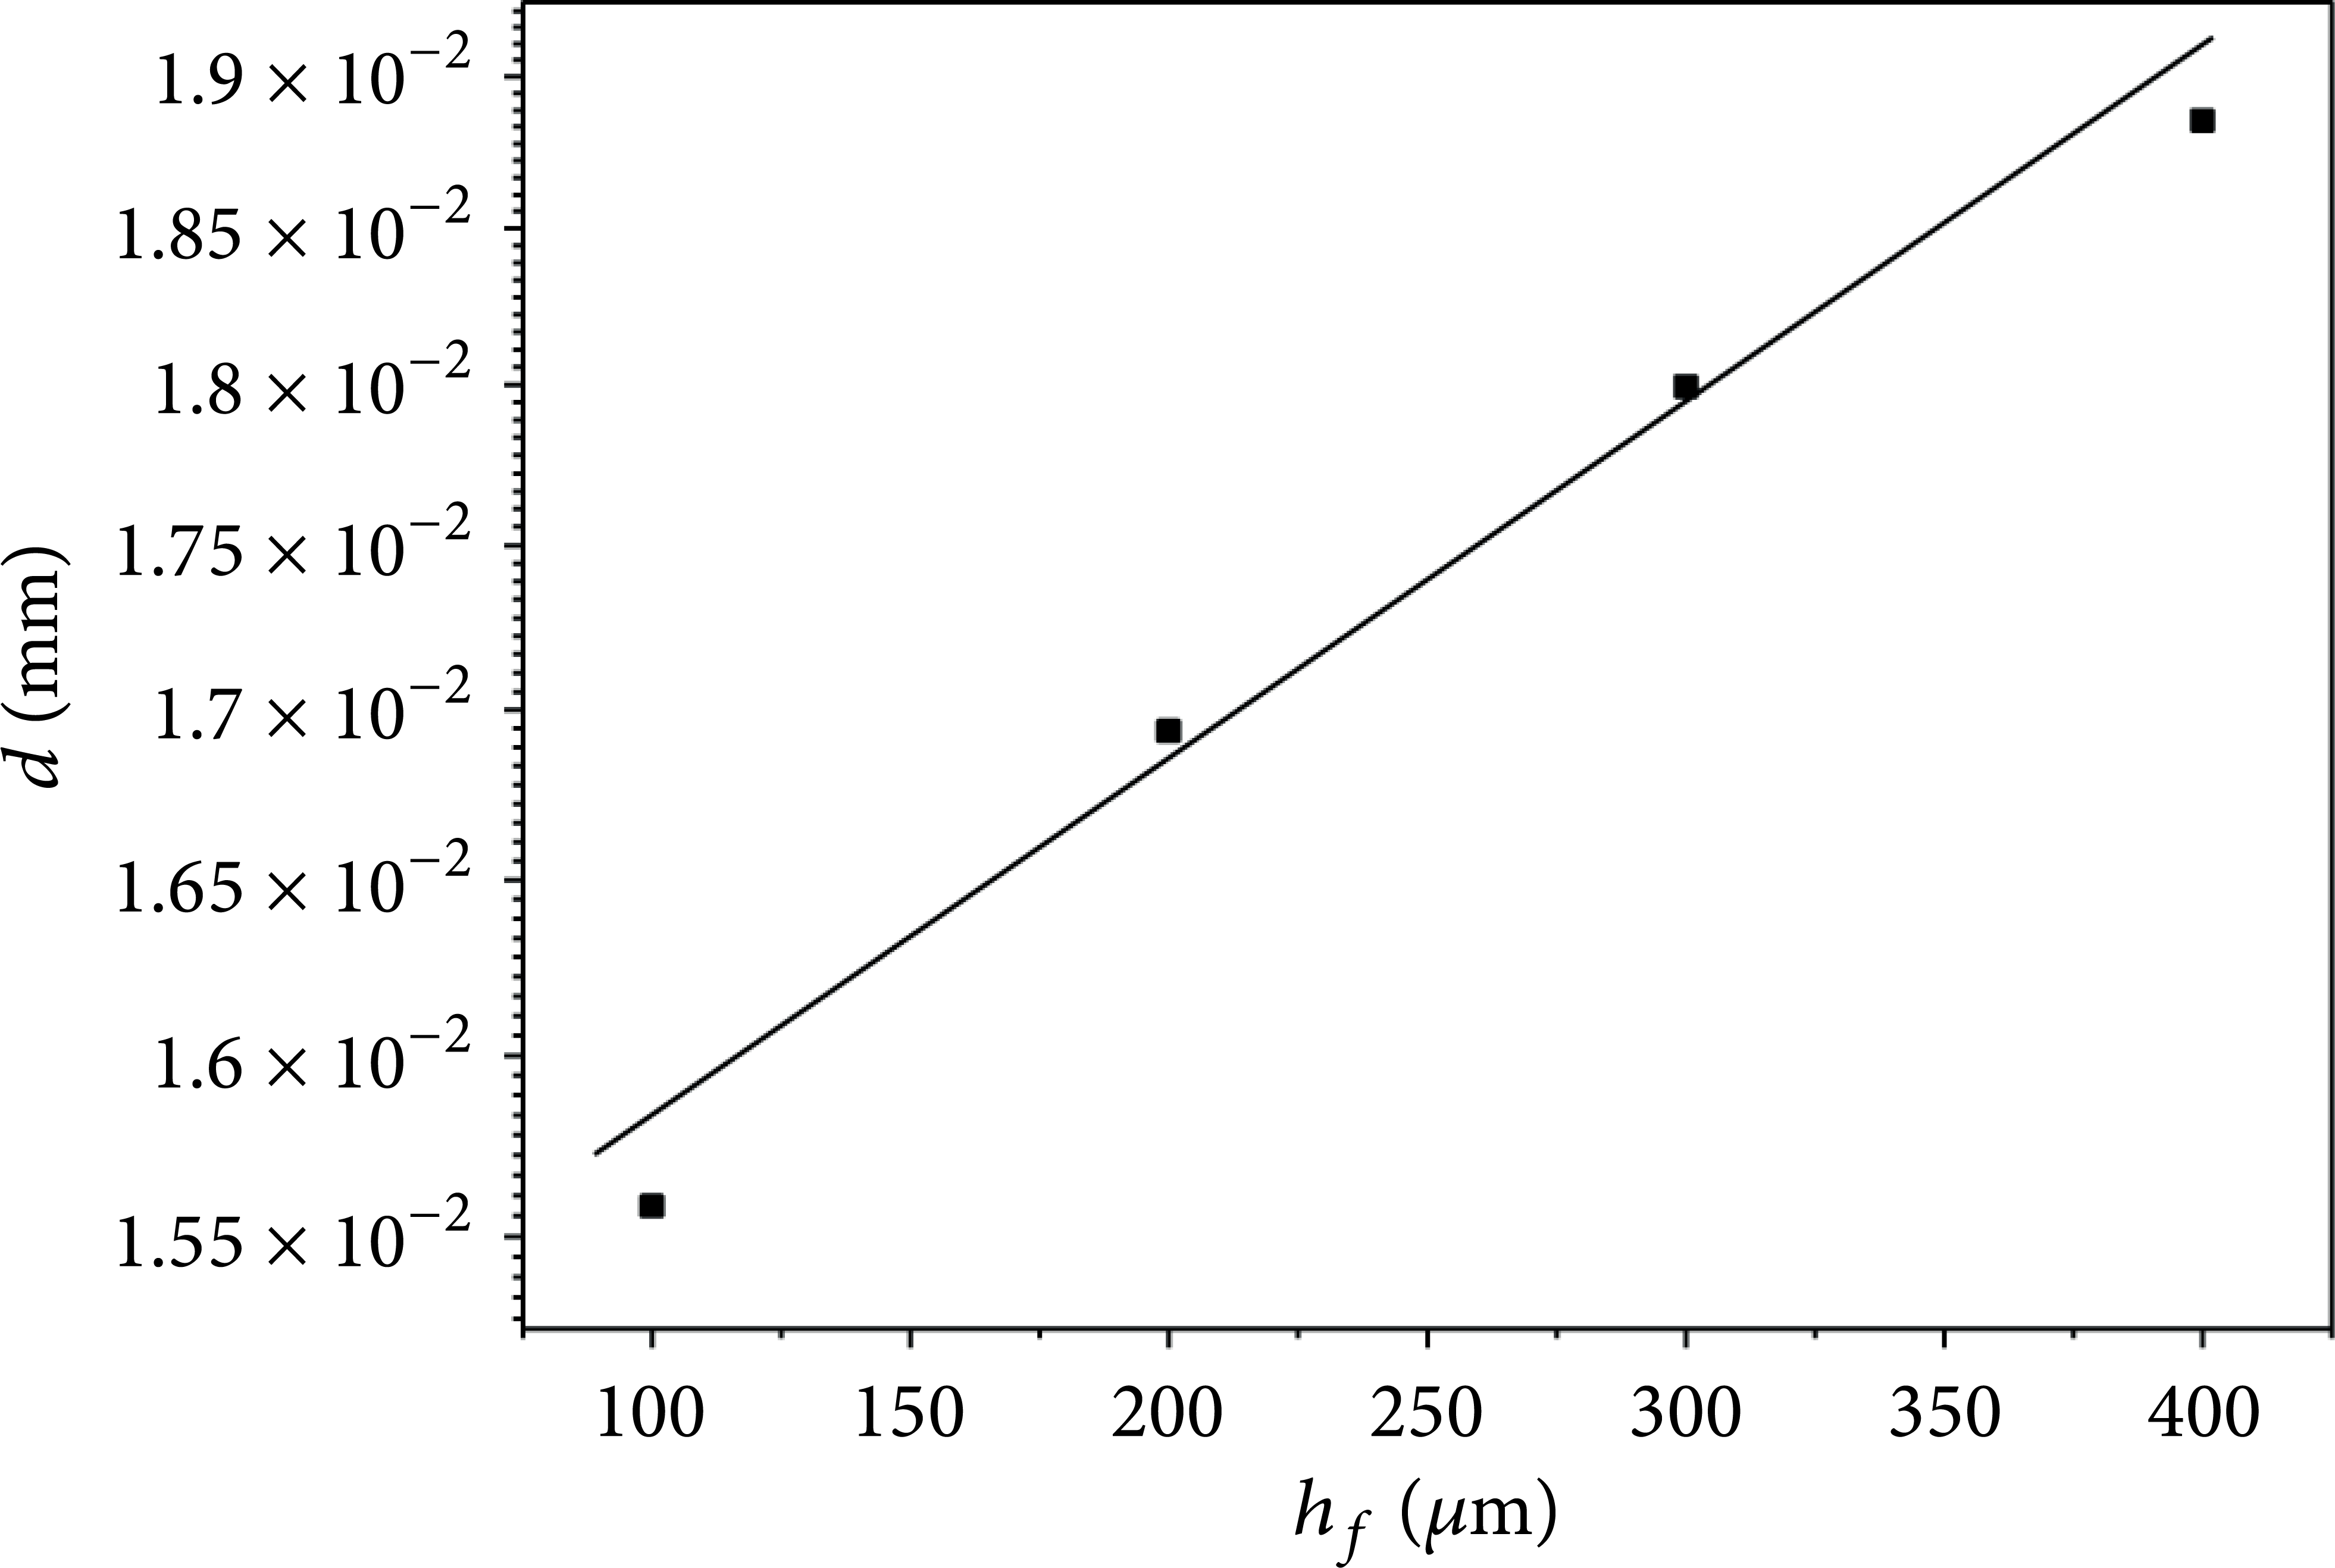
In a word, synthesizing the above process, we can prepare a program to get TBC layer creep properties with combination of finite element calculations and bending creep testing. The flow diagram is shown in Figure 7. It should be pointed that only two bending creep tests with two different distances of loading pin are needed in order to determine the TBC layer creep parameters for this method and then implement the experiential results into the flow diagram. Finite element calculations are performed with an assumed set of parameters until the results can be accepted. Using the same method we also can obtain the creep parameters of TBC, BC, and SUB layers. The results are shown in Table 3.
Numerical results of the creep parameters of other layers.

Flow diagram of determining the creep stress exponent n and constant B of thermal barrier coatings with three-point bending creep testing. In the diagram, Brange(i) and nrange(i) represent the assumed range of creep stress constant B and exponent n, respectively. (dd/dt)s1exp and (dd/dt)s2exp are the steady-state deflection rate for the three-point bending creep testing with two different distances, respectively. The symbol i shows the number of repeated FEM calculations.
3.3. Influence of Different Friction
Up to now the possibility that the results are affected by friction between the loading pin and bending specimen has not been considered. It is interesting to perform some qualitative FEM calculations using arbitrarily selected values for friction coefficients f ranging from 0 to 0.8. The friction coefficient is related to a tangential stress in the contact area, which is linearly dependent on the pressure between the loading pin and the specimen. As shown in Figure 8(a), the accumulation of creep defection is smaller when a higher friction coefficient is used in the calculations. We understand that as the specimen deflects, the loading pin changes its position on the specimen surface and this causes friction, which affects the deflection rate. The effect is small but significant. Figure 8(b) presents the result which considers the effect of the different friction. According to Figure 8(b), we can find that, with the increasing of the fiction, the smaller creep parameters can be obtained. And at lower deflection, the effect of a superimposed friction is smaller because the material can flow around the bracket to accommodate forces associated with friction. Again, the effects are small but significant. Precise calculations therefore should take friction effects into account.

Effect of friction between the loading pins and the bending specimen on (a) the evolution of creep bending deflection with time and (b) the results of the creep parameters (B and n) of TBC layer. FEM parameters are given in Table 1, p = 10 N, a = 12 mm, and creep time: t = 103 s.
3.4. Influence of the Modulus Ratio (η) of Thin Film to the Substrate
Figure 9 shows the influence of η on the deflection-creep time. It is clear that the deflection increases with the creep time increasing. And the deflection decreases with η increased for the same creep time. The thin films layer/substrate becomes from soft thin film layer/hard substrate system to hard thin film layer/soft substrate system with increasing of η and results in the deformation under the loading pin more hardly. That also can be seen that the steady-state deflection also decreases with η increases.

The influence of η on the deflection (d) creep time (t).
3.5. Influence of the Thickness of the Thin Film (h f )
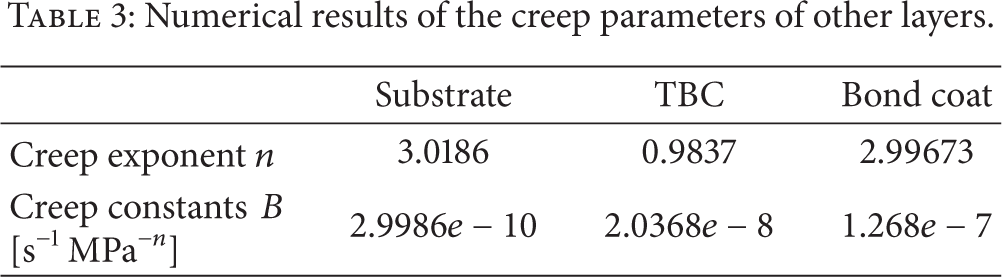
The influence of the thickness of the thin film on the deflection propagation is shown in Figure 10. The case presented here is η = 0.4. It is obvious that a larger thickness of the thin film generates a larger deflection at the same creep time. Besides, the steady-state deflection rate increases as the thickness of the thin film increases. We also can see that the larger the thickness of the thin film, the more difficult to reach the steady state. Figure 11 shows the deflection rate as the function of the thickness of the thin film and also indicates the variation of the steady-state deflection rate with the thickness of the thin film. It can be seen that the steady-state deflection rate increases linearly with the thickness of thin films.

Influence of h f on the indentation depth d as a function of the creep time t. Parameters: η = 0.4.
Deflection rate as a function of the thickness of the thin film. Parameters: η = 0.4.
4. Conclusion
The detail finite element has been performed with the emphasis put on determining the creep properties of the thermal barrier coatings by the bending creep test. A method has been explored to show the process of obtaining the creep constant and stress exponent and the three important factors have been investigated. The main conclusions have been drawn as follows.
A method has been presented to determine the creep stress exponent by performing several different load level bending creep tests. This method is to resolve the slope of the steady-state deflection rate (dd/dt)s, the creep load curves in the log-log grid. Following the creep stress exponent known, a method of determining the creep constant has also been given. The FEM results are well in agreement with theoretical results.
We give that a procedure
The friction between the brackets, bracket, and beam will reduce the measurable creep stress exponent during the bending creep experiment.
For a given thickness of the thin film, the steady-state indentation rate increases as the modulus ratio of the thin film to the substrate increases. For a given modulus ratio of the thin film to the substrate, the steady-state indentation rate will increase as the thickness of the thin film increases.
Conflict of Interests
The authors declare that there is no conflict of interests regarding the publication of this paper.
Footnotes
Acknowledgments
This work was supported by the Fundamental Research Foundation (JC201138, JC201237) at the Northwestern Polytechnical University, Aeronautical Science Foundation of China (2012ZD53053), Aerospace Technology Support Fund of China (2013-HT-XGD), and Specialized Research Fund for the Doctoral Program of Higher Education of China (20126102120034).