
Abstract
Accurate tests and performance analysis of engines are required to minimize measurement errors and so the use of the advanced test equipment is imperative. In other words, the reliable test results depend on the measurement of many parameters and recording the experimental data accurately which is depended on engine test unit. This study aims to design the control system of an internal combustion engine test unit. In the study, the performance parameters of an available internal combustion engine have been transferred to computer in real time. A data acquisition (DAQ) card has been used to transfer the experimental data to the computer. Also, a user interface has been developed for performing the necessary procedures by using LabVIEW. The dynamometer load, the fuel consumption, and the desired speed can easily be adjusted precisely by using DAQ card and the user interface during the engine test. Load, fuel consumption, and temperature values (the engine inlet-outlet, exhaust inlet-outlet, oil, and environment) can be seen on the interface and also these values can be recorded to the computer. It is expected that developed system will contribute both to the education of students and to the researchers’ studies and so it will eliminate a major lack.
1. Introduction
In recent years, an increase in the number of motor vehicles has been witnessed. In parallel with this development, new issues such as energy saving, emission reduction, environmental protection, and demand for safety have been included in the agenda of human beings. Thus, it has become necessary to produce the engines which can meet these new requirements. This case increases the importance of functional tests. Therefore, the researchers have focused their studies on the development of new testing units. During engine tests, researchers have to control several parameters at the same time and they need to record lots of data. By using PC-controlled and -automated engine test units, it is very easy to carry out tests with high precision. PC-controlled test units are very expensive because of that many researchers do not have the ability to use them. In this study, we aimed to implement a low-cost and fully automated engine control system.
LabVIEW is a highly functional engineering graphical programming environment which is widely used in researches worldwide. LabVIEW has ability to connect several DAQ cards and its program execution is based on data flow. Therefore, it is widely used for data acquisition, data analysis, and data control [1]. Using LabVIEW make it possible to create visual, flexible, and scalable laboratory programs. PC-controlled engine test unit should have lots of analog I/O and digital I/O. In this study, a DAQ card has been chosen as PC I/O equipment. LabVIEW has been chosen as a programming environment because of its abilities.
A PC-controlled dynamical engine test and control could be used for engine's transmission parts simulations. It is very useful for emission analysis and practical development of emission preventing technologies [2]. Without using engine test units, exhaust emission analysis has statistical and systematic errors. By using PC-controlled engine test and control unit some simulation procedures could be created and performed. This is very accurate and robust way for emission analysis [3–5].
Bunker et al. [6] have been designed a control unit in order to provide the control of an engine test unit and dynamometer. The diesel engine has been tested at the designed control unit. As a result of experimental study successful results were obtained. Gubeli and Dorey [7] have designed an interface to control dynamometer at the engine test unit. Designed system can be made automatical according to different working conditions.
Feng et al. [8] have designed an interface at the LabVIEW program to conduct engine test. The experiments have been carried out on a SI engine. The system consists of the engine control unit, DAQ card, computer, and some additional electronic circuits as hardware. The system has tested basically three functions: ignition control, stepper motor control, and throttle position control. As a result of the engine tests the engine that is designed is more reliable and accurate data have been obtained from experiments.
Hafner et al. [9] have developed a software/hardware environment for engine control systems. This dynamic engine test stand has been qualified to perform functions such as design and tests for new control. The desired control settings have been calculated by using the developed engine management system and developed optimization strategies by means of adequate models of the engine behavior with fast neural networks. Benito et al. [10] have aimed to improve the real-time performance of some optimization algorithms used in engineering control units. A genetic algorithm (GA) has been used to optimize the working parameters of a spark ignition reciprocating engine. They have tried to find out the values of some engine control parameters such as intake pressure, intake pipe length, intake valve closing angle, and spark timing that yield the requested engine power while requiring minimum specific fuel consumption. Wang et al. [11] have designed and developed a diagnostic tool based on Kingtec Standard Diagnostic Protocol. A physical connection and level translation between personal computer (PC) and electronic control unit (ECU) have been realized by using developed special communication module. The system consists of guidance service suggestion (GSS) function module and fundamental function module which have been designed with Visual C++ and LabVIEW languages. They have showed that the developed system could realize accurate and quick data communication, online diagnostic management, real-time and dynamic measuring data refreshment, online programming data, and practical GSS.
Cerri et al. [12] have attempted to achieve high levels of specific power output and efficiency and so, they have carried out an experimental activity to understand how each fuel sample could improve the performance of a modern naturally aspirated SI (spark ignition) engine for passenger cars. This experimental campaign has consisted in measurements of the maximum brake torque (MBT) curve up to knock onset and the corresponding knock intensity, at wide open throttle (WOT) and partial load operating conditions, for each tested gasoline sample. González et al. [13] have studied the simulation design of an engine control unit (ECU) for an Otto cycle engine with electronic fuel injection (EFI) using Simulink and Stateflow. Their simulation includes a model for the ECU as well as physical parameters of the engine, which allows closed-loop control and monitoring of various systems. The study allows controlling of various parameters of the ECU using an open-loop control. They have used this simulation for gas emission, fuel economy, and engine performance improvement purposes. Antonopoulos et al. [14] have realized an experimental investigation on a single cylinder diesel test engine to identify the aforementioned problem. They have recorded cylinder pressure and instantaneous speed during the tests. The comparison of the two cylinder pressure traces and the thermodynamic parameters derived from them reveals the introduction of an error which depends on engine load and speed. Taglialatela et al. [15] have proposed the use of a multilayer perceptron neural network to model the relationship between the engine crankshaft speed and some parameters derived from the in-cylinder pressure cycle. They have demonstrated an application of neural network model on a single-cylinder spark ignition engine tested in a wide range of speeds and loads and have confirmed that a good estimation of some combustion pressure parameters can be obtained by means of a suitable processing of crankshaft speed signal.
Scattolini et al. [16] have presented a model and a simulation environment in order to characterize new throttle bodies and to design the associated control algorithms. Thus, they can properly regulate the additional air flow provided to the engine in idle speed conditions. Isermann and Müller [17] have explained the structure of a rapid control prototyping (RCP) system, which allows for fast measurement signal evaluation and rapid prototyping of advanced engine control algorithms. Providing efficient engine models for the proposed development tools, a dynamic local linear neural network approach has been explained and applied for modelling the NO x emission characteristics of a direct injection diesel engine. Finally, they have presented the simulation results for a 40-ton truck. Chung et al. [18] have proposed a real-time estimation algorithm of combustion parameters. The proposed estimation algorithm uses the difference pressure only instead of the in-cylinder pressure for calculation of the combustion parameters and it requires only 51% of the execution time to calculate the combustion parameters compared to the conventional method. They have validated the proposed estimation algorithm with an engine experiment under 131 operating conditions that showed high linear correlation with the original combustion parameters.
Franco et al. [19] have presented a real-time engine brake torque estimation model where the instantaneous measured engine speed serves as the model input. The engine brake torque estimation has been separated into two parts: steady state and transient in their study. They have provided validation of the engine brake torque model using a computational engine model for a 6-cylinder heavy duty diesel engine. Martínez-Morales et al. [20] have presented a neural network model of internal combustion engine in their work. At first, they have collected data of a 1.6 L gasoline engine which has been used for deriving an engine neural model. Three inputs such as engine speed, injection angle, and the amount of injected fuel have been included to the system into a specific value range and then emissions have been measured. The results obtained showed the effectiveness of the proposed approach in modeling the studied gasoline engine.
Here, we have tried to choose the most relevant ones to our study of studies. Almost, all of the studies are original and also they provide significant contribution to the world of science. However, each of them is focused on one or a few parameters. Also, they have a rigid structure and to use them for other parameters on similar researches is difficult. However, our available study has a flexible structure completely. The desired parameter can be added and removed very easily. Therefore, the developed system can be adapted to all engine tests with only a few arrangements. In this respect, this system can also be used for educational purposes, including distance education, as well as professional engine tests. In other words, the system has a universal structure and is suitable for both testing and control. This case is distinctive feature of this study.
This study is organized as follows: at first, an introduction and literature review are presented. Section 2 gives material and methods. Section 3 illustrates experimental studies. Section 4 presents the results and discussion, and section five describes the conclusions of the study and future works.
2. Materials and Methods
Framework and mechanical equipment of the test stand of which the control system will be developed are already available. The developed control system has been adapted to this current mechanical system. LabVIEW software has been used to design the control system. It is a highly productive development environment and is very suitable for real-time control applications. The engine operating data such as load, temperature, speed, and instantaneous fuel consumption have been transferred to a computer by using data acquisition card in real time. At the same time, the engine throttle control has been controlled by a servomotor and also the load of the dynamometer has been controlled by applying voltage to the setting input. These controls are real-time processes too. The USB-6251 DAQ card which produced by the National Instruments company has been used in the control system. The 6251 DAQ card has been preferred because it has the analog/digital input and output channels and provides the required specifications. Data to be read from the engine have been received by means of analog/digital inputs of the data acquisition card and then the parameters needed to be adjusted have been controlled by using analog/digital outputs. The overview of the designed engine test stand in Figure 1 and its block diagram in Figure 2 have been given respectively.

Experimental setup.

Experimental setup block diagram.
The prepared interface and program have been developed using national instruments “LabVIEW” software. LabVIEW software has a high capability for real-time data acquisition operations and can operate fully compatible with the data acquisition card and so it has been preferred for this study.
Inlet and outlet temperatures of the engine coolant, engine oil temperature, and atmosphere temperatures have been measured by NTC type thermistors. NTC thermistor's resistance changes negatively according to temperature increase. Practically thermistor resistance value was measured as analog voltage using a reference serial resistor. In this study, NTC thermistors are read by DAQ card analog inputs. Measured voltage converted the temperature by using formula (1):

where β is the gain coefficient of thermistor (fixed), T R is the reference temperature (kelvin), T is actual thermistor temperature (kelvin), V is thermistor voltage, V i is Input reference voltage.
Exhaust temperature is extremely high. Therefore, a thermocouple with a maximum range of 1200°C is used to measure exhaust temperature. Thermocouple produces a voltage output according to temperature. But this voltage should be filtered and linearized. Therefore, in this study, a control device (EMKO ESM-4400) is used. This device produces 0–10 V linear voltage output for measuring range of thermocouple. Measured voltage for thermocouple converted the temperature by using formula (2):

where T is thermocouple temperature (celsius) and Vread is thermocouple control device output voltage.
The engine speed has been read from the counter inlet of the DAQ card by means of encoder. The encoder measures the output pulse intervals from outlet of channel Z. Channel Z of the encoder gives a pulse for every 3600. Hence, the interval between the two pulses taken consecutively from the Z channel of the encoder represents the period taken to complete a cycle. Therefore, counter inlet of the DAQ card and the Z channel pulse interval have been measured in seconds. The measured cycle time is divided by 60 and so it is converted to rev/min. Load of the motor has been measured with a load cell connected to the dynamometer force arm.
The fuel consumption in mass has been measured by using the load cell that has 0.1 g accuracy and connected to the fuel tank. The mass of the fuel tank during the test has been read at the beginning of the experiment and at the end of the experiment and then the difference has been divided by total test time and so the instantaneous mass fuel consumption has been measured as g/s.
The throttle control has been controlled by the servomotor and the servomotor has been controlled by using digital outputs of the data acquisition card too. This digital output produces a PWM signal for servomotor driving. The PWM signal is produced by hardware timer module of DAQ card.
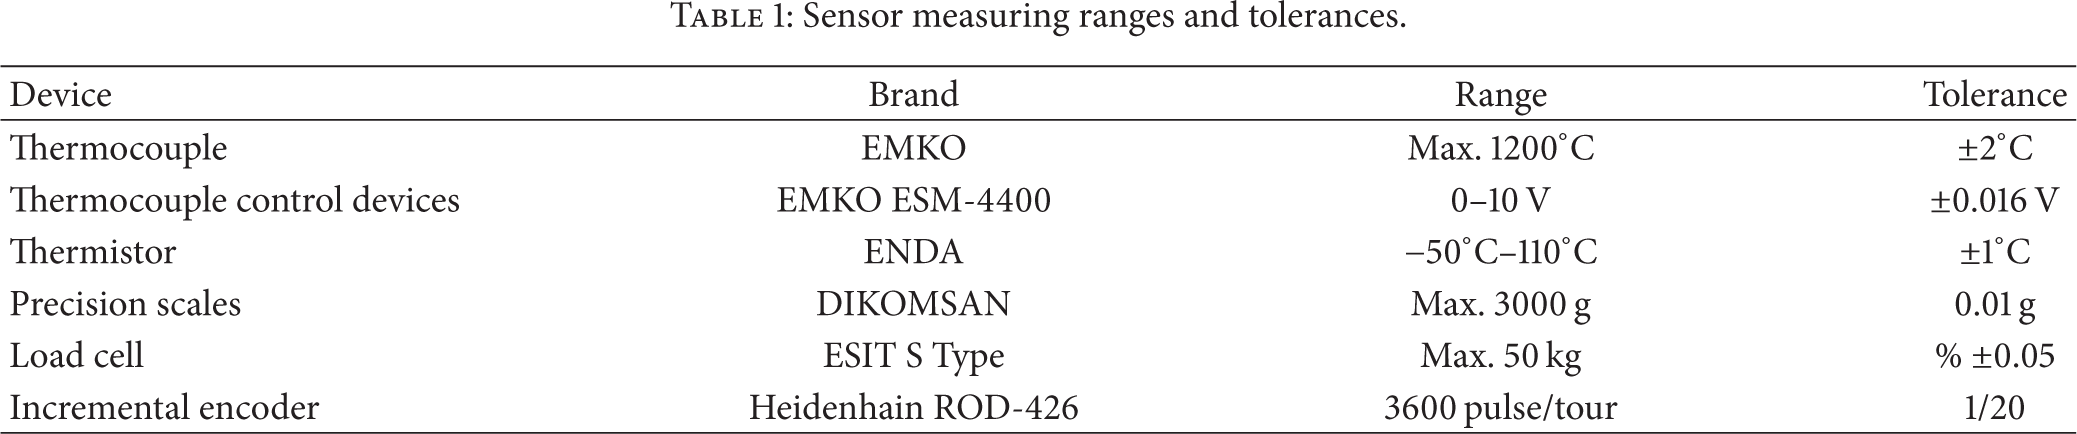
The control of motor load has been achieved by changing the voltage value of the electric dynamometer. These voltage values have been controlled by using the analog outputs of the data acquisition card through the interface. The minimum and maximum voltage values of the dynamometer panel have been determined and these values have been entered to the interface as the lower and upper limits. The interface can realize load control of the dynamometer by voltage control of the lower and upper limits. Ranges and tolerance of measuring devices used in this study are given in Table 1.
Sensor measuring ranges and tolerances.
In the experiments, an emission device branded BILSA has been used to measure emissions. This device can communicate with the designed interface by means of serial port (RS-232) in real time. The resulting emissions are recorded as log file. This electronically controlled test system provides that the engine test steps are automated, the measured values can be seen on the interface, and the test results are recorded. Designed interface can be used for both modes as manual control and full-load test mode.
After preparing experimental setup and LabVIEW programs for measurement, systematic errors have been calculated and are given in Table 2.
Systematic errors.

2.1. Manuel Control Mode
In the manual control mode, the test unit is controlled by the user manually. Position of the throttle control and the voltage value applied to the dynamometer can be controlled by the user in real time while the program is in manual control mode. Whereby, adjusting precisely the required speed and load can be possible. Furthermore, after setting the required speed and/or load, the data are recorded to the computer as log file through “Import data” button situated at the interface. Designed interface can be operated into the two modes including manual control and a full-load test mode. Also, in manual control mode, to perform partial load tests is aimed. In this mode, the system has opportunity to perform experiments in the partial load because load and speed are controlled by user.
2.2. Full-Load Test Mode
In full-load test mode, the control of the system is taken from the user and all of the activities are controlled by the designed interface. In this mode, the desired engine speed is entered into the interface of the system and then the start button is pressed and so the designed interface controls the throttle control in its initial state. At the same time, the voltage value at ends of dynamometer is increased and so reaching to maximum motor speed is prevented. After the throttle control arrives at the full throttle position, value of the voltage applied to the dynamometer is changed by the program until the desired speed is achieved. When the desired motor speed is achieved by means of the program, the system waits to remain constant the exhaust temperature data and the data are saved to the computer as log file when the temperature reaches a constant value.
If a full-load test is required, after the mode is selected, it is sufficient that the user only enters the desired speed value. Desired test conditions can be accomplished by obtaining the desired speed value as a result of the load control. The operating principle of the full-load test mode is presented as the block diagram in Figure 3.
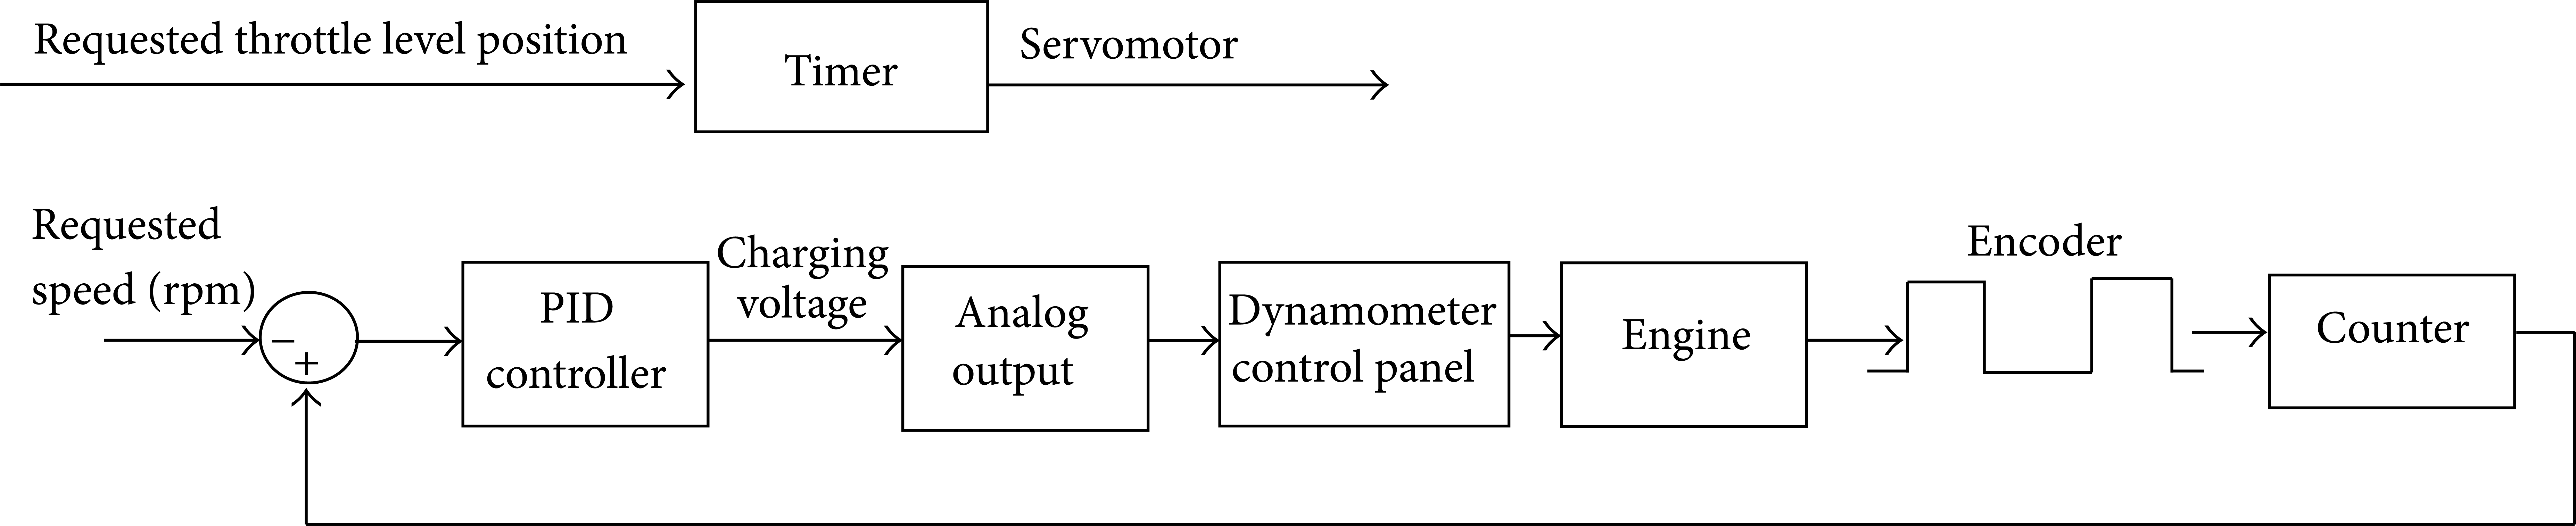
Block diagram of full-load test.
In full-load test mode, a closed-loop control system has been prepared to control the engine speed using the dynamometer load voltage. For the designed controller, the proportional control structure has been preferred. As is known, the response times of engine and dynamometer vary for different combinations of load and motor speed. Therefore, the adaptation of time-dependent structures such as PD (proportional derivative) or PID (proportional integral derivative) controllers to this system is highly difficult while they can quickly reach stability state. The proportional controller has been used because the accuracy is more important than the operational time to create desired experimental conditions. The proportional controller has been used because the accuracy is more important than the operational time to create the desired experimental conditions.
3. Experimental Studies
The experimental study has been performed on a two-cylinder and water cooled Lombardini SI engine. Engine test stand has been prepared with measurement devices mentioned above according to software and interface design. The characteristics of the engine used in the experiment have been presented in Table 3.
The Characteristics of the engine used in the experiment.

In this study, full-load test has been preferred as the first experiment and so the speed has only been entered in the user interface and then all of the procedures took place automatically without any user interaction. In this mode, the designed program switches throttle control and the dynamometer load to passive mode and does not allow user to interact. By entering speed value, the program sets to the desired speed value of the engine by itself. The program transfers the measured data to the computer when the exhaust temperature arrives to a constant value. The interface of the system during a test step has been presented in Figure 4.

The output of the interface taken during full-load test.
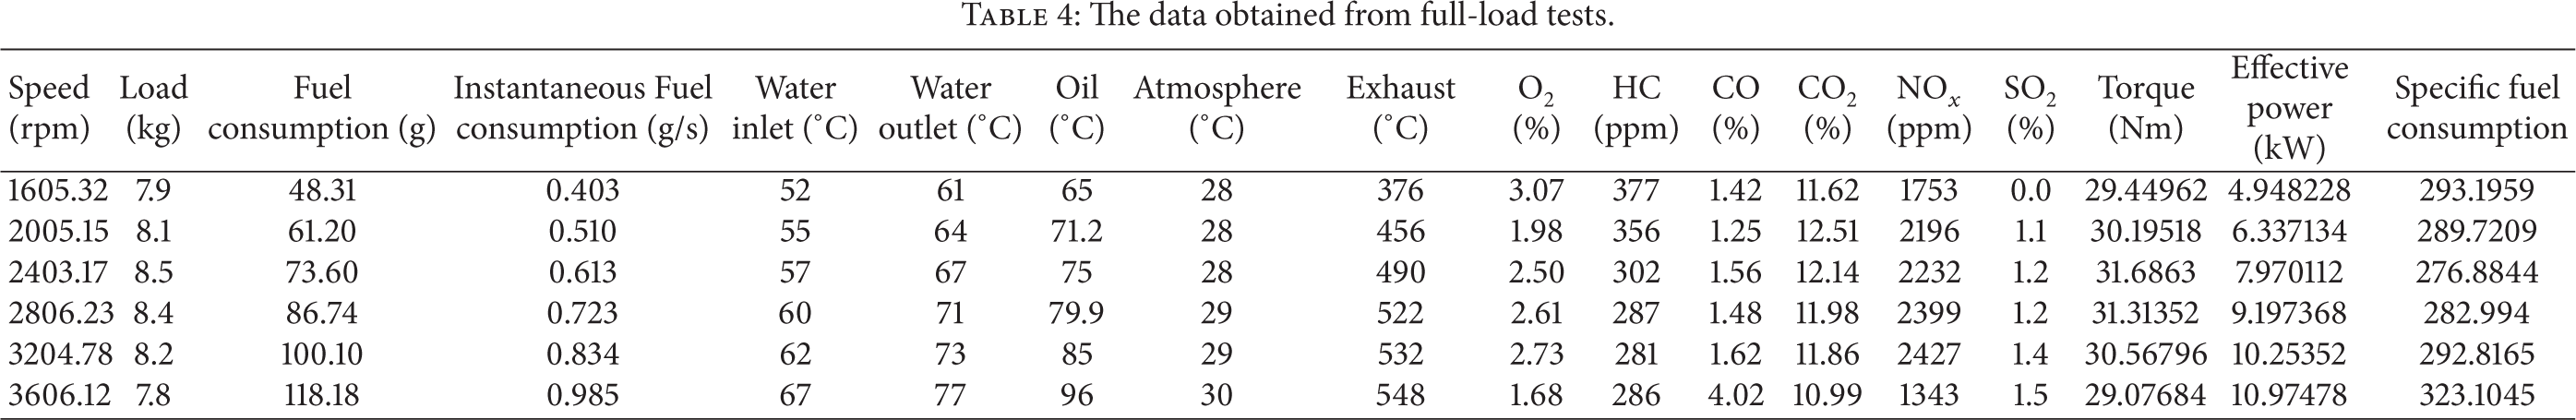
The experiments have been realized (carried out) in the engine speed range from 1600 rpm to 3600 rpm. The recorded data have been also transferred to excel program. The screen output in excel program of the obtained data for full-load tests has been shown in Table 4.
The data obtained from full-load tests.
The partial load tests have been performed at the manual control mode. In partial load tests, the throttle control and the dynamometer load are controlled by the user and the desired speed and/or the dynamometer load adjusted by the user. Data import process is realized by pressing the data acquisition button when the engine speed and/or the load reaches the desired values, if it is demanded by the user. The partial load tests have been also realized in the engine speed range from 1600 rpm to 3600 rpm and the system has received data at the beginning of each increase of 400 rpm as was done in the full-load test mode. Also, in this mode, the recorded experimental engine speed data can be transferred to excel program as in the full-load mode.
4. Results and Discussion
A gasoline engine is used in the experiment. The full-load limit is point that consisted of knocking. After the engine is worked at the WOT (wide open throttle), the throttle is fixed. Full-load test is made by changing the setting of the load on the control dynamometer. In this case, the load dynamometer control system is working to stabilize the cycles. Several tests have been performed for verification performance of the control system developed in this study. As a result of experiments, the engine speed has been fixed as error range of ±6 speed.
For verification, experiments are done with/without the engine control system in the same situations and results are compared. Also, torque, instantaneous fuel consumption, and effective power graphics have been drawn in excel. It has been shown that the engine performance curves are correct according to the graphs and so the developed system has been verified. Some of the performance and emission curves have been presented in Figure 5.
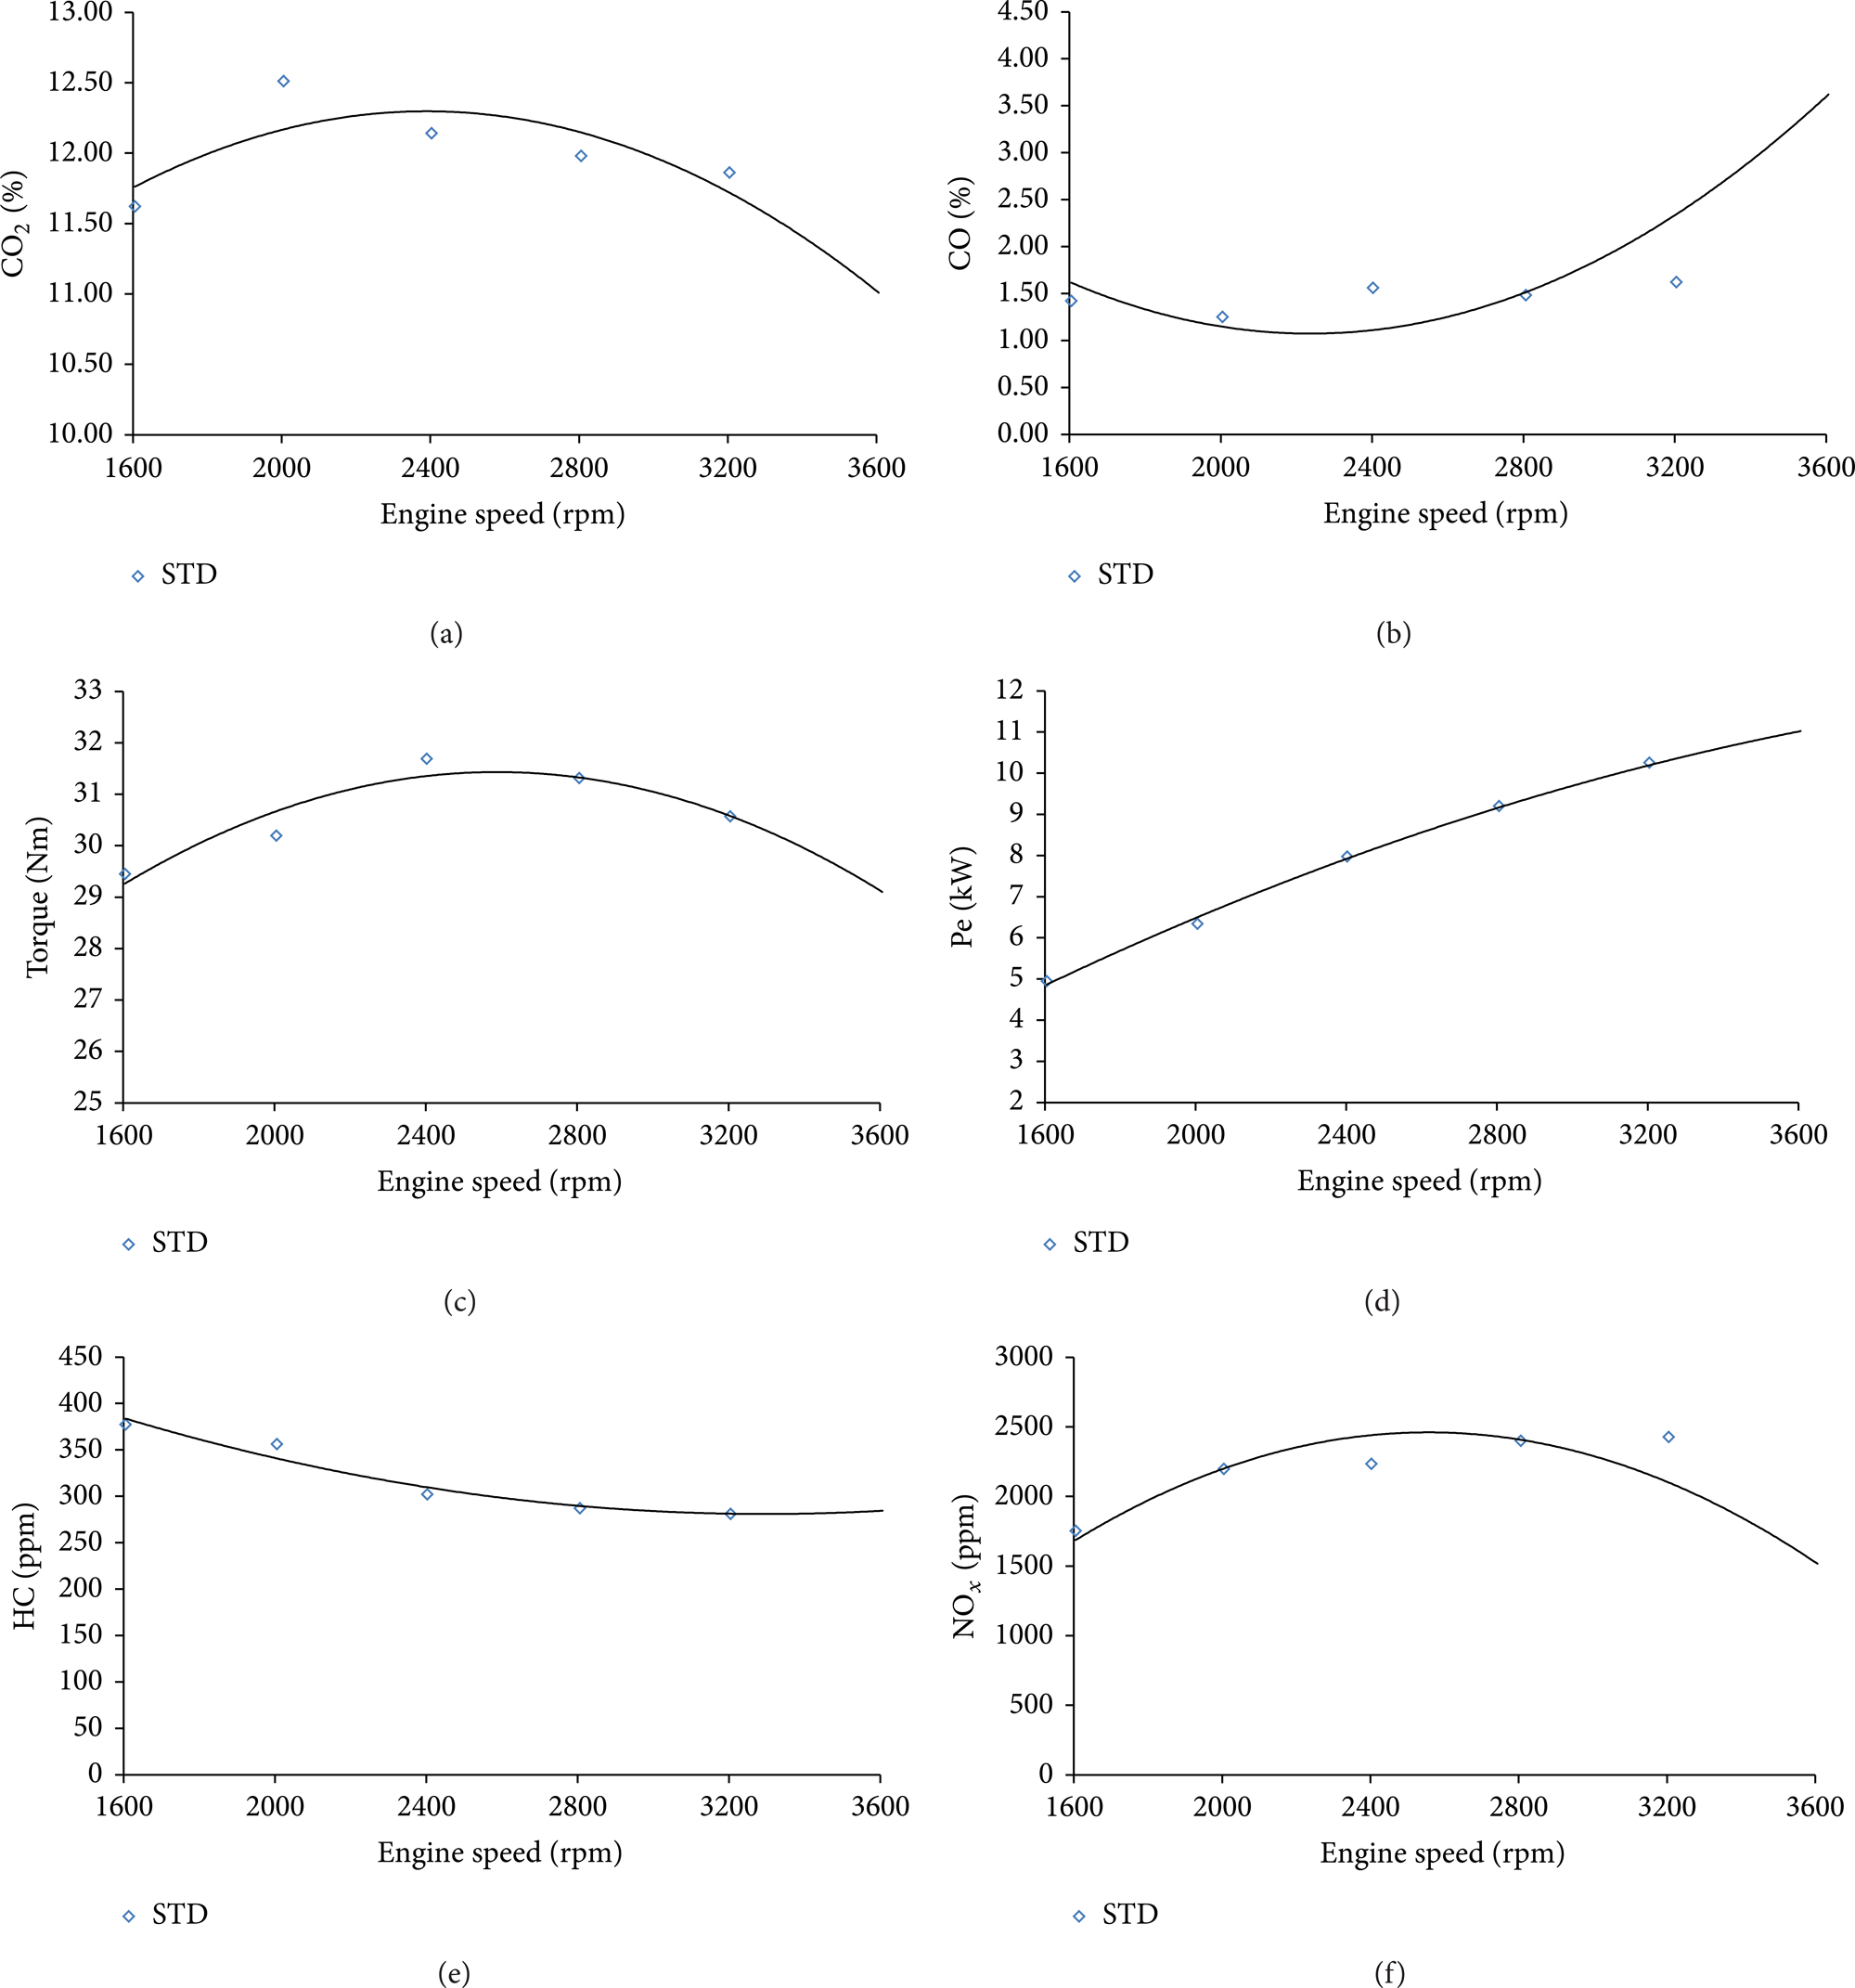
Some of the performance and emission curves.
5. Conclusions
In this study, the design of the control system of an internal combustion engine test unit has been developed and implemented. The developed data acquisition and control system have been successfully integrated with the mechanical structure of the available test stand. Finally, the verification tests have been realized by using the reference data proven to be true their results. The experiment results have showed that the designed system has a good performance to meet the expected requirement. The conclusions drawn from this study can be summarized as follows.
Thanks to the developed system, researchers have regained modern experimental environment. Henceforth, all processes of the manual engine test bench can be realized by the aid of computer in real time.
Engine performance parameters can be monitored and analyzed on the computer screen in real time by using the developed system.
The new system has superior properties such as the higher measurement accuracy, reliability, and the shorter measurement period according to the classical system. Also, the measurement errors are reduced.
Thanks to the user interface, testing and control operations have become easier so that even a person alone can perform all the experiments.
In addition to scientific studies, it will contribute to education and training activities especially in distance education because it has rich visuals. It is usually difficult to teach students who do not have an automation and engine background. However, to use this system will help students in understanding important test functions.
The measurements can be recorded easily, and so the relations between the different parameters can be observed more easily.
The cost of the system is very low according to its commercial competitive products which have similar characteristics.
Remote measurement capability of the system provides noiseless and safer working environment to the test personnel.
We hope that the developed system will provide an important contribution for researchers, employees and education-training activities. The research results provided a foundation for the further study. Future step based upon this work will be on the internal combustion engine tests using artificial intelligence technologies as control algorithm.
Footnotes
Nomenclature
Conflict of Interests
The authors declare that there is no conflict of interests regarding the publication of this paper.
Acknowledgments
This study was supported through the interdisciplinary project numbered 2012-05-04-012 by Sakarya University, Head of Scientific Research Commission. The authors gratefully acknowledge the sponsoring of this work by Sakarya University, Commission for Scientific Research Projects.