
Abstract
In northern China, temperature is below zero degrees Celsius more than six months in a year. The buses lacked power and temperature in winter. In order to study the universal parameter of power system, 40 bus lines were selected. The bus lines came from the cities of Changchun, Jilin, Tonghua, and Songyuan. Driving cycle's data was collected by an experiment with the real urban bus in two years. After defining the kinematics fragments and characteristic parameter, 13660 divided kinematics fragments and 13 selected kinematic eigenvalues composed a matrix. After reducing the matrix by principal component analysis, the matrix has been reconstructed including the kinematics fragments and the corresponding principal component score. The 13660 kinematics fragments were divided into three categories by fuzzy C-means clustering. On this basis, abnormal data were removed by Pauta criterion. Then according to the characteristic parameter of kinematic eigenvalues, a model on engine power and driving cycles was built, which included the heating power in the winter. Finally, three sets of power-weight ratios were calculated by the weight and volume of the traditional local bus. The buses which are configured with this method have enough power to provide warm carriage.
1. Introduction
In increasingly congested city traffic, the development of urban bus has received more and more attention in the whole world. In order to compete against private cars, a bus should provide a suitable environment. In northern China, temperature is below zero degrees Celsius more than six months in a year. A warm carriage is very important. Therefore, the study on universal parameter of power system for urban bus in cold region is necessary.
Currently, the study on bus power system is divided into two categories: (1) from the perspective of fuel economy and the driving range, optimizing the power and transmission system of individual models [1–3] and (2) according to the national standard, optimizing the power and transmission system in the extreme condition [4–7] such as studying the driving range of electric buses and optimizing the power and transmission system of individual bus in individual city based on fuel economy and general technical standard of urban bus for several southern cities. But, for cold region, in the case of considering the heating power, the study on universal parameter of power system for urban bus was not reported.
So, on the base of traditional driving cycle's construction method [8–10], the abnormal kinematics fragments were removed by Pauta criterion. According to the processed data, the driving cycles which are closer to daily drive were obtained. Then a model on engine power and driving cycles was built, which included the heating power in the winter. Finally, three sets of power-weight ratios were calculated by the weight and volume of the traditional local bus.
2. Construction of the Driving Cycles
The cities of Changchun, Jilin, Songyuan, and Tonghua, China, were chosen to be text cities. An experiment system was constructed based on the urban bus, ECU data reader, VBOX-GPS, and VBOX accelerometer. The time of the experiments was January 2013, October 2013, and January 2014. The temperature is below −20 degree centigrade during January and the road was covered with snow during January 2013.
2.1. The Selection of Test Line
10 bus lines were selected from each city, including 2 trunk lines, 2 subtrunk lines, 2 spur branches, 2 circle lines, and 2 lines to the suburbs [11]. Experimental data were obtained in total 329,750 seconds. The data was shown in Table 1.
Experimental data of hybrid bus.

2.2. The Selection of the Characteristic Parameter and Dividing of the Kinematics Fragments
The process of vehicle driving cycles was divided into four kinds. (2) Idling condition means that the engine is running and the vehicle speed is V = 0 in the process of moving. (3) Uniform condition means that the vehicle acceleration is |a| < 0.15 m/s2 in the process of moving. (4) Accelerating condition means that the vehicle acceleration is a > 0.15 m/s2 in the process of moving. (5) Decelerating condition means that the vehicle acceleration is a < − 0.15 m/s2 in the process of moving [12].
Because the vehicle driving parameters are very complicated in the process of moving, describing the driving cycles with speed and acceleration is not enough, and it is an unnecessary trouble in calculation and theoretical analysis that too many vehicle driving parameters are chosen. So, 13 vehicle driving parameters were chosen as the parameters of driving cycles based on the 4 kinds of conditions; the details were shown in Table 2.
Characteristic parameter.

The average operation speed means the average speed except idling condition.
During operation of the bus, the times of starting, accelerating, and decelerating appear very frequently. In order to calculate and analyze expediently, the kinematics fragments were defined from one stop to the next stop. 13660 kinematics fragments were obtained by the definition.
2.3. Preliminary Data Analysis
After defining the kinematics fragments and characteristic parameter, 13660 divided kinematics fragments and 13 selected kinematic eigenvalues composed a matrix 1 [13].
2.3.1. Principal Component Analysis
Principal component analysis is a method of mathematical transform. It turns a group of related variables to another uncorrelated variable. These new variables are arranged in descending order of variance. Total variance of variables is kept unchanged in the mathematical transformation. When the first variable has the largest variance, it is called the first principal component; when the second variable has the second largest variance, although it is not related to the first variable, it is called the second principal component. And by this analogy, the numbers of principal components equal the numbers of variables.
Set X covariance matrix Σ; then Σ will be for the positive semidefinite symmetric matrix, eigenvalue λ i (in descending order), and feature vectors; it can be proved that λ i corresponding orthogonal eigenvectors, namely, Ith principal component Z i corresponding coefficient vector L i , while the variance contribution rate Z i is defined as λ i /Σλ j , generally the extracted K number of principal components required to satisfy Σλ k /Σλ j > 0.85.
Matrix 1 was analyzed by principal component analysis; a component matrix was obtained. It was shown in Table 3.
Component matrix.

According to the formula
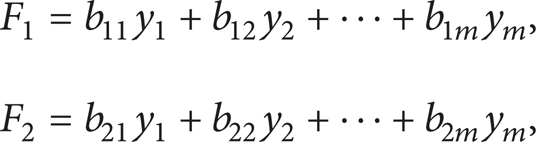
where F is the score of principal component, b ij is the corresponding component matrix coefficient, and y m is the eigenvalue matrix after standardization, a 13660 × 2 principal component scores matrix was obtained after putting into the formula.
2.3.2. Fuzzy C-Means Clustering
Fuzzy C-means clustering is a clustering algorithm based on the objective function. In the fuzzy C-means clustering, each data point according to some fuzzy membership belongs to a cluster center. Firstly, select a number of cluster centers, iterative process with a minimum of all the data points to a weighted distance and the membership value of each cluster center and for the optimization objectives.
Set O = {O1, O2, …O
s
} contains S elements. The S elements are divided into C kinds. 2 ⩽ C < S. The center of the C kinds is B = {B1, B2, …B
c
}. Set
The obtained matrix in Section 2.3.1 was classified by fuzzy C-means clustering [14, 15]. After several attempts, three kinds could subscribe the condition of the bus driving cycles better [16]. It was shown in Figure 1.

Fuzzy C-means clustering.
After comparison with kinematics fragments, the green kind means stop-and-go condition, the blue kind means low speed condition, and the red kind means medium speed condition. Inside the stop-and-go condition is peculiar condition of urban bus.
2.4. Removing Abnormal Data
As shown in Figure 1, some points were far from the center of clustering. This is mainly due to the following reasons: (1) the text road was covered with snow, the bus was usually slipped during starting and accelerating as there was no skid resistance measure; (2) in bus operational process, driver may drive fast to get to the next station on time, thus taking the different driving behavior from peacetime; (3) viaduct in the city could make the GPS lose signals, and the corresponding kinematics fragments would be error prone. In the previous research experience, according to the built driving cycles, the tested vehicle occasionally cannot operate on the chassis dynamometer. Therefore, the abnormal condition should be removed.
2.4.1. Pauta Criterion
The basic idea of Pauta criterion is the given confidence probability 99.7%; the standard is 3 times of this error. The error over the standard should be removed.
The abnormal data were removed by Pauta criterion. The result was shown in Figure 2 after removing 169 abnormal points.

The clustering after removing the abnormal data.
After comparing Figures 2 and 1 it can be found that some point far from cluster center has been removed. The kinematics fragments subscribed by the remaining points can be used to characterize configuration parameters of the power system.
3. The Configuration of Power System
After removing abnormal data, the characteristic parameter of overall data was shown in Table 4.
The characteristic parameter of overall data.

The average operation speed means the average speed except idling condition.
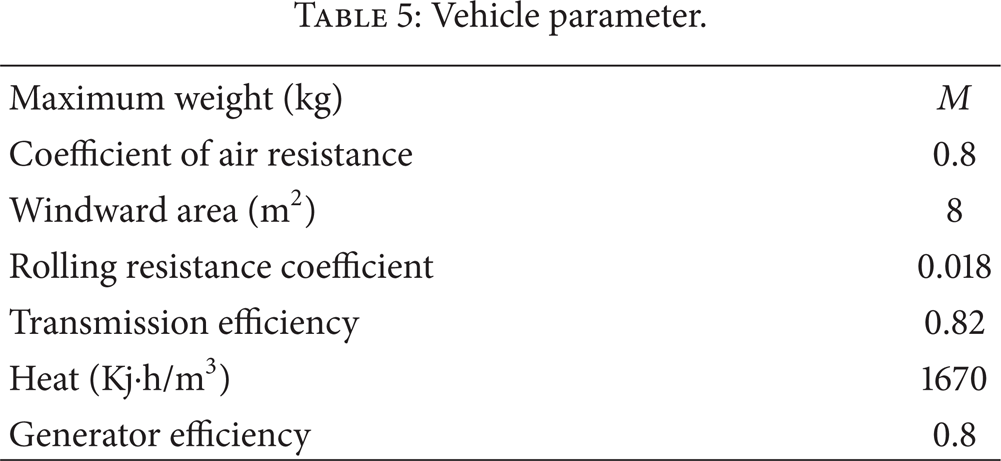
As one model or several models of bus were adopted in a region, the vehicle parameter was similar. Referring to the actual situation of the vehicle and the local standard, the parameter in calculation is shown in Table 5.
Vehicle parameter.
3.1. Power-Weight Ratio Model
The power-weight ratio is an important parameter of power system. It can guide the urban bus production for the region. When vehicle operates on the good horizontal road at maximum speed, the power-weight ratio reaches the minimum requirements:

where P e is minimum power, η T is transmission efficiency, f is rolling resistance coefficient, C D is coefficient of air resistance, and A is windward area. Consider

where H is heat power, η G is generator efficiency, and V is volume of carriage.
A new formula was constructed with formula (2) and (3):

The model of power-weight ratio was obtained by putting the parameters of Tables 3 and 4 into formula (4):

Formula (5) is the model on engine power and driving cycles, which included the heating power in the winter.
3.2. Typical Power-Weight Ratio
There are three typical sets of urban buses in the experiment. They were shown in Table 6.
Typical sets of buses.

Put the maximum weight and carriage volume in Table 6 into formula (5); the power-weight ratios which were calculated by the built model were shown in Table 7.
The comparison of power-weight ratio.
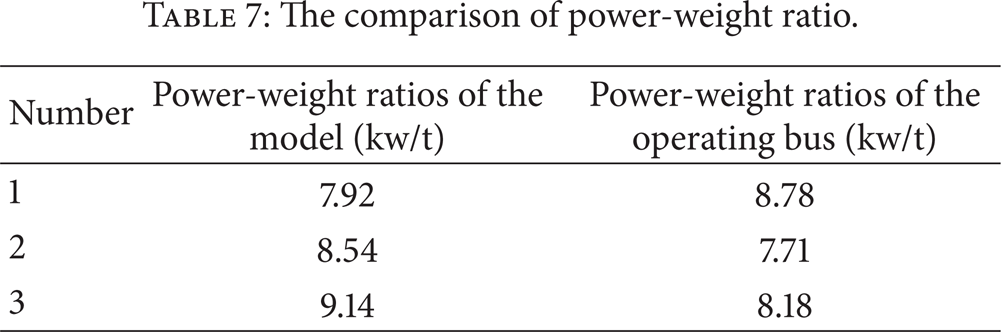
The comparison showed that the calculated power-weight ratios by the model were similar to the operating bus. But the calculated value is the minimum value. For bus number 1, the engine power was enough in operation when the air-conditioning was heating. But the model proved that if the bus drives at the nominal maximum speed, there is not enough power for heating, and if the bus drives at the maximum speed in driving cycles, the reserve-power is not enough. For buses number 2 and 3, the engine power is not enough to give passengers a warm carriage. These situations were the same as the actual situation in the experiment.
4. Conclusions
From the above, the following conclusions were obtained.
329750-second data were obtained from 4 cities in two years. After defining the kinematics fragments and characteristic parameter, 13660 divided kinematics fragments were obtained. The kinematics fragments were divided into three categories by principal component analysis and fuzzy C-means clustering: stop-and-go condition, low speed condition, and medium speed condition.
On this basis, three reasons of the abnormal data were analyzed. Abnormal data were removed by Pauta criterion. 169 abnormal kinematics fragments were removed. The driving cycles of the 4 cities were obtained: the maximum travelling speed is 18.056 m/s. According to the characteristic parameter of kinematic eigenvalues, a model on engine power and driving cycles was built, which included the heating power in the winter.
Three sets of power-weight ratios were calculated by the weight and volume of the traditional local bus. By comparing to the actual operating bus, the model accurately reflects the actual situation of the bus in experiment: for some buses, if the bus drives at the nominal maximum speed, there is not enough power for heating, and if the bus drives at the maximum speed in driving cycles, the reserve-power is not enough; for another bus, the engine power is not enough to give passengers a warm carriage. It proved that the bus working in the cold region needs a higher level power system and provided the basis in order to formulate the cold region standard of urban bus. The buses which are configured with this method have enough power to provide warm carriage.
Conflict of Interests
The authors declare that there is no conflict of interests regarding the publication of this paper.
Footnotes
Acknowledgment
This paper was sponsored by urban bus common technical standards in cold region (2012-2-7).