
Abstract
It is a general agreement that hemodynamics plays very important role in the initiation, growth, and rupture of cerebral aneurysms and hemodynamics in the anterior communicating artery aneurysms is considered the most complex in all cerebral aneurysms and it is difficult to find some reasonable relationship between the hemodynamics parameters and the rupture risk. In this paper, the 3D geometries of four anterior communicating artery aneurysms were generated from the CTA data and the computational models with bilateral feeding arteries for the four aneurysms were constructed. The blood flow was simulated by computational fluid dynamics software and the hemodynamics parameters such as velocity, wall shear stress, and oscillatory shear index were calculated. The following results were observed: one of the four models only needs the left feeding artery; the max normalized wall shear stress locates at the aneurysmal neck of the largest aneurysm; the max oscillatory shear index locates at the aneurysmal sac of the largest aneurysm. The conclusion was drawn that the anterior communicating artery aneurysm has higher rupture risk from the hemodynamics viewpoint if the max wall shear stress locates at the neck and the max oscillatory shear index locates at the dome.
1. Introduction
Cerebral aneurysms are pathologic dilations of the cerebral arteries generally occurring in the anterior and posterior regions of the circle of Willis. Rupture of a cerebral aneurysm causes subarachnoid hemorrhage with an associated high mortality and morbidity rate [1]. The mechanisms responsible for the initiation, evolution, and rupture of cerebral aneurysms are not well understood until now. However, it is widely accepted that hemodynamic characteristics such as wall shear stress (WSS), velocity, vorticity, flow impingement, and pressure play an important role in the progression of aneurysms [2].
According to several large studies [3–5], the proportion of the anterior communicating artery (AcomA) aneurysm in all cerebral aneurysms is more than 25%. Because of the complexity of the geometry and the flow conditions, hemodynamics in the AcomA aneurysms is considered the most complex in all cerebral aneurysms [6]. Aneurysms in the AComA are more likely to have asymmetric A1 segments [7] and furthermore to have exclusive filling angiographically from one A1 segment in up to 78% of cases [8]. Tarulli and Fox [9] performed a radiological examination and found that A1 dominance configuration is strongly associated with the presence of AComA aneurysms for 105 patients with intracranial aneurysms at that location. Hassan et al. [10] performed a sensitivity study using idealized computational models of the anterior communicating artery and found that aneurysms located in the AComA with differences of 50% or more between the two A1 areas are subjected to more flow stresses. Experimentally, an AComA aneurysm can be produced in hypertensive rats by unilateral ligation of the common carotid artery [11], further supporting a causative relationship between increased flow and aneurysm formation. A computational study found a possible correlation between AComA aneurysm formation, growth, and rupture with A1 dysplasia or hypoplasia. Increased WSS was found in the bifurcation when the diameter of the nondominant A1 segment decreased [12]. Previous in vitro modeling provided evidence of this effect. Using a silicone replica of a lethal anterior communicating artery aneurysm and imaging of fluid slip streams, it was observed that with symmetrical flow conditions slip streams rarely enter the aneurysm, but with asymmetric alterations in flow complicated flow patterns were identified within the aneurysm [13].
Castro et al. [14] performed a patient population study that included twenty-six computational hemodynamics models of AComA aneurysms, which showed interesting associations between flow patterns and aneurysm rupture. Karmonik et al. [15] showed that hemodynamic patterns changed when flow rates at the A1 segments are altered with respect to the baseline defined by PC-MRI flow measurements in the same patient, but keeping the total flow rate unchanged. The maximum change observed in the aneurysm average WSS when increasing the right AComA flow rate to 68% was as high as 43%. According to the data presented in that paper, the model only included the A1 and A2 segments of the AComA; therefore, it is not clear if those differences would be so relevant when normalized flow rates are imposed at the ICAs. However, it is clear that using patient-specific inflow conditions would help in minimizing the effects of model assumptions. Recently, Hodis et al. [16] performed a CFD analysis of the hemodynamics of an AComA that spontaneously ruptured immediately following three-dimensional rotational angiography. Subsequent digital subtraction angiography allowed for the localization of the point of rupture within the aneurysm dome. CFD analysis demonstrated a concentrated jet that impinged directly at the site of rupture. The authors reported that peak systolic pressure and WSS were both maximal near the rupture location.
In this paper, the 3D geometries of four AComA aneurysms were generated from the CTA data and the computational models for the four aneurysms with bilateral feeding arteries and four outlet arteries were constructed. The blood flow in the four aneurysms was simulated by CFD software and the hemodynamics parameters such as velocity, wall shear stress, and oscillatory shear index were calculated. By analyzing and comparing the difference of the hemodynamics in the four AComA aneurysms, the association between hemodynamics parameters and rupture risks in the AComA aneurysms was concluded.
2. Materials and Methods
Four patients suffering from AComA aneurysm were obtained from Huashan Hospital affiliated to Fudan University and the patient data is demonstrated in Table 1.
The patient data of the four aneurysms.

2.1. Geometry Model
3DRA data can only construct the unilateral internal carotid artery (ICA) but the AComA aneurysm has bilateral feeding ICAs. In order to have the bilateral ICAs of the AComA aneurysms, the geometries of the four aneurysms were constructed from the CTA data. After image processing such as segmentation and smoothing, the final geometrical models are shown in Figure 1. The sizes of the four aneurysms are demonstrated in Table 2 and definition of the size, width (W) and height (H), is shown in Figure 2.
The geometric sizes of the four aneurysms.


The patient-specific models of four AComA aneurysms.

The size definition of the aneurysmal sac.
2.2. Numerical Model
The computational grids for the four models were generated by mesh generator software ICEM-CFD 12.1 (Ansys Inc., Canonsburg, PA, USA). The meshes composed by tetra elements were specified in terms of the size as follows: the value between 0.2 mm and 0.3 mm was set to the max element size of the four aneurysm models, and the average element number per cubic millimeter in the four models was about 1800 in order to obtain the mesh-independent results. The geometry of the original aneurysm was divided into two parts, the aneurysm sac part and the parent artery part, by the interface at the aneurysm neck, but the parameters for the mesh generation of the two parts were the same. Figure 5 shows the computational grid of the model AcomA-4 and Table 3 demonstrates the numbers of elements and nodes in the computational grids of the four models.
The numbers of elements and nodes in the computational grids of the models.

The vessel wall was assumed rigid with no deformation because of lack of information about the wall thickness and material properties. The pulsatile velocity shown in Figure 3 was imposed at the inlets of the models and the flow rate of each inlet depended on the cross-section area. As Castro et al. reported that the phase shift between the pulsatile velocities at the two inlets had little effect on the numerical results [17], no phase shift was assumed to the pulsatile velocities at the two inlets. The boundary conditions at the four outlets were traction free and the flow rate at each outlet was assigned according to its cross-section area and the total flow rate satisfied mass conservation. Figure 4 shows the multiply inlets and outlets in the model AcomA-4.

The velocity profile imposed at the inlets.

Boundary conditions imposed at the inlets and outlets. The two inlets (the right and left ICAs) were imposed by the pulsatile velocities and the four outlets (the right and left MCAs and ACAs) were imposed by traction free condition.

The computational grid of the model AcomA-4.
2.3. Numerical Scheme
The computational grid was imported into the commercial CFD package ANSYS CFX 12.1 (Ansys, Inc., Canonsburg, PA, USA) to simulate the blood flow in the four models. Blood flow in the cerebral artery was assumed to be incompressible and laminar and satisfied the Navier-Stokes equation and continuity equation. The finite volume method based on first order and second order upwind scheme was employed to obtain the solution both for the pressures and the velocities at each time step. The second order backward Euler scheme with a time step Δt = 0.001 s was implemented for time discretization. The convergence criterion of simulation was that the residuals of velocity and mass were less than 1e−5. The blood flow in the two cardiac cycles was performed for each simulation in order to obtain stable results independent of initialization, and the data in the second cycle was selected as the numerical results.
3. Results and Discussion
Ansys CFD-post 12.1 was utilized to process the numerical results. The 3D flow patterns in the four model are presented by the streamlines and the complexity and stability can be easily recognized. Wall shear stress (WSS) is a very important hemodynamics parameter and is considered to be related to the initiation and rupture of the aneurysms; thus the distributions of WSS and other derivative such as time average wall shear stress (TAWSS) and oscillatory shear index (OSI) on the four AComA models are analyzed.
3.1. Streamlines
Figure 6 demonstrates the streamlines in the four models; the red streamlines and the blue streamlines represent the flow coming from left and right ICA, respectively. The flow direction in the anterior communicating artery is determined by the pressure of the two anterior arteries. In AComA-1, the flow direction in AComA is from left to right and blood from the left A1 flows into the aneurysmal sac but there is almost no vortex formation and the flow pattern is very simple. In AComA-2, the flow direction in AComA is from left to right; there is no flow in the right A1 and blood from the left A1 flows into the aneurysmal sac and there is a small vortex; therefore the AComA-2 model only needs the left ICA as the feeding artery. In AcomA-3, the size of the aneurysmal sac is the largest; the flow direction in AComA is from right to left; blood from the right A1 flows into the aneurysmal sac and there is complex flow pattern formation. In AcomA-4, the flow direction in AComA is from left to right; blood from the left A1 flows into the aneurysmal sac and there is no vortex formation.

The streamlines in the four AcomA aneurysms.
3.2. Wall Shear Stress
Wall shear stress is considered to be one of the most important hemodynamic parameters related to the initiation, growth, and rupture of cerebral aneurysms [18]. There are several derivative parameters from wall shear stress such as time average wall shear stress (TAWSS) and oscillatory shear index (OSI):


where
Figure 7 shows the distribution of TAWSS on the four models. We focus on the aneurysmal sac and the parent vessel connecting to the aneurysm. In AComA-1 model, the max TAWSS locates at the neck of the aneurysm. In AComA-2 model, the max TAWSS locates at the downstream bifurcation of the left A1. In AComA-3 model, the max TAWSS locates at the downstream bifurcation of the right A1. In AComA-4 model, the max TAWSS locates at the neck of the aneurysm. The value of max TAWSS on the four models varies from 4.9 Pa to 14.6 Pa. Figure 8 shows the distribution of OSI on the four models. The value range of OSI is from 0 to 0.5 and the higher OSI region indicates flow direction change during a cardiac cycle. In the four models, the max OSI locates at higher curvature of the dome of the aneurysmal sac.

The distributions of TAWSS on the four AcomA aneurysms.

The distributions of OSI on the four AcomA aneurysms.
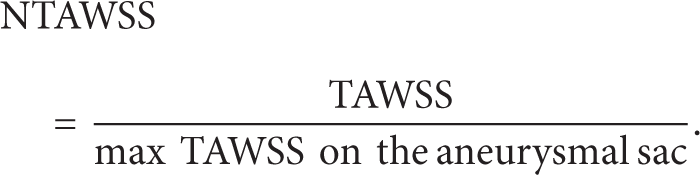
Because the value of wall shear stress depends on the geometry and the inlet boundary conditions of the aneurysm models, NTAWSS (the normalized TAWSS) is defined to investigate the relative variations of TAWSS on the four models in order to reduce the influence of the geometry. Figure 9 shows the distributions of NTAWSS and OSI on the aneurysmal sacs of the four models:
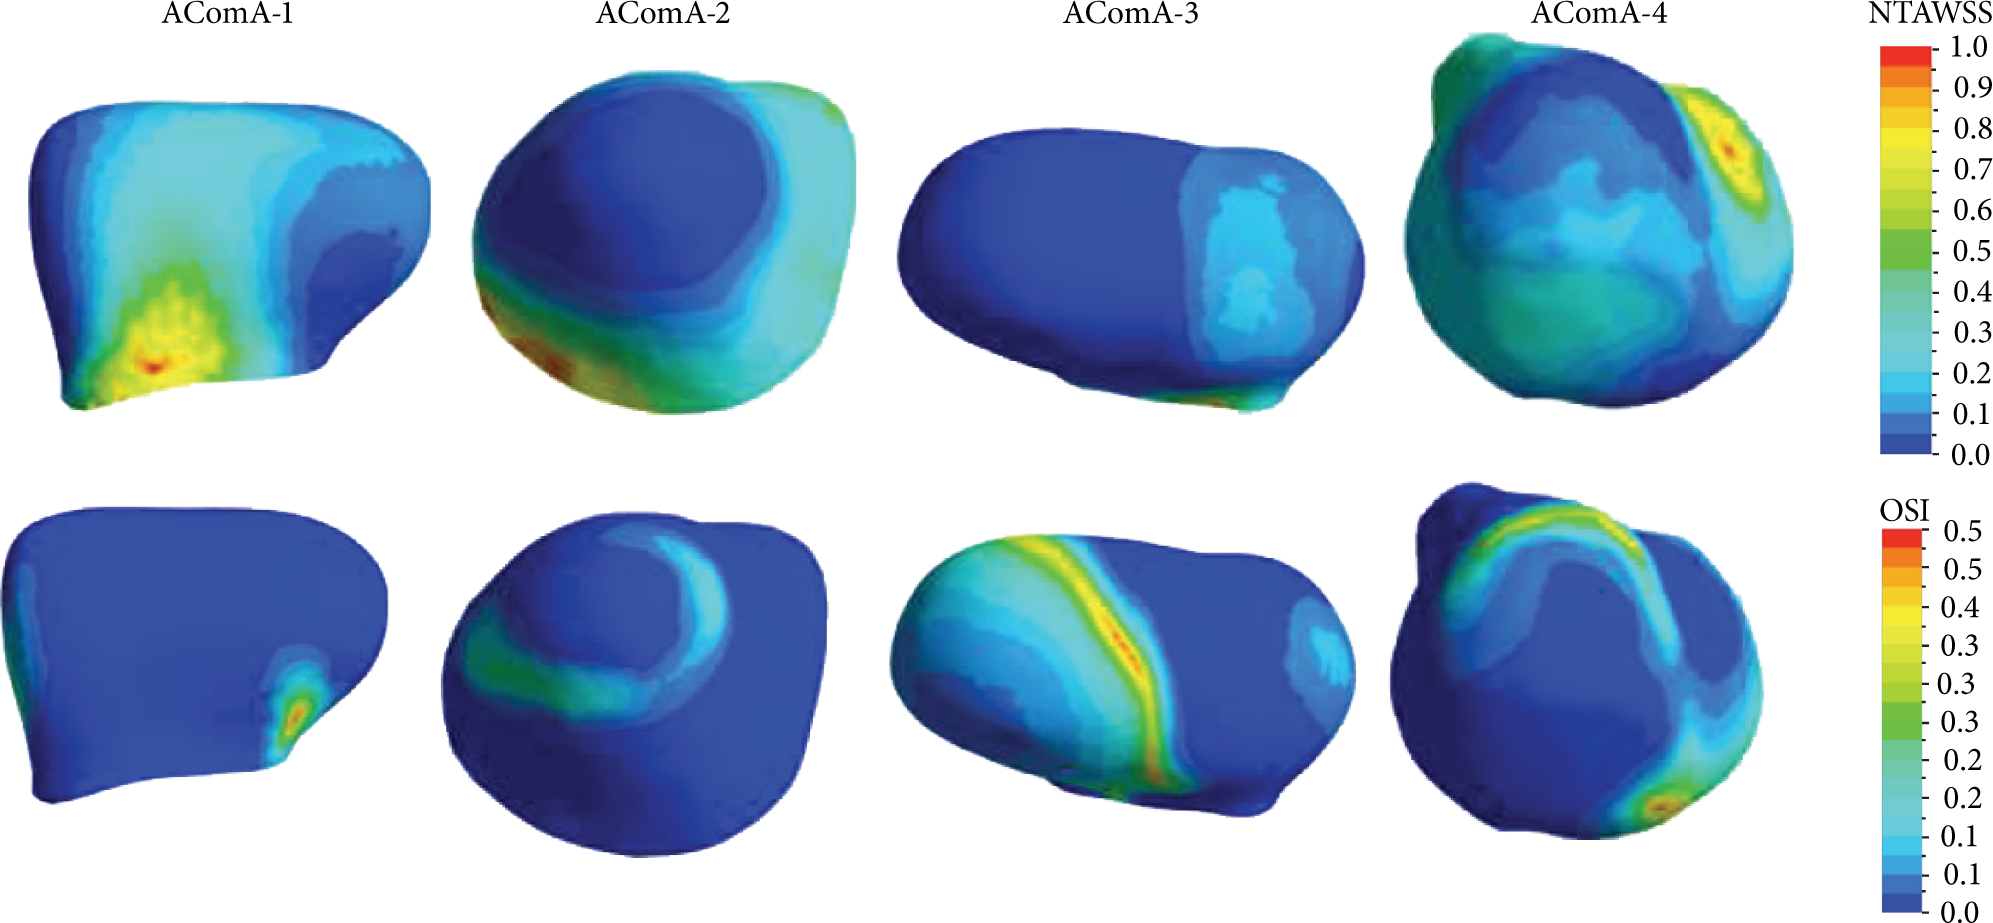
The distributions of NTAWSS on the four AcomA aneurysmal sacs.
Higher WSS is considered to trigger a mural-cell-mediated pathway, which could be associated with the growth of the aneurysm, while higher OSI will trigger an inflammatory-cell-mediated pathway, which could be associated with the rupture of the aneurysm [19]. If the aneurysm has higher WSS at the aneurysmal neck, then it has very high possibility to grow larger. Meanwhile, if the aneurysm has higher OSI at the aneurysmal dome, then the endothelium will degenerate. Both the higher WSS at the aneurysmal neck and the higher OSI at the aneurysm dome will reduce the thickness of the aneurysmal wall, weaken the mechanical property, and increase the rupture risk of the aneurysm. In AComA-3 and AComA-4, the max OSI locates at the dome and the max NTWSS loacates at the neck; therefore both may have the higher rupture risk. Actually, the clinician usually assesses the higher rupture risk for AComA-3 because it has the largest aneurysm in the four models, but it is difficult for the clinician to assess the rupture risk of the AComA-4 depending only on the size.
4. Conclusions
In this paper, four models of the AComA aneurysms were constructed from CTA image data. The models had the bilateral feeding arteries as inlets and four downstream arteries as the outlets. Imposing the pulsatile velocity at the inlets and traction free condition at the outlets, the blood flows in the four models were simulated by CFD software. Analyzing the flow pattern and the distribution of hemodynamics parameters, we have the following conclusions. (1) Unilateral feeding artery model for some AComA aneurysm such as the model AComA-2 is accurate enough. (2) If we assess the rupture risk of an AComA aneurysm only depending on geometric parameters or one hemodynamics parameter, there will be some contradictory conclusions. (3) An AComA aneurysm may have higher rupture risk if the max WSS locates at the aneurysm neck and the the max OSI (larger than 0.3) locates at the dome of the aneurysmal sac. The conclusion (3) coincides with the clinician assessment because it is the largest one in the four aneurysms, but it needs more cases to prove in the future.
Conflict of Interests
The authors declare that there is no conflict of interests for publication of this research.
Footnotes
Acknowledgment
The research was supported by the National Natural Science Foundation of China (Grant nos. 11102042 and 81371308).