
Abstract
There are two kinds of alignment systems, marked and unmarked. The glass substrate for touch panels is categorized as an unmarked work piece. Vision based glass substrate alignment (GSA) relies on the edge of the glass. Traditional GSA systems compensate first for angular and then for linear error. This reduces alignment accuracy and increases alignment time and edge detection usually takes longer than 10 ms. This study proposes an effortless edge detection method. This method is very simple and can significantly reduce the time taken to detect the edge to about 6 ms using a 1.3 megapixel image. In this study, a floating center idea is used to control the glass substrate on a high precision coplanar XXY alignment stage. According to the method, users can set the rotation center anywhere as long as it is on the working (xy) plane. Tolerance prognosis is also considered in this study to help the operator decide if the substrate is usable or should be rejected. The experimental results show alignment repeatability of the x, y, and θ axes to be 1 μm, 1 μm, and 5 arcsec, respectively.
1. Introduction
Recently, with the development of 3C, more and more component manufacturing processes have come to rely on high precision alignment systems, for example, the lamination and electrical testing of touch panels, their resistance, capacitance, linearity, electrical testing for open circuits or shorts, and the testing of PCBs and the manufacture of LEDs from wafers. A typical alignment system includes a stage and a vision servo system and the simplest system uses a camera and a stacked XY stage [1]. Note that it is referred to as “stacked” because the y-axis unit is installed above the x-axis unit. This kind of system only compensates for x-axis and y-axis errors and cannot correct any angular deviations. To solve this problem, a three-dimension alignment system, including two or more cameras and a stacked XYθ z stage, has been proposed. DD (direct drive) motors are used to control the movements on this stage [2] and although it can be easily controlled, cumulative mechanical errors influence positioning performance [3]. In recent years, many alignment systems have been changed to use coplanar types of stage for high precision alignment because these stages are faster than the stacked ones. This is because the coplanar stages have a lower center of gravity and less inertia [4]. Moreover, coplanar stages have higher angular resolution and cost less than DD motor stages. According to kinematic equations, the motors on a coplanar stage can be operated simultaneously to move the stage to the target position faster; this is very useful for quick alignment. For ultrahigh precision alignment, a piezoelectric based nanostage, which is complainer type of stage, is commonly used for high accuracy positioning or error compensation [5–7]. However, the piezoelectric based stages have nanograde positioning resolution and high sensitivity that are too expensive and a glass substrate alignment system does not need to use a compensation stage with nanograde resolution.
Generally, there are two types of aligned work piece: (1) marked printed/coated and (2) unmarked printed/coated. There have been many studies of different mark/pattern alignment systems [1, 8, 9]. Performance of the pattern alignment system is better than that of an unmarked alignment system because variations of the distance between the patterns is small, and patterns are clear and easy to detect and recognize [10]. Although the pattern alignment system has good performance, the work piece must be labeled with a mark on the surface; this limits application. For example, some touch panels have a flexible circuit board laminated with the glass substrate by a lamination machine. Note that in this case the glass substrate is an unmarked work piece. If the electric circuit can be directly printed on the glass substrate, the manufacturing procedure could be much simplified with a considerable reduction in cost. There is a clear need for the development of a high performance unmarked alignment system where the glass substrate can be aligned by corners or edges. However, corner alignment is synonymous with marked alignment and the presence of edge slope can affect the corner point position. Also, large corner arc/radii can result in difficulties in detection of the edges. This makes edge detection much more reliable than corner detection because edges have fewer defects. This study proposes a glass substrate alignment (GSA) system that uses both edge detection and angular alignment. Incidentally, another kind of unmarked alignment system has been developed that uses a moiré sensor [11].
The simplest GSA system uses two cameras only; one measures deviations of the x-axis while the other measures those of the y-axis. Angular deviation can be detected using either of the cameras. In general, the dimensional tolerances that need to be determined for a glass substrate are length, width, and geometric edge perpendicularity. It was found in this study that to do this with high precision an edge alignment system needs four or more cameras. However, in this study the perpendicularity of the edge of the glass substrate has been ignored because this makes the problem far more complex and difficult to analyze.
Canny proposed an edge detection method which has been used in many studies [12]. Many other methods have been developed including Laplacian-Gaussian, Huertas [13], and a wide range of others [14–16]. After the edges or contours have been found, the next step is to find the edge line for alignment and the Hough transform is a popular method for this purpose [17]. Although the edge line can be correctly found, the time taken is more than 10 ms. This does not include image preprocessing time such as image binarization, morphological operations, and derivative computation. The usual time interval between captured images for a 1.3 megapixel gray image camera is 30 fps (33 ms/frame). For a four-camera-edge alignment system, the image processing time for a single image needs to be less than 8 ms, with a total of 32 ms for four images processed. This is important because otherwise the image processing time will exceed the frame capture time of the camera and alignment speed and performance will be very low. If the total image processing time exceeds 33 ms, the frame-capture time will become 66 ms and this is unacceptable.
When the glass substrate is rotated about its center, the glass edge will be offset both linearly and angularly as shown in Figure 1. Thus, a traditional edge alignment system first compensates for the angular error and then the linear error. If these errors are not perfectly corrected, the angular error and linear errors are adjusted again in turn and these steps are repeated until alignment is achieved. A traditional edge alignment system cannot correct angular and linear errors at the same time and it might not reach the required positional tolerance before the time taken for alignment becomes excessive. Since the alignment process is observable, the outcome predictable of the operator is in a position to reject substrates that do not conform to the requirements.

The edge is moved with both linear and angular offset when the glass is rotated about its center.
2. Edge Detection
In order to raise edge detection performance, the first step taken in this study was image partition. Image partition involves cutting the image into a number of small parts of ROI as shown in Figure 2. The image was cut into N parts with fixed intervals of width/length. For horizontal line search, the height of each ROI image is equal to the height of the original image and the user can set the width of each. Similarly, for vertical line search, the width of the ROI image is equal to the width of original image and the user can also set the height. In this section, a horizontal line is found. After image partition, the next step is computation of the average according to the following:

where j = 1, 2, …,N; N
c
and N
r
, respectively, represent the total number of pixels in a column and row of the jth ROI image; p
r,c,j
is the gray value of the position of the c-column and r-row of jth ROI image. In general, this step can be completed using FOR-Loop in the program (e.g., C++, VB, and C#, etc.). This step is completed using the cvReduce function, which is a function of OpenCV, since cvReduce is much faster than FOR-Loop for pixel average computing due to the optimization algorithm developed by Intel. For instance, the resolution of the original image is (1280 × 960) pixels and the image is separated into 20 parts of ROI and the resolution of each ROI image is 10 × 960 pixels. According to cvReduce, the average calculation time for a single ROI is less than 0.2 ms. The third step is a Sobel calculation to get the first order derivative using cvSobel from OpenCV. Note that because the image of the glass substrate is simple, using a first order derivative is good enough. The fourth step is to find the edge points of the ROI images. Some of these found edge points might be considered incorrect as shown in Figure 3(a). Note that in Figure 3 the image is divided into 50 ROI parts. To exclude incorrect edge points, we compute the average

where k is a threshold value which is set at 3 in this study. If a point in the set is outside the error band it is struck out. The remaining set of points can be applied to edge line fitting. N-point line fitting can be determined according to the coordinates of ith point position represented (x i ,y i ). Thus, the line can be fitted using the following:
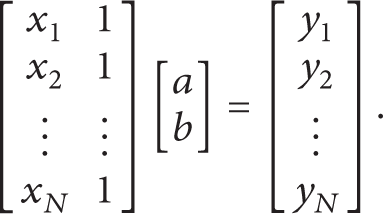
Thus, the line parameters a and b can be determined as the pseudoinverse, as


The idea of ROI partitioning and edge point searching.
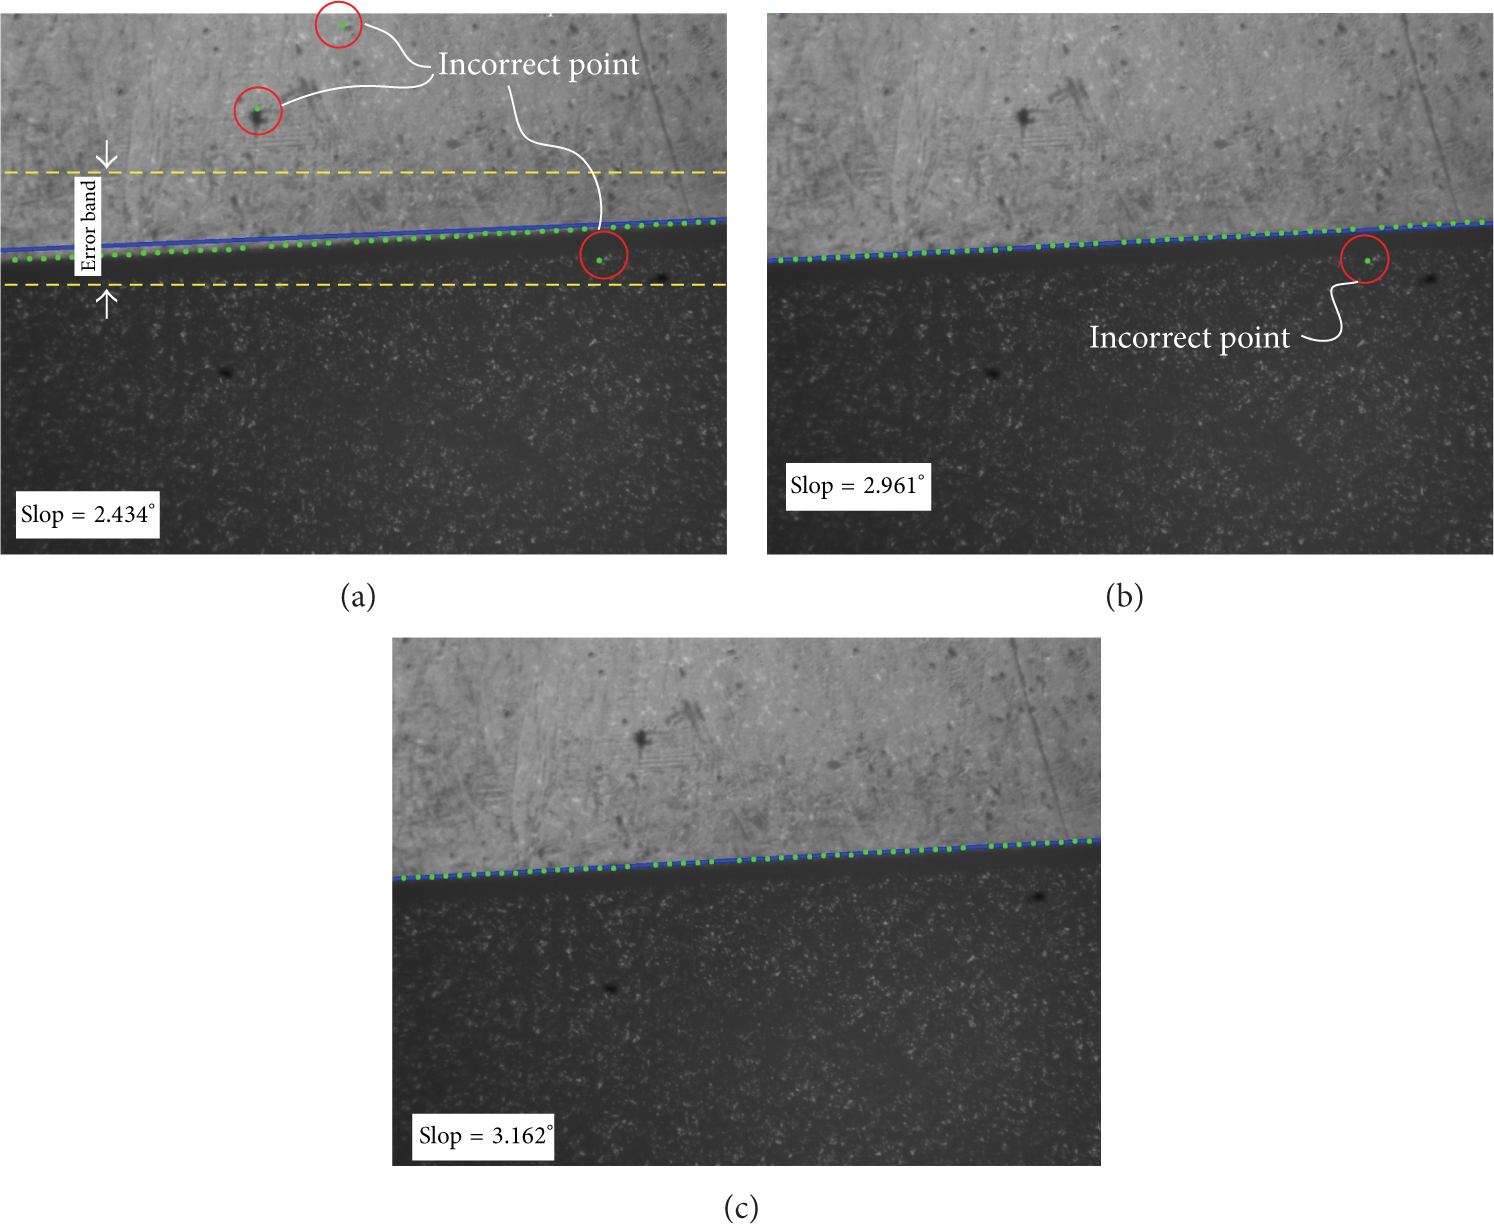
Edge line search results. Found edge points are green; the solid line is the fitting edge; the yellow dashed line is the error band; and the red circles mark incorrect points that should be removed. (a) Original result. (b) After threshold. (c) After ignore process.
Open CV also provides inverse matrix functions in cvInverse. There are several methods included in cvInverse and the SVD (singular value decomposition) method was selected. After excluding incorrect edge points, the result is as shown in Figure 3(b). We can see that one incorrect point has not been ruled out because it is inside the error band. This point invalidates the edge detection result. A line with large slope needs a large error band to keep most of the edge points inside. To solve this problem, we used a simple method to filter the incorrect point. The method involves ordering the points according to their distances from the edge point to the previously found edge line. This distance denoted as d[k] can be computed as

where
3. Alignment Algorithm
This study uses either four or five cameras to construct a GSA system. Displacement of alignment is as shown in Figure 4. The variables considered are as follows:
δθ: angular orientation of the glass;

Relationship between the gold sample glass and the aligned glass. The solid line shows the aligned glass and the dashed line shows the gold sample glass.
3.1. Four-Camera Alignment
As seen in Figure 5, the glass substrate is moved to align the edges with the reference points P (the alignment target points). For Camera 1 and Camera 2, the points P1 and P2 are at the intersection of the horizontal edge of the glass and the y-axis of the camera. For Camera 3 and Camera 4, the points P3 and P4 are at the intersection of the vertical edge of the glass and the x-axis of the camera. The distance from the center of the glass to the reference point for ith camera is
where

Thus, the relationship between ith camera and the aligned glass is
in which

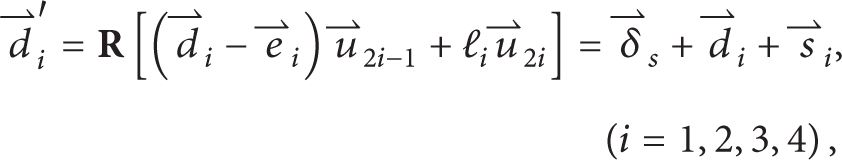
Hence, the alignment equation for the four-camera GSA system is as follows:

There are 9 unknowns,

Alignment target position of the glass center and the camera reference points.

Relationship between the glass and cameras when glass deviation exists.

Alignment vector analysis from Camera 1.
3.2. Five-Camera Alignment
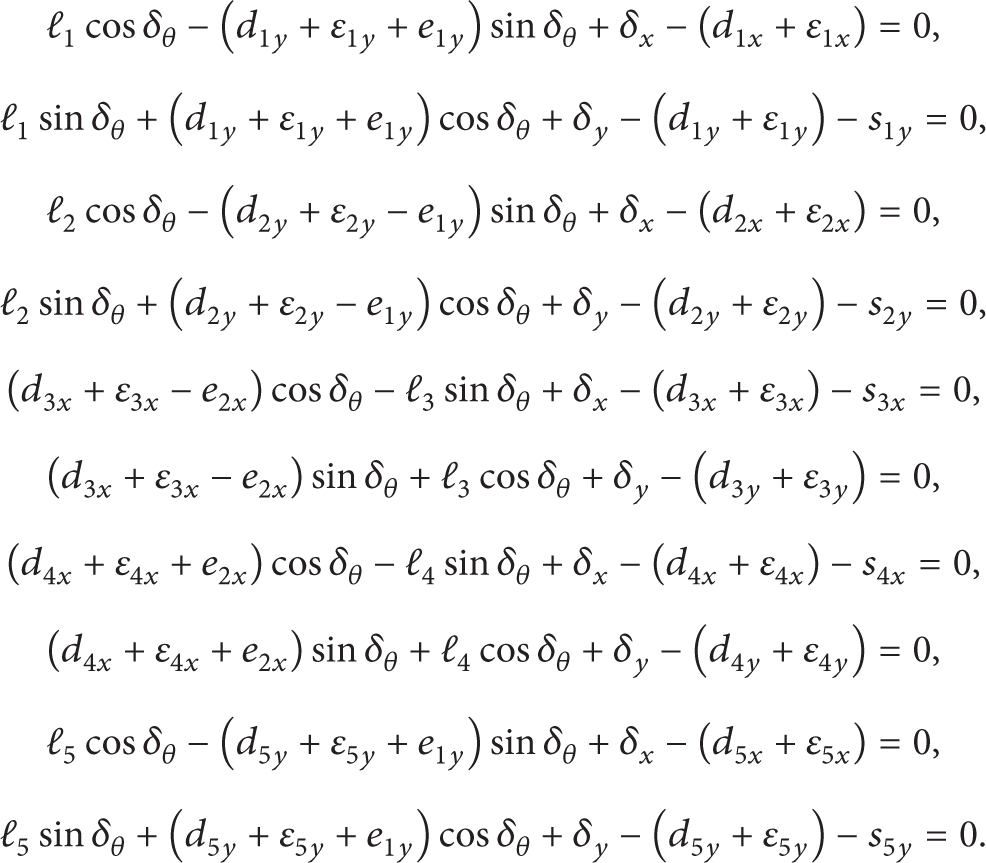
From the previous section, we can see that a camera provides two equations and one unknown. In order to solve the nine unknowns at once, we use five cameras to form the alignment equation in this section. For a five-camera GSA system, as shown in Figure 8, there are ten alignment equations as follows:

Now, we can solve the ten unknowns

Relationship between the glass and cameras when using a five-camera GSA system.
4. Alignment System
4.1. The Coplanar Alignment Stage
After considering the alignment requirements and performance, a five-camera GSA system was developed. The arrangement is shown in Figure 9. The glass is held on the alignment stage by means of vacuum nozzles. The stage has three-dimensional displacement: translation along the x- and y-axes and rotation on the z-axis. The displacement of each motion is represented by δ x , δ y , and δθ, respectively. The stage is moved by three motors which are fixed to the base board. The work platform and the base board are linked by three XYθ z stages, as shown in Figure 10. The first and second XYθ z stages are driven by three stepper motors (1, 2, and 3) by means of ball screws. The third XYθ z stage is used as a support. The relationship between the motors and stage displacement is as follows:

where k i is displacement-pulse converting constant of ith stepper motor. The proposed alignment stage is small and light and cannot be used for heavy loads or in such operations as OCA lamination. The best application for this type of small stage is as a carriage stage for loading and unloading operations. For example, the stage might load and align a glass substrate which is then transferred by a long stroke stage and placed on a manufacturing stage.

Physical arrangement of the proposed edge alignment system.

Configuration of the coplanar alignment stage.
As shown in Figure 9, the reference, or center point of movement, is the center of the stage and the origin of the coordinate system {S}. However, the alignment equation (12) was analyzed according to the center of the glass-coordinate system {O}. A concept called floating center transformation is proposed to link the two coordinate systems {O} and {S}.
4.2. Concept of Floating Center Transformation
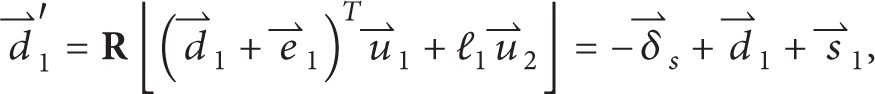
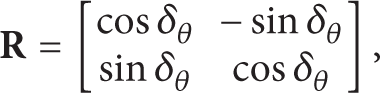
The kinematic equation of the coplanar stage can be derived using Figures 11 and 12. In Figure 11,
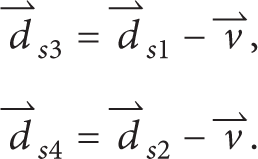
As seen in Figure 12, when the stage moves with displacement of

where

Note that the variables ds1x, ds1y, ds2x, and ds2y are design parameters which are all constants.

Vectors and coordinates definition of the stage.

Kinematic analysis of the stage.
4.3. Alignment Uncertainty
In this study, the positioning accuracy and performance of the alignment stage has not been taken into account because after assembly the setup errors of the stage do not change. However, the positions of the cameras change with respect to each workpiece that is mounted. Because the camera positions cannot be exactly measured, the setup error of each camera is represented by ε1x, ε1y, ε2x, ε2y, ε3x, ε3y, ε4x, and ε4y and each needs to be taken into account. Then, (12) can be rewritten as follows:
Sensitivity is defined as

where ∂ferr, dir is the alignment equation with setup errors as one of (17); α represents the setup error source (i.e., one of the setup errors ε1x, ε1y, ε2x, ε2y, ε3x, ε3y, ε4x, and ε4y). Note there are ten equations in (17). The alignment error can be estimated by

where τ(α) is the value of the setup error source of α. In this estimation, we made the linear and angular displacement to be ±2 mm and ±1 degree, respectively. The glass is 223.6 mm wide and 125.8 mm long (e.g., a 10.1″ glass substrate). Assume approximate camera positions of
Estimated glass position error when camera setup errors exist.

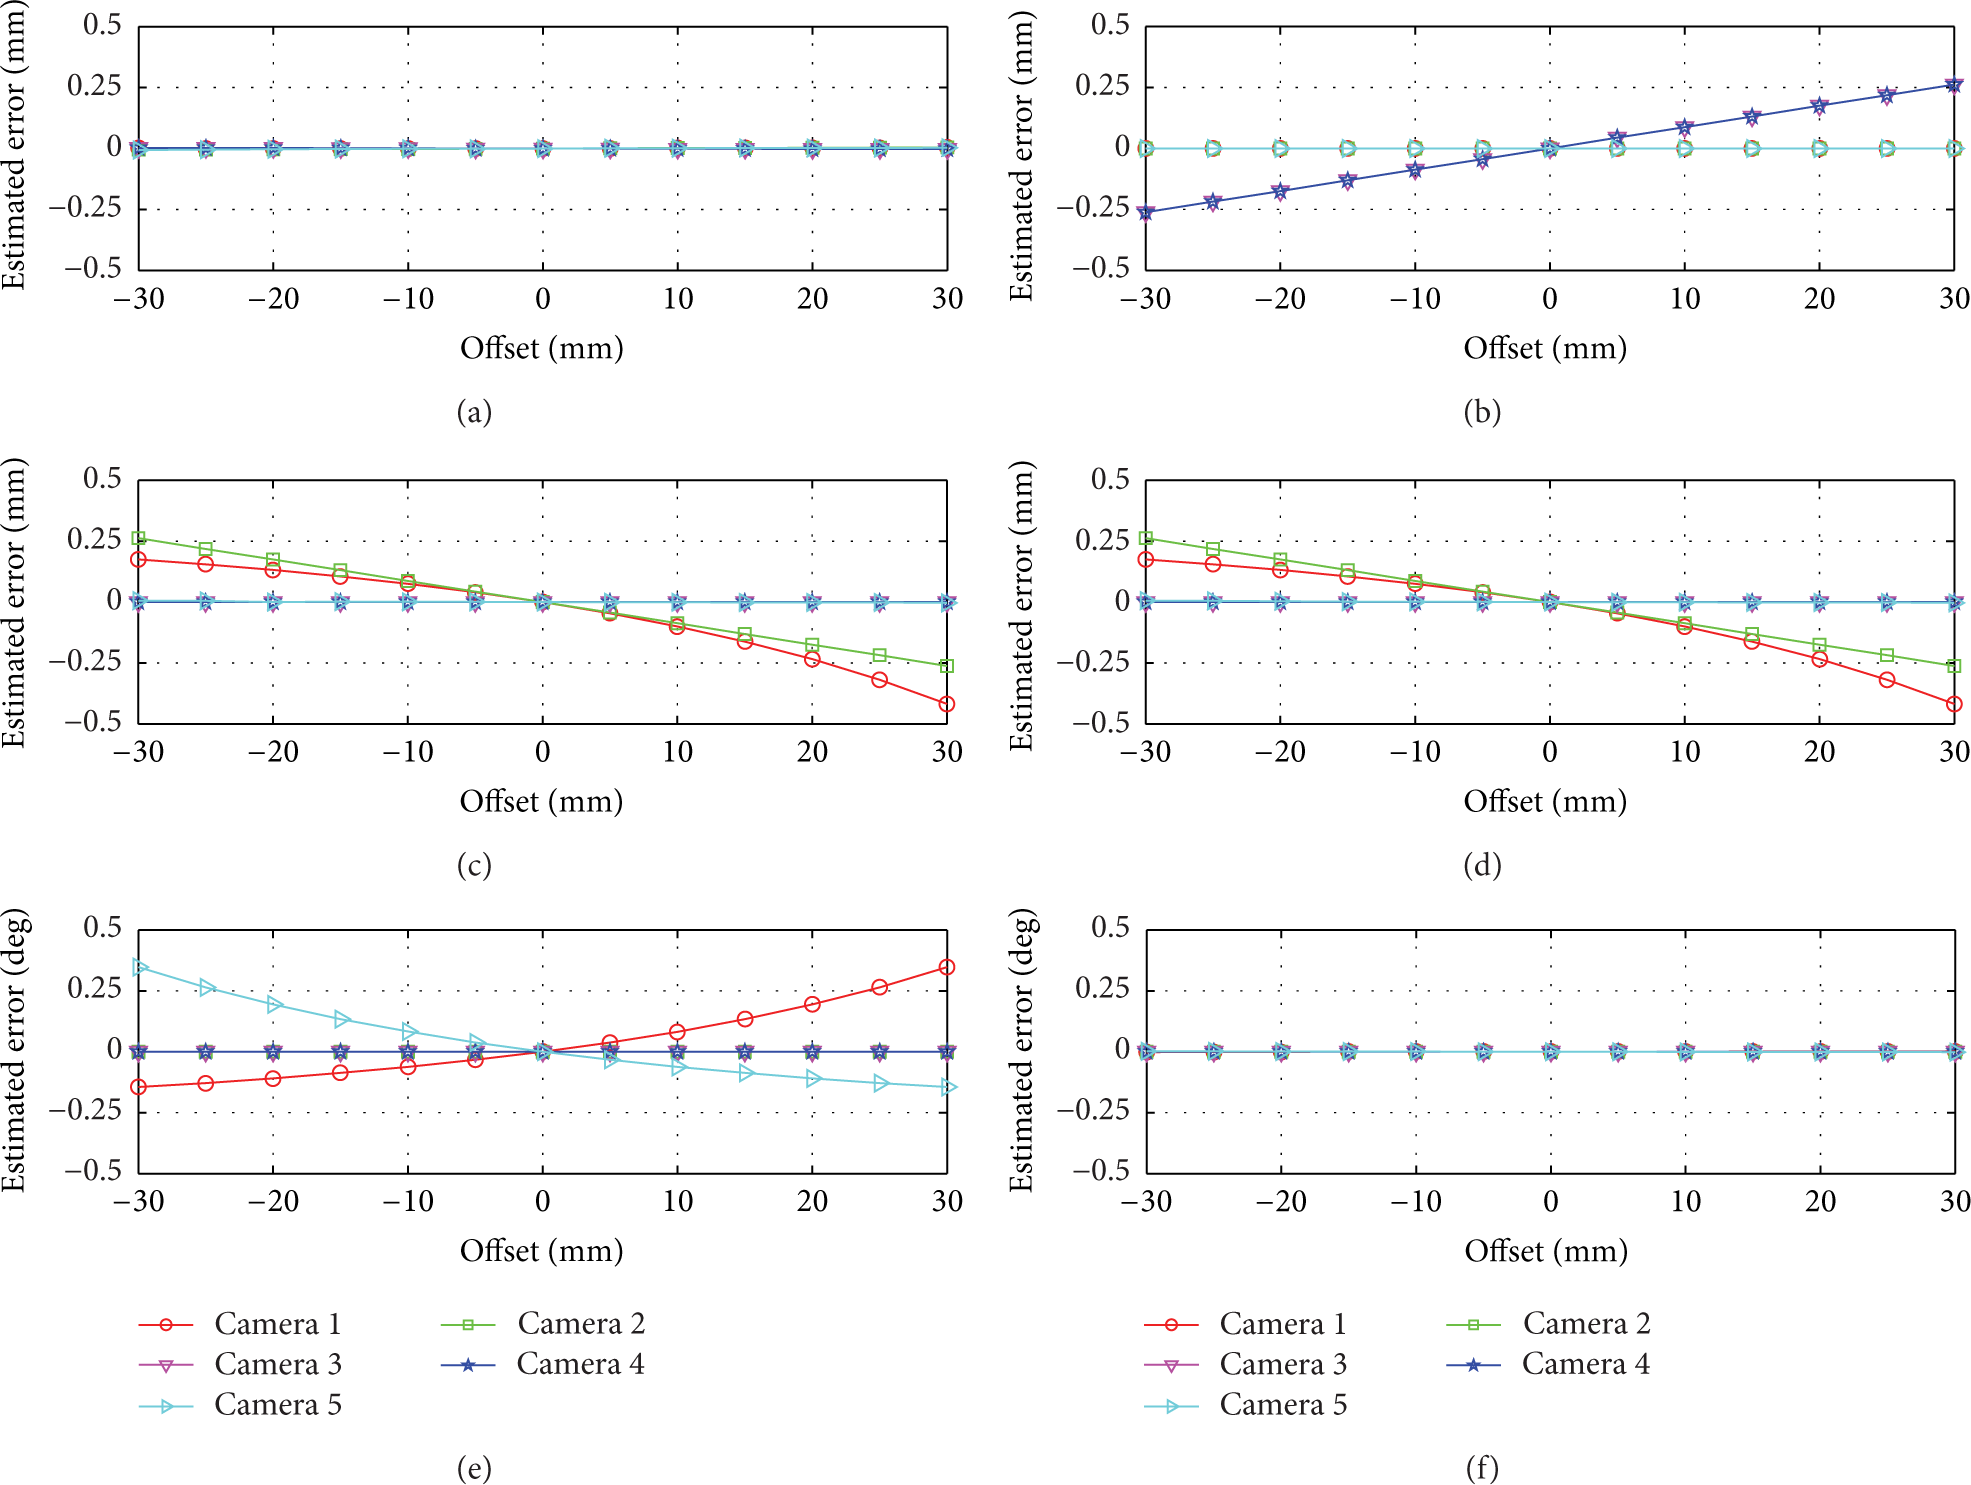
The estimated error when camera setup errors are considered: (a) E x versus cameras x-direction setup error; (b) E x versus cameras y-direction setup error; (c) E y versus cameras x-direction setup error; (d) E y versus cameras y-direction setup error; (e) Eθ versus cameras x-direction setup error; (f) Eθ versus cameras y-direction setup error.
4.4. Alignment Equation Simplification
From the result of the alignment uncertainty analysis, we conclude that (1) linear positioning accuracy in the x-direction depends on Cameras 3 and 4; (2) Linear positioning accuracy in the y-direction depends on Cameras 1 and 2; (3) Angular positioning accuracy of rotation on the z-axis depends on Cameras 1 and 5. According to the sensitivities of camera setup error, the simplified alignment equation is formulated as

From Figure 14, the glass length and width tolerance can be formulated as

where the vector

Similarly, the width tolerance of the glass can be determined as

Although the alignment equation becomes quite simple, it may increase the alignment frequency per alignment motion and decrease performance.

Illustration of glass tolerance computing. (a) Length tolerance; (b) width tolerance.
5. Experimental Results
In this study, the alignment stage used was an XXY stage produced by the Chiuan-Yan Tech Co., Ltd. The stage motion was controlled by NI PCI-7390. The images were captured by Basler digital cameras (type of acA1300-gm). In the alignment experiment, the stage was first moved at random to put the workpiece out of alignment and away from the target position. The maximum acceptable number of steps to move the glass, align it, and measure the final aligned position was three. The time between each alignment step was 350 ms. The target alignment accuracy setting was ±1 μm. Position of the stage was measured by two linear sensors (Keyence GT2) which were calibrated. In this study, we use a business image procession library (Cognex Vision Pro) to check if our proposed edge detection method could be applied to a high precision alignment system. The full alignment equation computed deviations in the glass. In this study, the cameras have not been calibrated because the lens distortion does not affecting the alignment repeatability. If the cameras are calibrated then the measurement accuracy can be increased and the alignment time can be decreased.
A screen shot of the operating software is shown in Figure 15. In the figure, “captured image” is the images captured from the cameras, in which CCD1 is Camera 1, CCD2 is Camera 2, CCD5 is Camera 3, and CCD6 is Camera 4. Camera 5 image is not visible because there is not enough room on the screen to display all five images at once. “Alignment option” can initiate the entire alignment operation. In this block, from top to bottom, the options are maximum acceptable alignment steps, acceptance ratio (only valid for pattern alignment), alignment precision, and alignment time interval (between two alignment steps in ms), respectively. At the bottom of the screen, “alignment time” and “image processing time” show total alignment time (from start to finish) and image processing time (which includes image capture and edge detection). Note that information about the detected edge such as cross point and slope is shown at the top. Experimental results are shown in Figure 16.

Windows screen view of the alignment software.

Experimental results of fifty alignments: (a) x-direction; (b) y-direction; (c) θ z -direction.
6. Conclusion
This study proposes an edge alignment system, using either four or five cameras, that is capable of consistently accurate and reproducible alignment of glass substrate. According to the floating center concept, the glass can be placed anywhere on the xy plane of the alignment stage. A simple method of edge detection was developed to improve edge detection performance. Alignment time is less than 1.5 second when the time for each alignment step is 350 ms, alignment repeatability is ±1 μm, and the maximum number of alignment steps is three. Experimental results show that alignment repeatability is about ±1 μm in the x- and y-directions and ±5 arcsec in the θ z -direction. However, there are some conditions that need to be fulfilled for using this edge detection and alignment method: (1) a pure background image is essential, (2) the glass substrate must be absolutely clean and clear, and (3) high contrast must exist between the background and the glass as observed through the camera. A simplified alignment equation has been proposed for the GSA system based on sensitivity analysis, but this may result in the need for more alignment steps to maintain the required precision.
Conflict of Interests
The authors declare that there is no conflict of interests regarding the publication of this paper.
Footnotes
Acknowledgment
The work was supported by Ministry of Science and Technology, Taiwan (NSC. 100-2221-E-005-091-MY3, NSC 101-2218-E-005-004-, MOST 102-EC-17-A-05-S1-211, and MOST 102-2218-E-005-014).