
Abstract
This study was designed to build an evaluation system for secondary task driving safety by using method of Fuzzy Analytic Network Process (F-ANP). Forty drivers completed driving on driving simulator while interacting with or without a secondary task. Measures of fixations, saccades, and vehicle running status were analyzed. According to five experts' opinions, a hierarchical model for secondary task driving safety evaluation was built. The hierarchical model was divided into three levels: goal, assessment dimension, and criteria. Seven indexes make up the level of criteria, and the assessment dimension includes two clusters: vehicle control risk and driver eye movement risk. By method of F-ANP, the priorities of the criteria and the subcriteria were determined. Furthermore, to rank the driving safety, an approach based on the principle of maximum membership degree was adopted. At last, a case study of secondary task driving safety evaluation by forty drivers using the proposed method was done. The results indicated that the application of the proposed method is practically feasible and adoptable for secondary task driving safety evaluation.
1. Introduction
According to Sayer et al., drivers were observed engaged in secondary behaviors in approximately 34% of the clips. Conversation with passengers was the most common secondary behavior (15.3%), followed by grooming (6.5%) and using cellular phones (5.3%). Younger drivers were most likely to engage in secondary behaviors overall (42%) [1]. As the use of in-vehicle technologies becomes more popular, there is concern about a concomitant increase in driver distraction arising from their use.
Driver distraction can be defined as the diversion of attention from the driving task as compelled by an activity or event, inside or outside the vehicle, which competes for the attention of the driver. It usually results in a delayed recognition and processing of the information needed to accomplish the driving task safely [2]. A large body of evidence suggests that driving performance and driver visual degrade when drivers engage in secondary behaviors, such as using cellular phone, navigation system, and even conversation with passengers [3, 4].
Previous studies have shown that the effects of secondary task on driving performance are significant. Chisholm et al. found that the iPod tasks had larger variation in steering wheel adjustments than usual [5]. Jin et al. reported that the in-vehicle touch-screen telephone weakened driver's ability to control the vehicle [6]. Kun et al. research showed that the effects of secondary task driving on lane position, steering wheel angle, and the velocity of participants' cars were significant [7]. With regard to the effect of secondary task on driver eye movements, Young et al. found that drivers typically made a large number of short fixations to the in-vehicle device during the secondary task driving [8]. Pupil diameter was also significantly increased with doing the touch-screen secondary task while driving [9]. In addition, Konstantopoulos et al. also studied the horizontal and vertical spread of search angles in different driving conditions [10]. Saccade as another important measure of eye-movement behavior was less researched compared to fixation. Yang et al. found that in visual tasks, saccade duration and amplitude changed obviously [11]. Victor et al. reported that drivers made significantly fewer saccades with the cell phone task while driving [12]. Ahlstrom studied the effects of aircraft density on driver saccade behavior and found that means saccade distance decreased as the aircraft density increased [13].
As discussed above, secondary task driving is a significant and multifaceted road safety issue and has already threatened driving safety. However, few relative studies have systematically examined the driving safety levels with secondary task while driving, and the evaluation system for secondary task driving safety is also largely unexplored. Aimed at that, the overall goal of this paper is to examine the influence of different secondary tasks on measures of driver eye movements and vehicle control and to develop a method to evaluate the safety for secondary task driving.
2. Method
Fuzzy Analysis Network Process (F-ANP) is a new system analysis method based on traditional Analysis Network Process (ANP), combined with fuzzy comprehensive evaluation knowledge [14]. In the process of evaluation, this method not only considers the hierarchy of indicators, but also takes into account the relationship between the factors in each layer, therefore addressing the kind of assessment selection problem on evaluation index system with hybrid network hierarchy structure [15]. In this study, the F-ANP approach is applied to relieve the uncertainness of ANP method. The fuzzy comparison ratios are used to determine the assessment dimension and criteria weights from subjective judgments.
2.1. Structuring the Hierarchical Model for Secondary Task Driving Safety Evaluation, Including Goal, Assessment Dimension, and Criteria
First, this study determines the goal for the secondary task driving safety by focus group discussion with 5 experts on driving safety evaluation. In addition, we decide on 7 criteria and classify them into two assessment dimensions: the visual behavior safety and the vehicle control safety. The hierarchical model for secondary task driving safety evaluation is proposed in Figure 1.

The hierarchical model for secondary task driving safety.
2.2. Calculating the Weights of Each Criterion
To reduce the decision-maker preferences, pair-wise comparison matrices are structured using triangular fuzzy numbers (l, m, u). Triangular fuzzy numbers are used to investigate the ambiguities involved in the linguistic-data assessment process. Because there are many criteria for the issue involving a suitable recycling option selection and because most of these are qualitative, it is difficult to assess these criteria quantitatively [16]. Fuzzy numbers reflect the relative strength of each pair of network elements [17]. So, in this study, we structure pair-wise comparison matrices using triangular fuzzy numbers.
2.2.1. Constructing the Fuzzy Judgment Matrix Using Triangular Fuzzy Numbers
The weight of each criterion is calculated through the following steps.
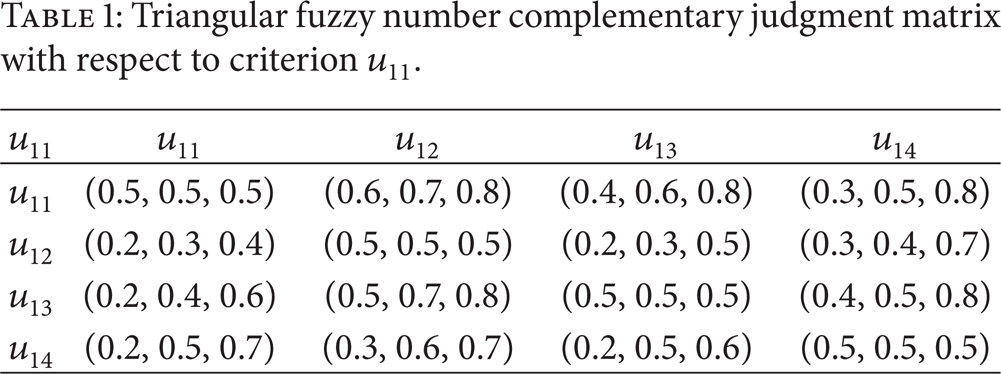
Step 1. Calculating the local weight matrix W11 of criterion u11. The triangular fuzzy number complementary judgment matrix with respect to criterion u11 by triangular fuzzy numbers is calculated as shown in Table 1.
Calculating the comprehensive importance matrixes C11, C12, C13, and C14 of criterion u11 according to the following formula [18]:
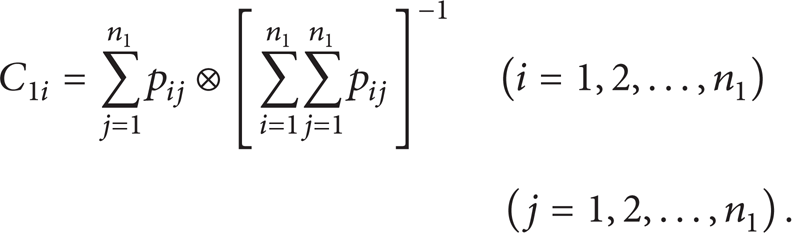
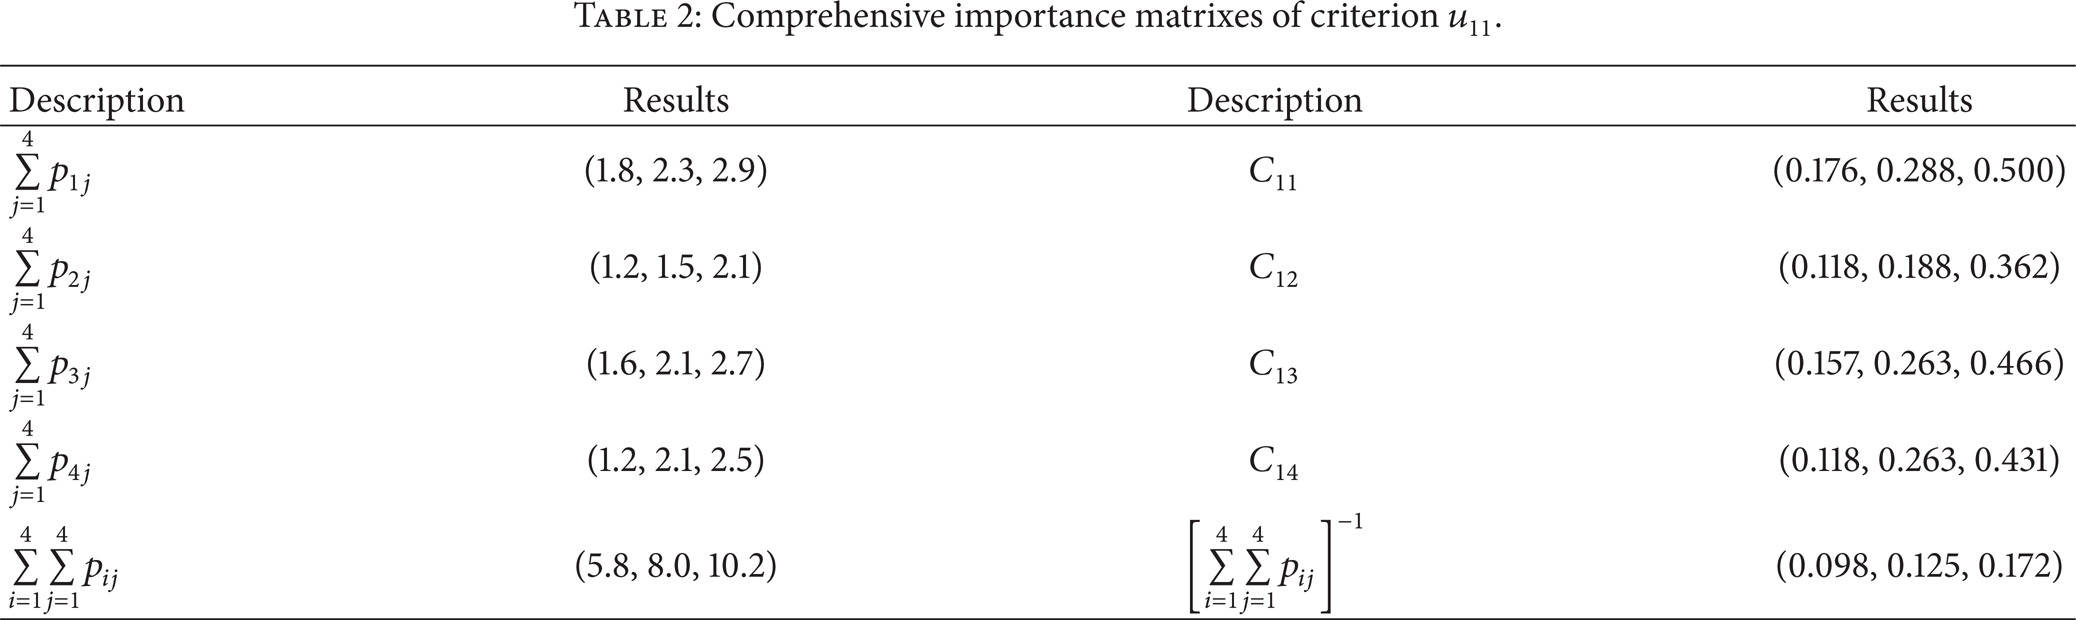
In formula (1), p ij = (l ij , m ij , s ij ) is the triangular fuzzy number complementary judgment matrix. The calculated comprehensive importance matrixes of criterion u11 are shown in Table 2.
Establishing the possible degrees for C1i ≥ C1k according to the following formula [19]. The results are demonstrated in Table 3:

Obtaining the possible degrees of criterion u11 is more important than other criteria:

The weight matrix W11(11) is determined after

With the same method, W11(12), W11(13), and W11(14) are obtained. At last we can obtain the weight matrix W11 of u11 as follows:

Triangular fuzzy number complementary judgment matrix with respect to criterion u11.
Comprehensive importance matrixes of criterion u11.
Possible degrees for C1i ≥ C1k.

Step 2. According to the above mentioned ways, we can obtain the weight matrixes W22, W12, and W21 of u22, u12, and u21, respectively.

2.2.2. Calculating the Weights of Assessment Dimension Factors
Method of triangular fuzzy numbers is also used to calculate the weights of assessment dimension factors. The weight matrix A of assessment dimension factorsis shown as follows:

2.2.3. Calculating the Hypermatrix W and Weighted Super Matrix
Consider

In the hypermatrix Wand weighted super matrix

2.2.4. Calculating the Global Weight of Each Criterion

2.3. Defining the Remark Set of Secondary Task Driving Safety
In this study, five levels of secondary task driving safety are classified: very high, high, average, low, and very low.
2.4. Constructing the Membership Functions and Classifying the Secondary Task Driving Safety
The membership function of a fuzzy set is a generalization of the indicator function in classical sets. In this study, the relationship between the membership degree and the driving safety score is not in a monotony trend. So it's suitable to solve this problem using middle type membership function patterns. Therefore, sine curve is selected as the membership function. The fuzzy analytical expression is as follows:


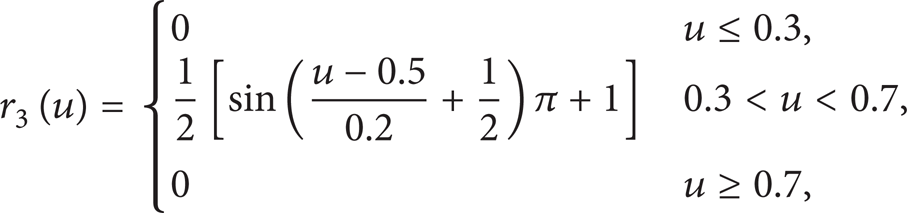


In these formulas, r1 to r5 represent the degree of secondary task driving safety belonging to “very low”, “low”, “average”, “high”, and “very high,” respectively, and u is the value of criterion. Due to the maximum membership grade principle, the levels of secondary task driving safety could be determined.
3. Experimental Verification
3.1. Description of the Experiment
A simulated driving experiment is conducted to examine the effects of four secondary tasks on driver eye movements and vehicle running status.
3.1.1. Participants
Forty participants (29 females, 11 males, mean age 32.5 years) between 20 and 52 years of age were recruited from Jilin University and surrounding communities. All participants hold a valid class C1 driver's license for more than 1 year and have an annual mileage from 5000 km to 76000 km. The participants are also required to be in good physical and mental health and not to be taking any medication or drugs that would affect their driving performance. Learning from the study of Guo [20], based on drivers driving experience, we classify them into three groups: experienced driver (mileage is equal or greater than 5 million kilometers), general experienced driver (mileage is between 2 and 5 million kilometers), and inexperienced driver (mileage is equal or less than 2 million kilometers).
3.1.2. Apparatus and Materials
The experiment platform built by intelligent vehicle group in Jilin University includes an eye movements tracking system (SmartEye 6.0), a Besturn B50 car, an embedded driving simulator, and four secondary task devices (an in-vehicle radio, a computer (iPad 4), a fixed telephone, and a Bluetooth headset).
(1) The SmartEye 6.0 Eyes Tracking System. Driver eye movements while driving are captured by SmartEye 6.0 (Smart Eye AB, Första Långgatan 28, Gothenburg, Sweden). It uses four cameras mounted in front of windscreen to capture the driver's eye movements and three scenes' cameras to record the simulated traffic environment. Video analysis is performed using SmartEye-Analysis, an offline data review and reduction analysis program. As compared to head-mounted eye movement tracking systems, SmartEye 6.0 has the advantage of being separately mounted and therefore has less influence on driving performance. In addition, 60 Hz is adopted as the sample frequency in SmartEye 6.0.
(2) Driving Simulator and Secondary Task Devices. The driving simulator is a fixed-base, static driving simulator equipped with a Besturn B50 car. The display system projects onto a screen in front of the vehicle. The experiment apparatus are shown in Figure 2.

Experimental equipment.
(3) Road Environment. The highway from Changchun to Siping is selected as the driving road environment, for which a real-time 3D model is built using the visual simulation software Multigen Creator and Vega. This highway section has two lanes in each direction, separated by a grassy median. The width of traffic lane and grassy median are 3.75 m and 3 m, separately. The road is in good condition without damage on surface texture and the weather is clear.
(4) Secondary Tasks. There are four secondary tasks adopted in this study: conducting a conversation using Bluetooth headset, talking with laboratory assistant, tuning the radio to a local radio station, and touching the computer or telephone menu to a certain song. The radio task was a press-button task and needed ten operation steps and took about 7–10 s to complete when tested alone, with turning to a local radio station as the end. Computer or telephone task should be completed by touching screen and need more than five completion steps. The conversations of conducting a speech-based Bluetooth headset conversation and talking with laboratory assistant include fifteen simple questions, such as how long have you got the driving license? The number of questions is random.
In these secondary tasks, conducting a speech-based Bluetooth headset conversation and talking with laboratory assistant are cognitive tasks while tuning the radio to a local radio station and touching the computer or telephone menu to a certain song are visual tasks.
3.1.3. Experimental Sessions
The experiment is conducted in two sessions.
Training session: participants practice with secondary tasks and driving in the simulator first separately and then together. The practice session ends when the participants feel they can operate the secondary tasks safely while driving.
Test session: on the premise of security, drivers should complete five drives, a drive without secondary task (baseline) and four drives with secondary tasks.
3.2. Data Analysis
3.2.1. Constructing the Single Factor Assessment Matrix for Each Driver
In order to describe how the matrix constructed, we will take the driver 1 as an example. First of all, the data collected from driving simulator should be processed using the following formula [21–23]:

In formula (16), max (u i ) is the maximum of criteria value, min (u i ) is the minimum of criteria value, and u i is the criteria value of the present driver.
Second, substituting the

In this way, the single factor assessment matrixes of drivers from 1 to 40 under different driving conditions are obtained.
3.2.2. Determining the Driving Safety Levels
The driving safety judgment sets are determined by multiplying the global weight of each criterion G and single factor assessment matrix R. With the maximum membership grade principle, the driving safety levels are divided. So, driver 1's driving safety judgment set under normal driving condition is B1 as follows:

The maximum value of B1 is 0.281. According to the membership function, the score 0.281 belongs to “very high” level of driving safety. Similarly, the driving safety levels of other drivers under different driving conditions could be calculated.
3.3. Results
Based on the evaluation results, we classify and analyze the stata statistically according to driving conditions, driver's driving experience, and types of secondary task.
Tables 4–7 are statistical data of the influence of driving conditions, types of secondary task, and driver's driving experience on driving safety.
Statistics of drivers' driving safety levels under different driving conditions.

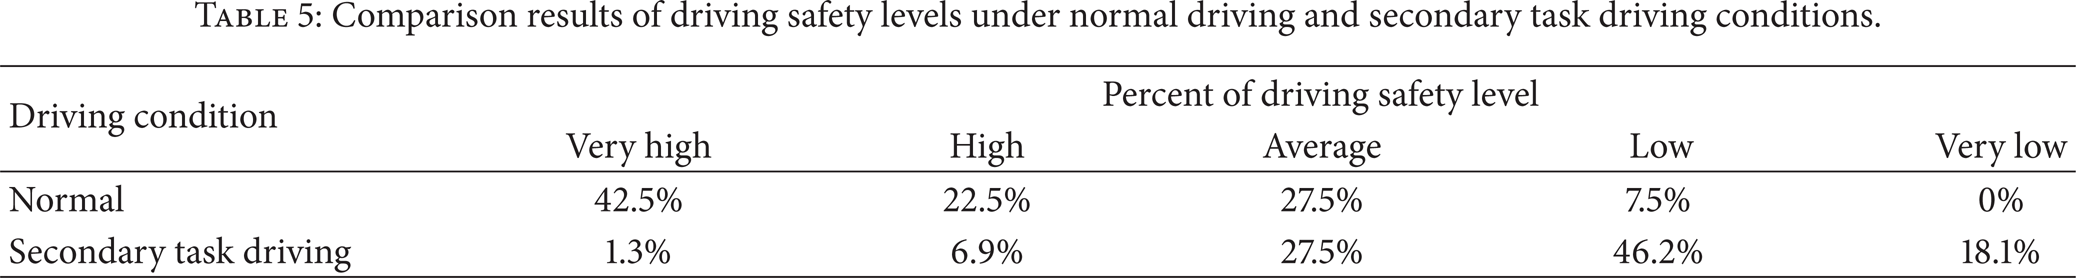
Comparison results of driving safety levels under normal driving and secondary task driving conditions.
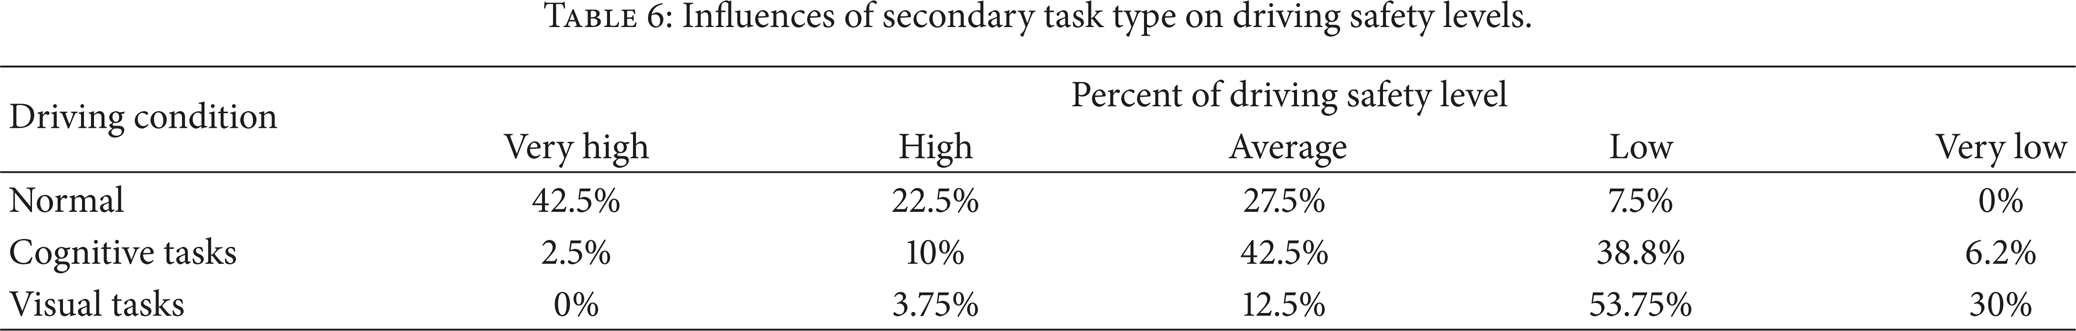
Influences of secondary task type on driving safety levels.
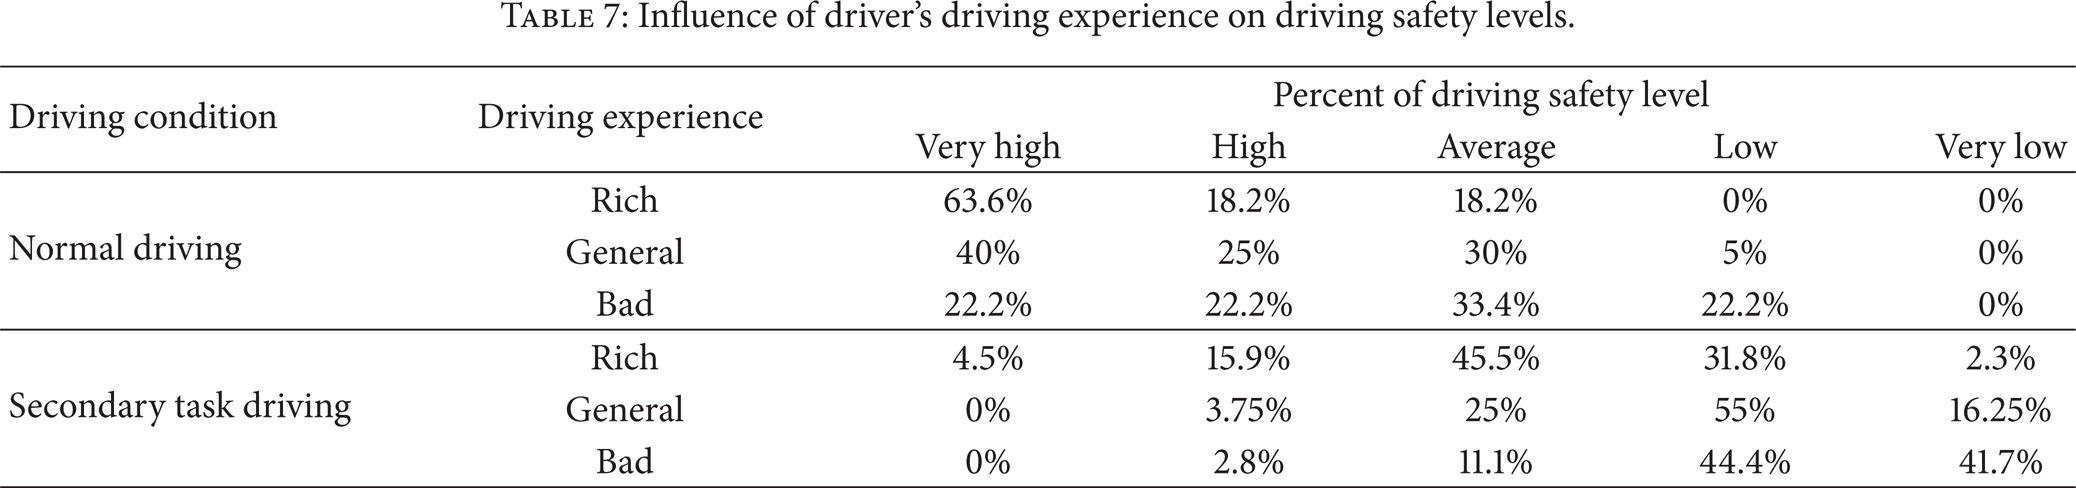
Influence of driver's driving experience on driving safety levels.
3.3.1. Secondary Task Driving Has Significant Influence on Driving Safety
From Tables 4 and 5, we can draw the conclusion that secondary task driving has significant influence on driving safety. “Average” and above of driving safety levels under normal driving condition (92.5%) are higher than driving with Bluetooth headset conversation (57.5%), laboratory assistant talking (55%), radio tuning (20%), and touch-screen touching (12.5%). Overall, during the secondary task driving, “average” and above of driving safety levels account for only 35.7%, while “low” and “very low” of driving safety levels are responsible for 64.3%. Through analysis for test data, it can be seen that secondary task driving, regardless of secondary task type, has significant influence on driving safety.
3.3.2. Visual Tasks Have a Greater Impact on Driving Safety Than Cognitive Tasks
It is evident from the results in Table 6 that driving with visual tasks (“low” and “very low” account for more than 83%) are more dangerous than with cognitive tasks (“low” and “very low” account for about 45%). Additionally, the security of driving with cognitive tasks is also lower than normal driving.
3.3.3. Driver's Driving Experience Has Significant Influence on Driving Safety
The statistical analysis indicates that, under normal driving condition, driving safety level of experienced drivers is the highest (“average” and above account for about 100%). The same situation applies to secondary task driving. Experienced drivers driving with secondary task can still keep good driving safety (“average” and above account for about 65.9%) while inexperienced drivers cannot (“average” and above account for only 13.9%).
4. Conclusions
This study aimed to determine the driving safety level of secondary task driving by using Fuzzy Analytic Network Process approach. The proposed approach takes into account the driver's visual behavior safety and vehicle control safety with their subcriteria (assessment dimension). The interdependencies between criteria are also considered within the proposed approach. The weights of the criteria and subcriteria are determined by using triangular fuzzy numbers. After determining the weights of the criteria and constructing the single factor assessment matrix for each driver, the maximum membership grade principle is applied to divide the safety level of secondary task driving. Finally, the classification is implemented.
Data of forty drivers engaging in driving simulation are used for verifying the applicability of the secondary task driving safety evaluation system. The analysis results showed that secondary task driving, secondary task types, and driver's driving experience have influence on the driving safety, obviously. Secondary task driving can decrease the driving safety significantly.
In conclusion, the proposed approach is useful and effective to classify the safety level of the secondary task driving. Secondary task driving has negative effects on driving safety and drivers should enhance their consciousness away from interacting with secondary tasks while driving. The government should pay more attention to this issue and take action to prevent traffic accident caused by these secondary tasks.
Conflict of Interests
The authors do not have any conflict of interests with the content of the paper.
Footnotes
Acknowledgments
This research was supported partly by the Research Foundation of Shandong Jiaotong University (2014), the Doctoral Scientific Research Foundation of Shandong Jiaotong University, the International Cooperation Project of Science and Technology of Jilin Province under Grant (20130413056GH), the Tsinghua University Open Fund of State Key Laboratory of Automotive Safety and Energy (KF14182), the Key Scientific and Technological Project of Changchun Technology Bureau (13KG05), and Jilin University Alternates Development Scheme of The National Science Fund for Distinguished Scholars.