
Abstract
A mathematical model is established for the preheating commissioning process of waxy crude oil pipelines. The governing equations are solved by the finite volume method and the finite difference method. Accordingly, numerical computations are made for the Niger crude oil pipeline and the Daqing-Tieling 3rd pipeline. The computational results agree well with the field test data. On this basis, fluid temperature in the process of the preheating commissioning is studied for single station-to-station pipeline. By comparing different preheating modes, it is found that the effect of forward preheating is the best. Under different preheating commissioning conditions, the optimal combination of outlet temperature and flow rate is given.
1. Introduction
Preheating commissioning is a key stage between the construction and the operation of crude oil pipelines. Even if the crude oil has been heated before entering the pipeline, hot water or hot light oil is usually transported at first to preheat the pipeline and prevent congelation accidents caused by too low temperature of the waxy crude oil due to the huge heat loss to the environment. After the preheating, the hot crude oil begins to enter the pipeline at the environmental temperature above its pour point and finally reaches the normal operation. In the process of the preheating commissioning, the fluid temperature and the soil temperature are always in transient state so that it is a double-coupling problem. One coupling is for fluid flow and heat transfer in the pipeline. Another coupling is for fluid heat transfer in the pipeline and soil heat conduction out of the pipeline [1].
Studies on the unsteady heat transfer problems in crude oil pipelines are mostly focused on the batched transporting crude oils with different outlet temperatures and shutdown and restart problems of waxy crude oil [2–6]. Few studies are on the preheating commissioning of crude oil pipelines. The impact of thermal parameters such as atmosphere temperature, flow rate, and soil temperature on the preheating effects in the process of forward preheating are discussed in the literature [7–9]. Some preliminary study on the optimal commissioning opportunity in the forward preheating can be found in the literature [10, 11]. Xing et al. [12] studied the preheating commissioning for the crude oil pipelines with multiple heating stations. They found that a good preheating commissioning can be achieved through the plan of a few rounds of forward and inverse preheating in given time. Currently studies on different modes of preheating commissioning for crude oil pipelines are quite a few. The preheating effects of the different modes are also not compared systematically. Meanwhile, the studies on the preheating effects of different combinations of outlet temperature and flow rate in the process of preheating commissioning are not comprehensively studied.
Therefore, the thermodynamic characteristics of fluid for different preheating modes are studied first in this paper. Then the commissioning opportunity and most possible gelation regions are analyzed. Accordingly, the preheating effects for different modes are compared at the same preheating and commissioning time. Thus, the best mode for preheating commissioning is obtained. Finally, the preheating effects for different combinations of outlet temperature and flow rate are studied. The optimization of the preheating modes and the combinations may lead to a safe and efficient plan of preheating commissioning.
2. Mathematical Model and Numerical Simulation
2.1. Mathematical Model
A complete process of the preheating commissioning consists of two parts: preheating and fluid replacement. The preheating can be categorized into four modes: forward preheating, inverse preheating, forward-inverse transport preheating, and inverse-forward transport preheating, according to the transporting manners of preheating fluids. The “forward” is defined as the direction from the first pumping station (origin) to the last pumping station (terminal) while the “inverse” is defined as the opposite direction of the forward direction. The fluid replacement is the process that the preheating fluid is completely pushed out of the pipeline. Apparently, the transportation of the hot crude oil is always forward.
According to the heat transfer of fluids in the pipeline and the heat conduction of surrounding soil, the mathematical model of fluid flow and heat transfer is established. For simplification of computations, the following assumptions are made: (1) the fluid temperature, pressure, and velocity of normal operations are considered as constants in the same cross section and functions of time and axial positions; (2) the soil surrounding the pipeline is considered as isotropic medium; (3) the heat conduction of the soil is simplified to be two dimensional because the temperature gradient along the pipeline axis is much smaller than that along the radius; (4) the mixing of the preheating fluid (water) and the transportation fluid (crude oil) is not taken into consideration; (5) the rectangular area with the depth from the ground 10 m and width 20 m, as shown in Figure 1, is considered as the heat-influenced region of the pipeline [13, 14].
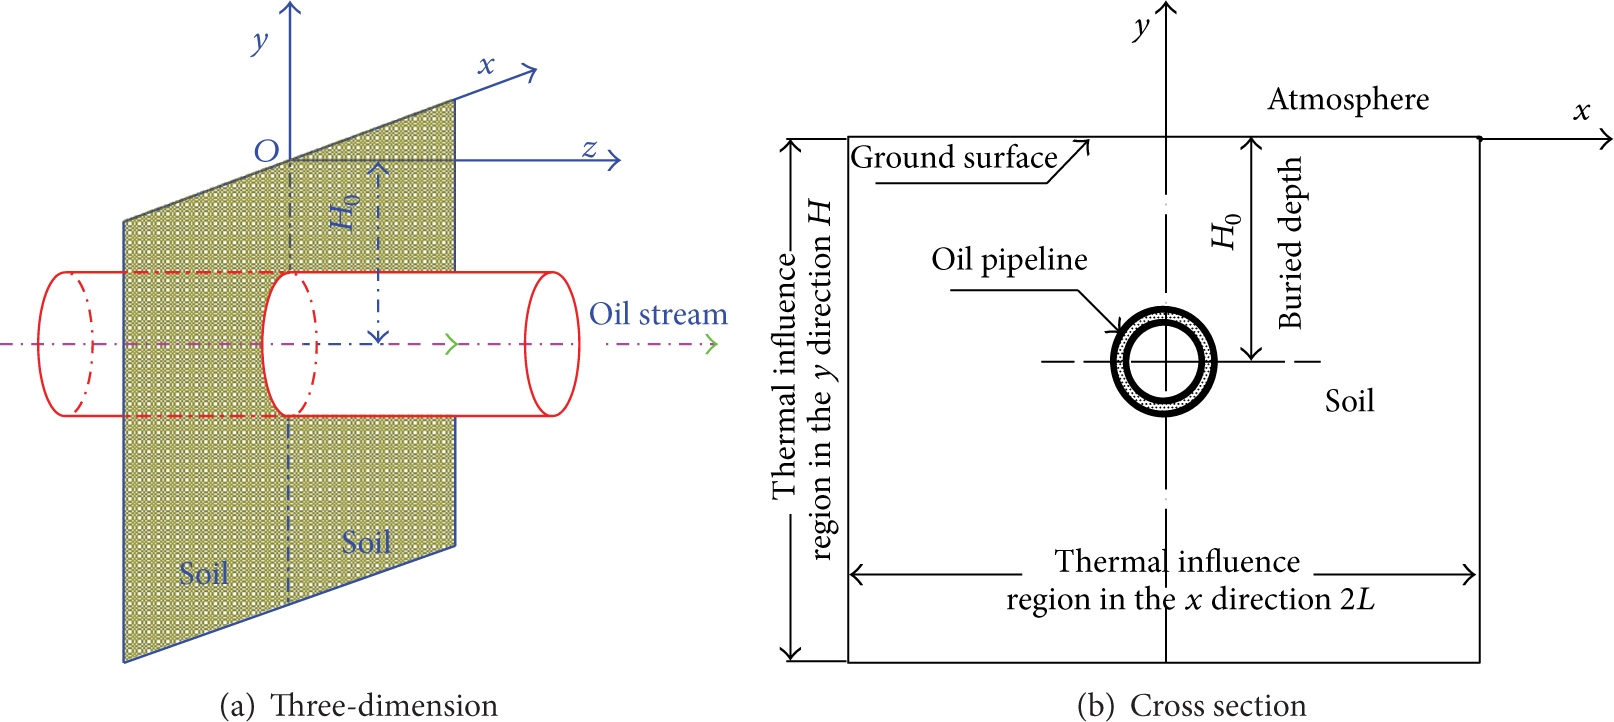
Schematic diagram of the computational domain.
Based on the above assumptions and simplifications, a mathematical model can be established as follows [15].
Heat transfer equation between the fluid and the pipe wall [16]:

where τ is time, s; ρ the average density of the fluid over the cross section, kg/m3; V the mean velocity of the fluid, m/s; p the mean pressure on the cross section, Pa; f the Darcy friction factor; q the heat flux, W/m2; D the inner diameter of the pipeline, m; C p the specific heat at a constant pressure of the fluid, J/(kg·°C); β the expansion coefficient of the fluid, °C−1; T the fluid temperature, °C.
Heat conduction equations of the pipe wall and the corrosion protective covering:

where i = 1, 2 represent the pipe wall and the corrosion protective covering, respectively; ρ i is the density of the ith layer, kg/m3; C i the specific heat of the ith layer, J/(kg·°C); T i the temperature of the ith layer, °C; λ i the heat conductivity of the ith layer, W/(m·°C); r the radial position, m; θ the circular angle.
Heat transfer equation of the surrounding soil:

where ρ s is the density of the soil, kg/m3; C s the specific heat of the soil, J/(kg·°C); T s the temperature of the soil, °C; λ s the heat conductivity of the soil, W/(m·°C); x the horizontal distance to the center of the pipeline, m; y the vertical distance from the ground to the center of the pipeline, m.
Matching conditions: the crude oil, the pipe wall, the corrosion protective covering, and the soil are tightly coupled for the heat transfer process, with substantial effects from one component on the others. Their coupling interactions can be described by the following equations:
interface between the fluid and the pipe wall:
interface between the pipe wall and the corrosion protective covering:

interface between the corrosion protective covering and the soil:
Boundary conditions: due to the symmetry, only the right half of the computational domain (10 m × 10 m) is used so that the boundary conditions can be written as follows:
at y = 0: λ s (dT s /dy) = α a (T a − T s ),
at x = 0 and − (h0 − R) ≤ y ≤ 0/ − H ≤ y ≤ − (h0 + R): λ s (dT s /dx) = 0,
at y = − H: T s = T n ,
at x = L: λ s (dT s /dx) = 0,
where h0 is the depth of the pipeline center, m; R the outer radius of the pipeline including the corrosion protective covering, m; α a the heat transfer coefficient between ground surface and atmosphere, W/(m2·°C); T a the air temperature, °C; T n the temperature of the constant-temperature layer of the soil, °C; H the vertical depth of the heat-influenced region of the pipeline, m; L the half width of the heat-influenced region of the pipeline, m.
Initial conditions: the initial conditions are nature conditions. The soil temperature is nature temperature and the temperature of pipe wall and corrosion protective covering are the same as the soil close to them.
2.2. Numerical Simulation
Quadrilateral meshes are applied to discretize the soil regions. The further the soil is away from the pipeline, the lesser it will be affected by the hot fluid pipeline, and meanwhile, the lesser the temperature gradient will be. Therefore, the meshes close to the pipeline have to be denser than those far away from it, as shown in Figure 2. A structural mesh generation in polar coordinates is applied to the pipe wall and the corrosion protective covering, as enlarged in Figure 3. A finite difference method is used in discretizing the pipeline, as Figure 4 shows, and a finite volume method is used in discretizing the heat exchange equation for the pipe wall, the corrosion protective covering, and the soil.
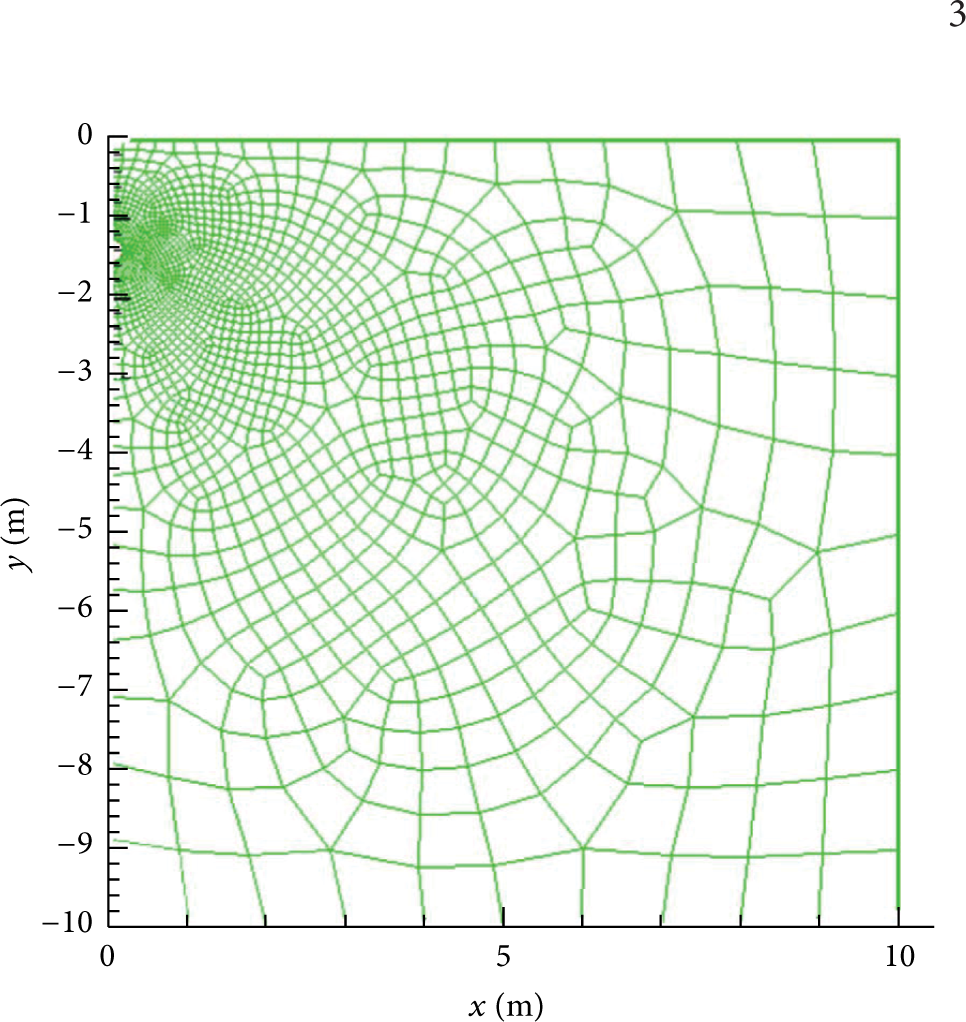
Meshes generation of the soil region.

Local expanded view of the meshes generation.
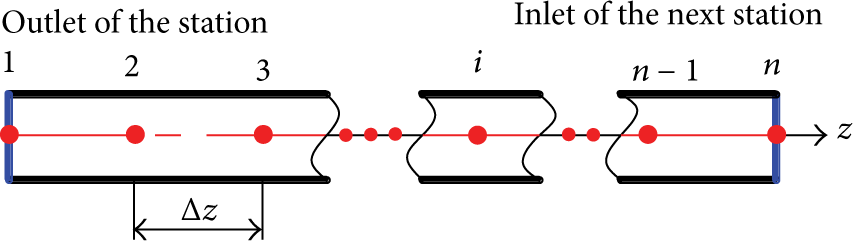
Computational noes of the pipeline.
The discretizing equations are solved with the Gauss-Seidel method, and the results we have achieved are presented mesh independent both temporally and spatially. The solution diagram is shown in Figure 5.

The solution diagram.
3. Model Validation
3.1. Validation Case for the Daqing-Tieling 3rd Pipeline
The newly commissioned Linyuan-Taiyangsheng-Xinmiao sector of the Daqing-Tieling 3rd pipeline is 120.09 km long with the outer diameter 813 mm. The distance between Linyuan and Taiyangsheng is 51.83 km. Russia oil is adopted for the preheating commission with the flow rate 2450 m3/h. These actual operation data are applied to the model validation. The inlet oil temperatures of the Taiyangsheng station and the Xinmiao station are calculated and shown in Figure 6. The maximum and mean deviations between the calculated temperature and the actual temperature are 2.1°C and 1.2°C, respectively.
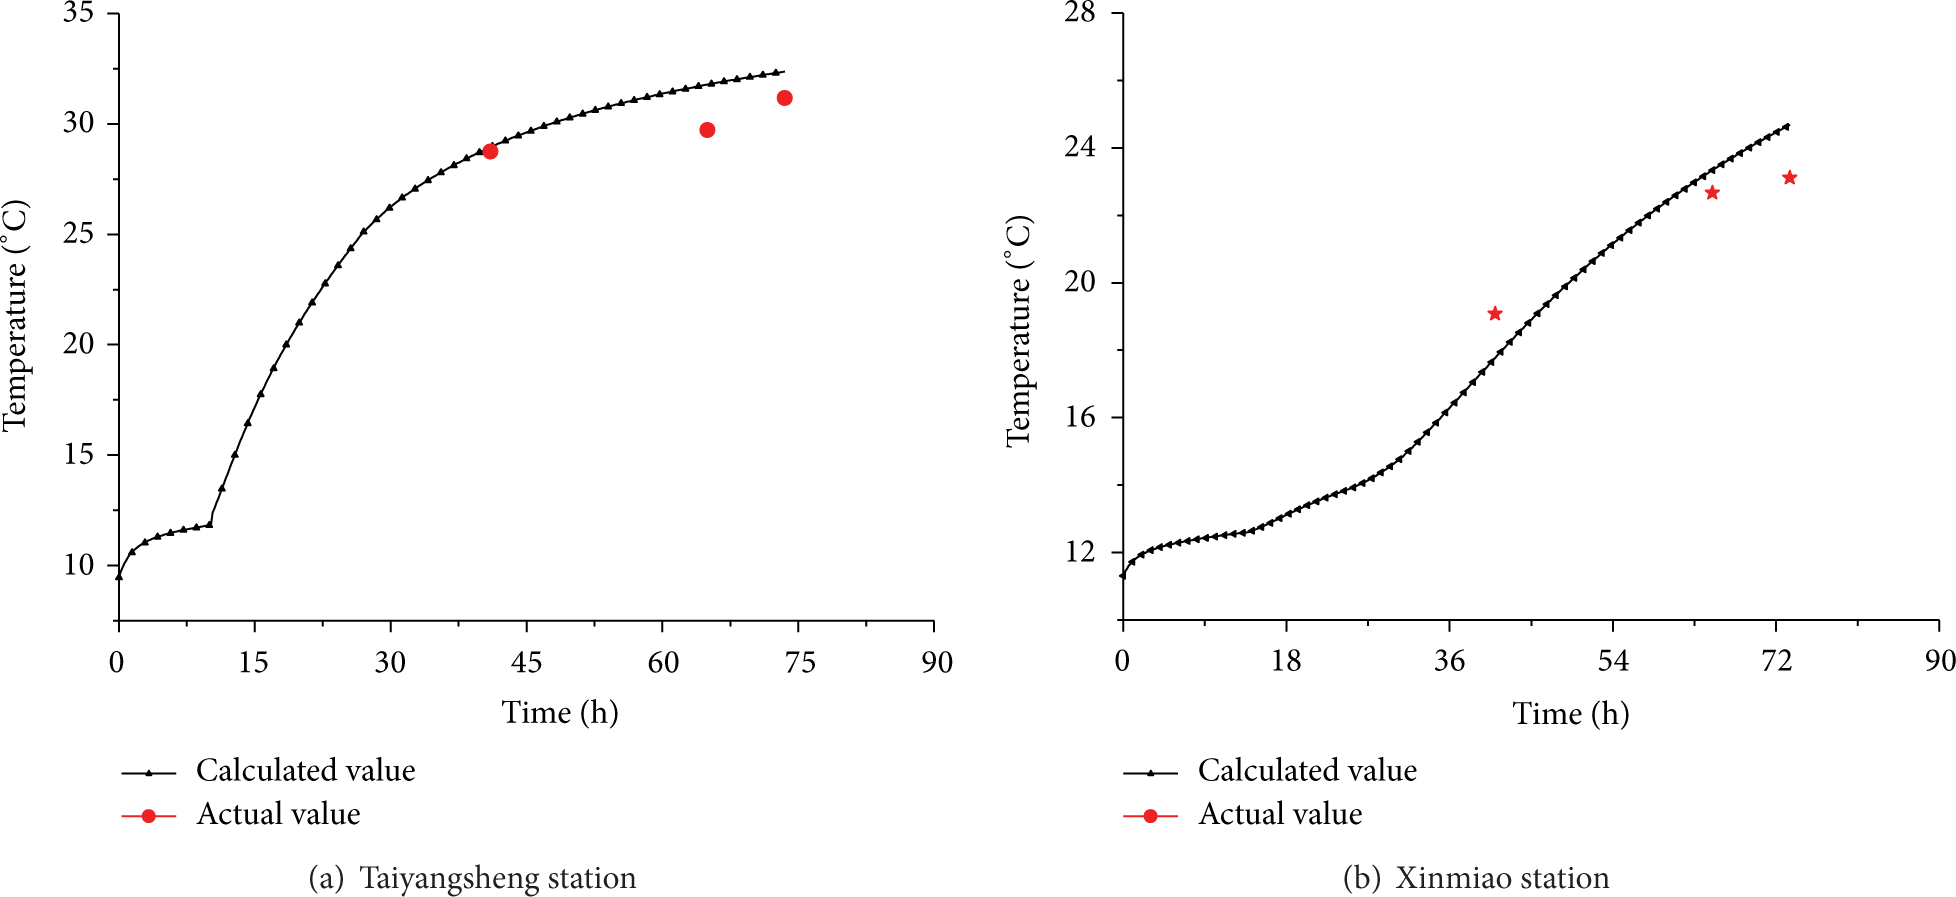
Model validation by inlet temperature.
3.2. Validation Case for the Niger Pipeline
The Niger Agadem-Zinder Pipeline has the full length of 462.5 km, the outer diameter of 323.9 mm, and 5 heating stations besides the stations at the two ends. The preheating commissioning by light oil is adopted for the whole pipeline. Forward preheating lasts for 119 h with the flow rate of 149 m3/h, followed by 30 h inverse preheating with the flow rate of 138 m3/h. According to these data, the oil temperature distribution can be obtained at the ending moment of the preheating, as shown in Figure 7. The maximum and mean deviations between the calculated temperature and the actual temperature are 3.1°C and 1.7°C, respectively.
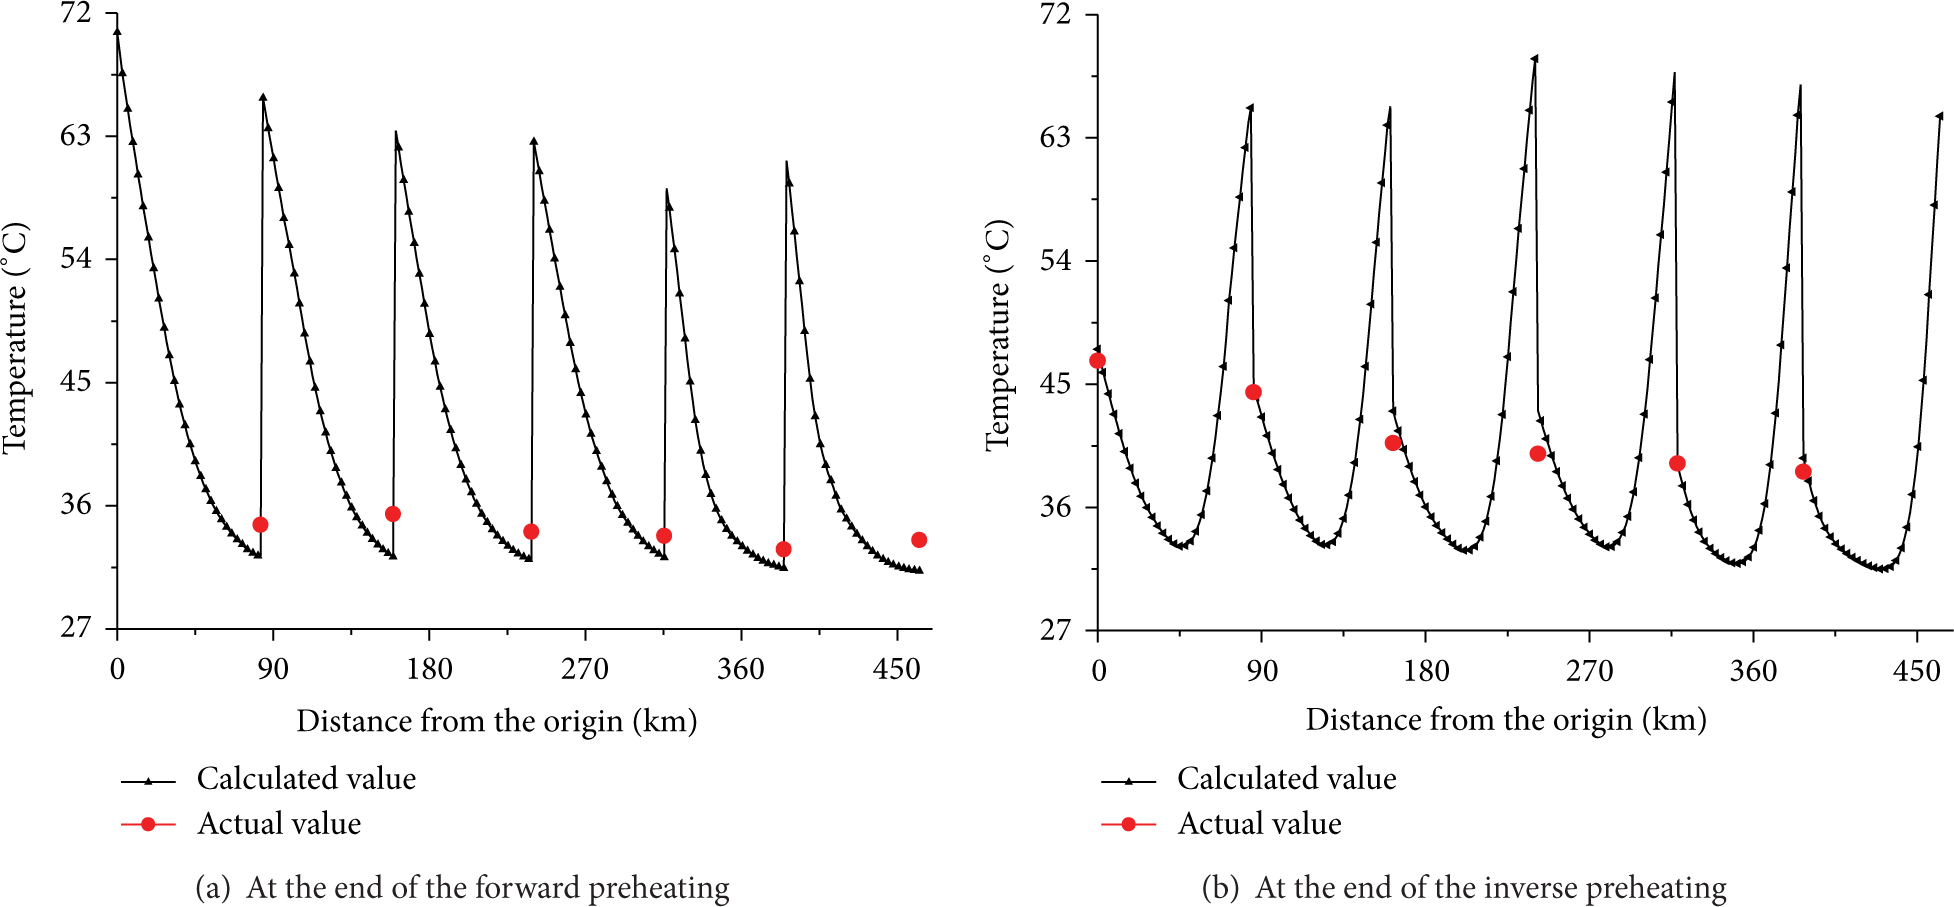
Model validation by oil temperature distribution along the pipeline.
The deviations mainly come from the thermal parameters such as heat conductivity of the surrounding soil because the heat conductivities in the sampling places can hardly describe the whole characteristics along the pipeline due to various regions and climates. However, the calculation precision is acceptable so that the model and the code can be considered to be accurate.
4. Studies on Preheating Commissioning
The commissioning mode in this paper is hot water preheating followed by crude oil. The objective is focused on single pipeline sector between two stations. There are two parts in this section, that is, thermal characteristics of different preheating processes and comparative analysis of different preheating modes.
4.1. Thermal Characteristics of Preheating Processes
Fluid temperature variation is studied in this section for the preheating commissioning of the waxy crude oil pipeline, taking the forward preheating, the inverse preheating, the forward-inverse transport preheating, and the inverse-forward transport preheating commonly used in real commissioning as examples. The computational parameters are from the new waxy crude oil pipeline: station interval 100 km, outer diameter 720 mm, depth of the pipe center 1.5 m, outlet temperature 48°C, the heat conductivity of the soil 1.4W/(m·°C), the undisturbed temperature of soil at the position of pipe center 3°C, and flow rate 2100 m3/h.
4.1.1. Thermal Characteristics of Forward Preheating
The forward preheating mode is taken as 72 h forward transportation of hot water followed by 72 h transportation of hot crude oil. The thermal characteristics in the whole process are analyzed in Figure 8. During the forward preheating (Figure 8(a)), the temperature of the hot water decreases gradually along the pipeline due to the heat loss to the soil surrounding the pipeline. Meanwhile, the soil is continuously heated by the water to narrow the temperature gap between soil and water so that the heat loss of the water is reduced. Thus, the water temperature at every point of the pipeline increases continuously with time. In the process of the fluid replacement (Figure 8(b)), the fluid temperature decreases fast at the upstream of the water-oil interface and increases a little at the downstream of the interface. The former phenomenon is because crude oil has a lower specific heat than water so that the temperature decrease of oil is larger with the same heat loss. The latter phenomenon is because the heat storage of the soil around the pipeline is promoted so that the total heat loss of the water at the downstream of the interface is reduced. When the replacement is completed, the oil temperature at the terminal of the pipeline decreases with time due to the incomplete preheating of the terminal and smaller specific heat of oil. To ensure safe transportation, the inlet temperature of crude oil should be above an onset value. However, from the analyses in Figure 8, even if the inlet temperature is above the onset value through the preheating commissioning process, it may continually decrease to the temperature lower than that value so that the pipeline also has the security threat. Therefore, the commissioning condition cannot be fully guided by the inlet temperature of the preheating fluid in engineering when the forward preheating is adopted.
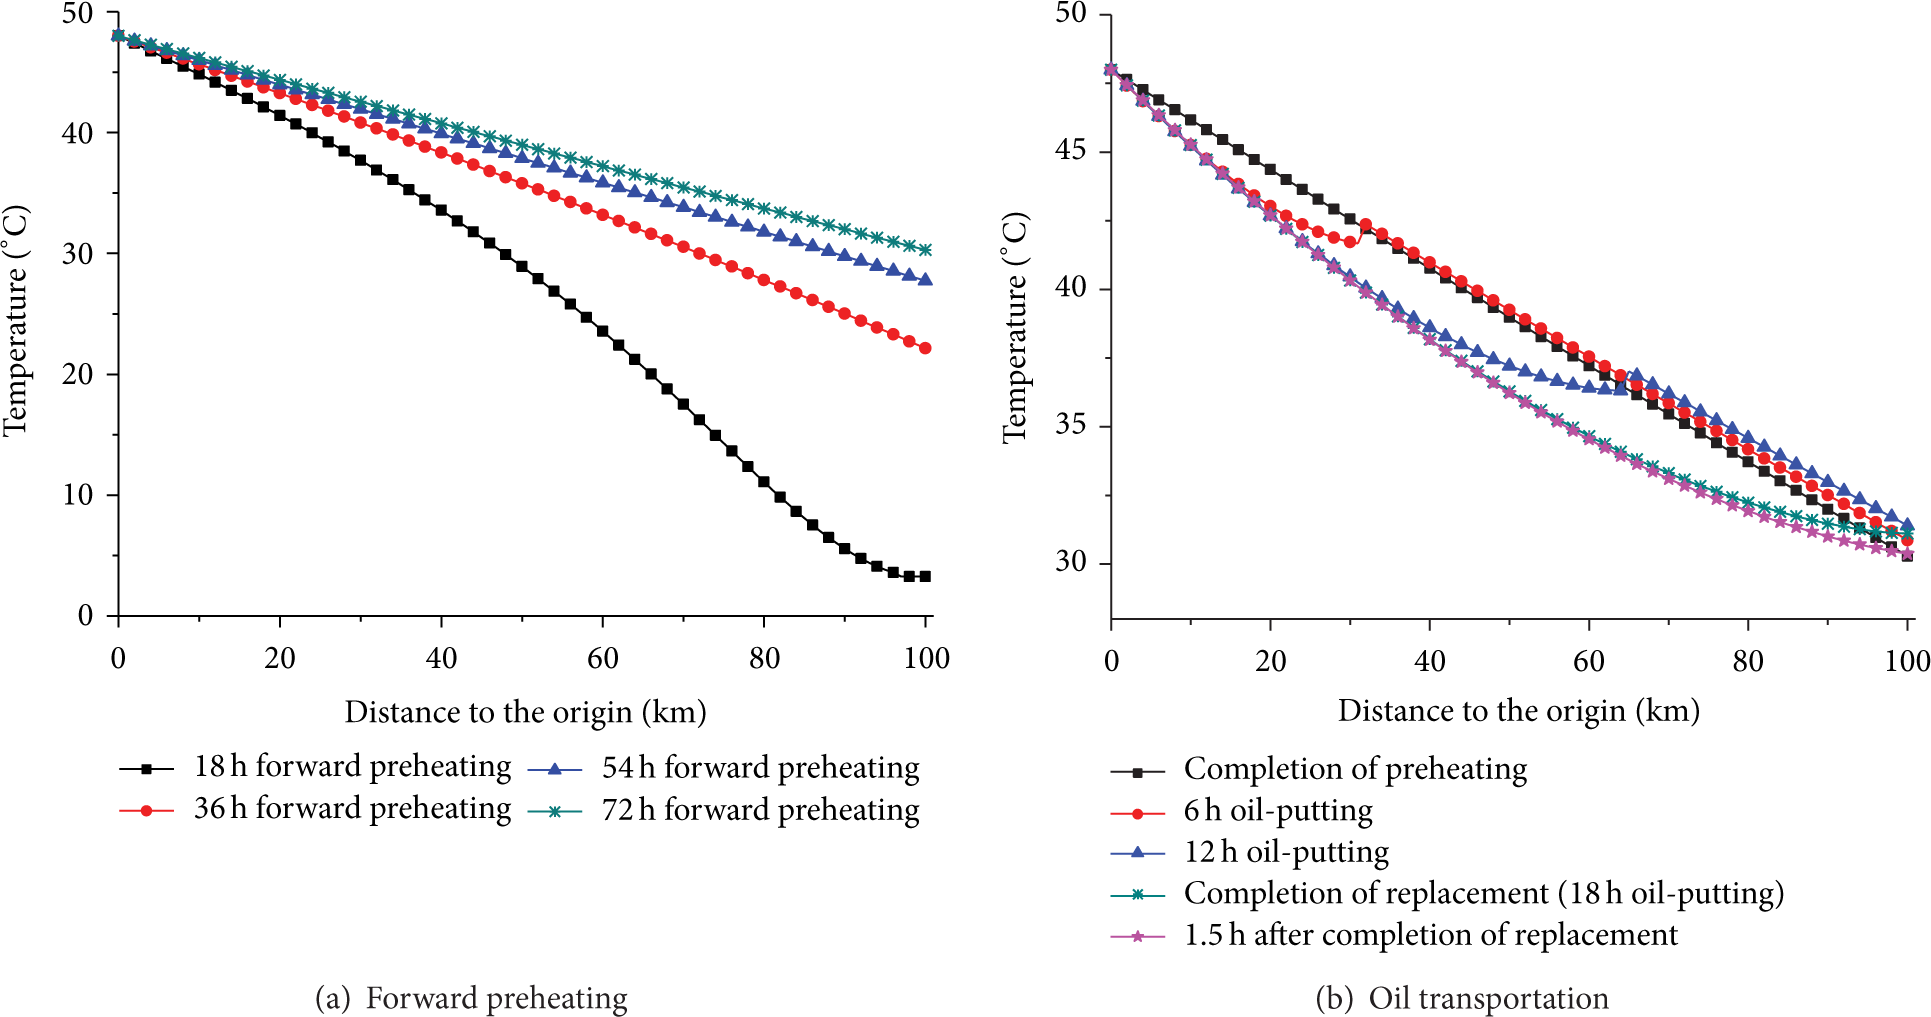
Fluid temperature along the pipeline for the forward preheating mode.
4.1.2. Thermal Characteristics of Inverse Preheating
The inverse preheating mode is taken as 72 h inverse transportation of hot water followed by 72 h transportation of hot crude oil. The thermal characteristics in the whole process are analyzed in Figure 9. The temperature of the hot water during the inverse preheating (Figure 9(a)) obeys the same law as that in the forward preheating in Section 4.1.1. During the fluid replacement (Figure 9(b)), the hot oil pushes the cooled water forward from the first station with the largest difference of temperatures at the interface of oil and water. The temperature difference becomes smaller along with the replacement process due to the following two reasons. One is that the water has closer temperature to the soil and larger specific heat so that the decrease of water temperature is slower. The other one is that the oil has much higher temperature and smaller specific heat so that the decrease of oil temperature is faster. When the fluid replacement is finished, the lowest temperature may not occur at the terminal of the pipeline (in this case, 74 km from the origin). After the replacement, the place for the lowest temperature will move toward the terminal accompanied with the continuous entering of the oil. In Figure 9(b), the lowest temperature moves to the place 77 km from the origin 1.5 h after the fluid replacement. It can be seen that the lowest temperature may gradually move from a certain position to the terminal after the replacement so that crude oil most likely gels at the certain position if shutdown occurs during this period. Thus, accurate prediction of thermal characteristics of crude oil at this most dangerous position is very important.

Fluid temperature along the pipeline for the inverse preheating mode.
4.1.3. Thermal Characteristics of Forward-Inverse Preheating
The forward-inverse preheating mode is taken as 36 h forward transportation of hot water and then 36 h inverse transportation of hot water followed by 72 h transportation of hot crude oil. The thermal characteristics in the whole process are analyzed in Figure 10. During the inverse preheating right after the forward preheating (Figure 10(a)), the hot water entering from the terminal will push the cooled water of the forward preheating process toward the origin of the pipeline. Thus, the lowest temperature occurs at the interface of hot water and the cooled water. The initial stage of the oil transportation (Figure 10(b)) is similar with that in the inverse preheating mode in Figure 9(b). However, the lowest temperature of oil exists in the place 79 km from the origin at the completion moment of the fluid replacement and moves to the place 83 km from the origin 1.5 h after the replacement. This is because the period of inverse preheating in this mode is shorter than that in the inverse preheating mode in Section 4.1.2. Therefore, the heat storage of the soil around the pipeline terminal is less so that the lowest temperature place is closer to the terminal.

Fluid temperature along the pipeline for the forward-inverse preheating mode.
4.1.4. Thermal Characteristics of Inverse-Forward Preheating
The inverse-forward preheating mode is taken as 36 h inverse transportation of hot water and then 36 h forward transportation of hot water followed by 72 h transportation of hot crude oil. The thermal characteristics in the whole process are analyzed in Figure 11.

Fluid temperature along the pipeline for the inverse-forward preheating mode.
The temperature of the hot water during the inverse-forward preheating (Figure 11(a)) obeys the same law as that in the forward-inverse preheating in Section 4.1.3. The fluid replacement is similar to that in the forward preheating mode in Section 4.1.1. After the fluid replacement, the inlet temperature has an apparent decrease. Thus, the commissioning condition cannot be fully guided by the inlet temperature of the preheating fluid also.
4.2. Comparison of Preheating Modes for Single Station-to-Station Pipeline
It is more concerned in engineering to efficiently form a soil temperature field which can guarantee the oil temperature satisfies the demand of safe operations. Therefore, the four preheating modes are compared in this section with the same preheating time. The cases are shown in Table 1.
Preheating plan in different preheating modes.
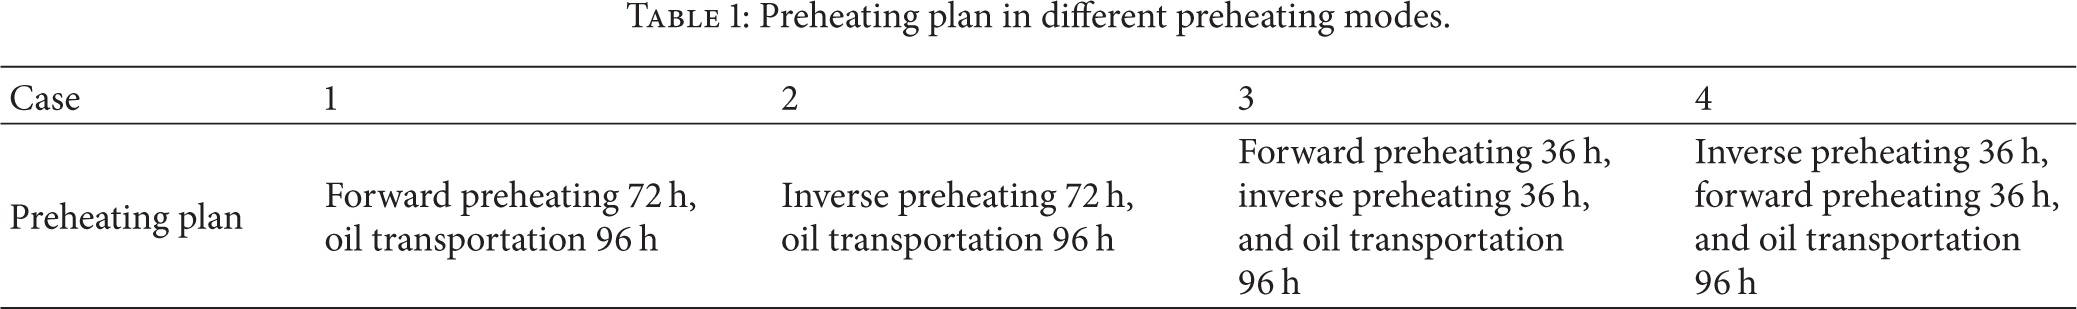
Figure 12 shows the transient characteristics of fluid temperature at different locations. Due to the different directions of the fluid in different preheating modes, during the first 36 h, the forward preheating and the forward-inverse preheating modes cause higher temperature of fluid than the other two modes at the upstream of the pipeline (Figure 12(a)). Opposite trend exists at the downstream (Figure 12(c)). At the center of the pipeline (Figure 12(b)), the four modes lead to the same temperature of fluid. After the fluid replacement, the oil temperatures at different places become stable gradually. For the waxy crude oil pipeline, the oil temperature, especially the inlet temperature, is most concerned with in engineering. At different positions, the oil temperature in the forward preheating mode is 0.3°C~1°C higher than all other modes; therefore, the forward preheating mode has the best effect.

Comparison of the four preheating modes by fluid temperature.
4.3. Optimization of Thermal Parameters
A safe and efficient preheating plan will make the inlet temperature of oil satisfy the demand as soon as possible. In order to achieve this target, it is commonly adopted to raise outlet temperature T R and increase flow rate Q of fluid. In actual operation, it is not possible to raise outlet temperature and flow rate simultaneously because of the limited power of the heating furnace. Therefore, taking the forward preheating mode as an example in this section, the preheating effects of different combinations of the outlet temperature and the flow rate are studied under different powers of the heating furnace, preheating times, and station intervals. In engineering, the inlet temperature of oil is most important so that the preheating effect is evaluated by the inlet temperature in this section.
4.3.1. The Influence of the Power of Heating Furnace
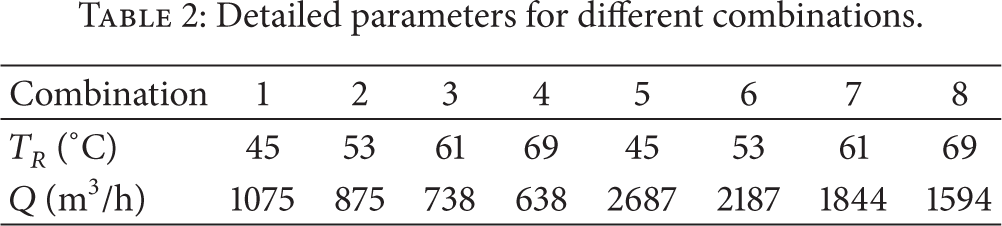
The computational parameters are as follows: station interval 100 km, outer diameter 720 mm, depth of the pipe center 1.5 m, the heat conductivity of the soil 1.2 W/(m·°C), and the undisturbed temperature of soil at the position of pipe center 3°C. The forward preheating mode is taken as 72 h forward transportation of hot water followed by 96 h transportation of hot crude oil. The powers of the heating furnace are 40000 kW (Combinations 1~4 in Table 2 use this rated power) and 95000 kW (Combinations 5~8 in Table 2 use this rated power), respectively. Detailed parameters are shown in Table 2.
Detailed parameters for different combinations.
The transient characteristics of fluid temperature at the terminal of the pipeline are shown in Figure 13. With the lower power of heating furnace, such as 40000 kW in Figure 13(a), the combination with lower outlet temperature of water will produce higher inlet temperature of oil. For example, the inlet temperature of oil of Combination 1 is 3.7°C higher than that of Combination 4 when the inlet temperatures are relatively stable. Inverse phenomenon is found with the higher power of heating furnace (Figure 13(b)); that is, the combination with higher outlet temperature of water will produce higher inlet temperature of oil. For example, the inlet temperature of oil of Combination 8 is 2°C higher than that of Combination 5 when the inlet temperatures are relatively stable. It can also be seen that the inlet temperature of water is about 3~9°C higher than that of oil during the preheating commissioning under different combinations. Therefore, the commissioning condition cannot be fully guided by the inlet temperature of the preheating fluid in engineering when the forward preheating is adopted. This verifies the opinion mentioned in Section 4.1.1. Similar phenomenon was introduced in literature [12].

Fluid inlet temperature variation under different heating furnace powers.
With the lower power of heating furnace, the quantity of heat that fluid carries is relatively small, and thus the inlet temperatures of oil of Combinations 1~4 are all comparatively low. Under the combinations of lower flow rate, the heat losing time for unit mass of fluid is longer and this may be the main reason for the heat loss in the process of preheating commissioning. Thus, the inlet temperatures of oil decrease more sharply under the combinations of lower flow rate. Therefore, the combinations of lower outlet temperature and higher flow rate may produce better preheating effects.
With the higher power of heating furnace, the quantity of heat that fluid carries is relatively more, and thus the inlet temperatures of oil of Combinations 5~8 are all higher compared with Combinations 1~4. Although the heat losing time for unit mass of fluid is longer under the combinations of lower flow rate, the inlet temperature of oil is higher. This is mainly because of the relatively larger quantity of heat that fluid carries and the higher outlet temperature of fluid. Although the oil temperature drop along the pipeline decreases more sharply under the combinations of lower flow, the inlet temperature of oil is much higher than that of the combinations of higher flow rate. Therefore, the combinations of higher outlet temperature and lower flow rate may produce better preheating effects.
Figure 14 shows the oil temperature along the pipeline after 96 h oil-putting. The temperature of oil drops moderately along the pipeline under the combinations of lower outlet temperature and higher flow rate. Meanwhile, the oil temperature drops much more significantly along the pipeline under the combinations of higher outlet temperature and lower flow rate. The main reason of these phenomena is that the lower outlet temperature with higher flow rate will lead to shorter heat-losing time for unit mass of fluid, as well as weaker heat transfer rate. Similarly, the higher outlet temperature with lower flow rate will lead to the opposite effect.

Oil temperature along the pipeline after the completion of oil transportation.
With the lower power of heating furnace (Figure 14(a)), the combinations of higher outlet temperature and lower flow rate will lead to higher oil temperature at the upstream of the pipeline. Completely opposite trend exists at the downstream. Thus, the combinations of lower outlet temperature may produce the preheating effects of higher oil temperature along the downstream of pipeline. With the higher power of heating furnace (Figure 14(b)), the combinations of higher outlet temperature with lower flow rate will lead to higher oil temperature along the whole pipeline. Thus, the combinations of higher outlet temperature may produce the preheating effects of higher oil temperature at the downstream of the pipeline. Both of the trends are primarily determined by the quantity of heat carried by the fluid. In other words, small quantities of heat lead to sharp drop of oil temperature along the pipeline and large quantities of heat lead to moderate drop of oil temperature along the pipeline.
The preheating effects of different combinations under different powers of heating furnace are explained above. It can be summarized that a combination of lower outlet temperature and higher flow rate is preferred for a lower power of heating furnace while a combination of higher outlet temperature and lower flow rate is preferred for a higher power of heating furnace.
4.3.2. The Influence of Preheating Time
The comparison with the shorter preheating time has been done in Section 4.3.1. With the longer preheating time, the preheating effects of different combinations of outlet temperature and flow rate will be analyzed in this part. Optimal combinations under different conditions will be suggested. The forward preheating mode is taken as 720 h forward transportation (almost the longest preheating time in actual operation) of hot water followed by 480 h transportation of hot crude oil. The rated power of the heating furnace is 40000 kW (Combinations 1~4 in Table 2 are with this rated power). Detailed parameters can be obtained in Table 2. Other computational parameters are the same as that of Section 4.3.1.
With the longer preheating time (720 h), the transient characteristics of fluid temperature at the terminal of the pipeline are shown in Figure 15. The phenomenon is contrary to that of Figure 13(a). With the longer preheating time, the combinations of higher outlet temperature and lower flow rate will produce higher inlet temperature of oil compared with the combinations of lower outlet temperature and higher flow rate. For example, the inlet temperature of oil of Combination 4 is 5.3°C higher than that of Combination 1 after 96 h oil-putting. After 480 h oil-putting, the temperature difference between them is still 0.8°C. The main reason for this is that a large quantity of soil heat storage has been accomplished along the downstream of pipeline, and then the inlet temperature of oil will decrease less relatively compared with the inlet temperature of oil in Figure 13(a). Therefore, the combination of higher outlet temperature and lower flow rate will produce higher inlet temperature of oil, which means better preheating effects.

Fluid inlet temperature variation with 720 hours’ preheating.
With the longer preheating time (720 h), the oil temperature along the pipeline after the completion of oil transportation is shown in Figure 16. The phenomenon is very different from what was explained in Figure 14(a). With the longer preheating time, the oil temperature along the pipeline under the combinations of higher outlet temperature and lower flow rate is higher than that under the combinations of lower outlet temperature and higher flow rate. In the process of the longer preheating time, the soil heat storage will increase significantly, which will lead the decrease of the temperature difference between the oil and the soil around the pipeline so that the heat loss of the oil will be smaller. Thus, the temperature drop along the pipeline will reduce, which is the main reason for the above phenomenon.

Oil temperature along the pipeline with 720 hours’ preheating after the completion of oil transportation.
With different preheating times, the preheating effects of different combinations are analyzed in this part. In actual operation, a combination of lower outlet temperature and higher flow rate is more appropriate for a plan of shorter preheating time. If a plan of longer preheating time is available, a combination of higher outlet temperature and lower flow rate is more preferable.
4.3.3. The Influence of Station Interval
The comparison with the longer single station-to-station pipeline (100 km analysed in Section 4.3.1) has been done. With a shorter single station-to-station pipeline (30 km), the preheating effects of different combinations of outlet temperature and flow rate will be analyzed in this part. Moreover, optimal combinations under different conditions will be suggested. The power of the heating furnace is 40000 kW (Combinations 1~4 in Table 2 are with this rated power). For further analyses, the Combination 4* is added in this part. For Combination 4*, 36 h forward transportation (half time of that in Section 4.3.1) of hot water followed by 132 h transportation of hot crude oil is taken and the other computational parameters are the same as that of Combination 4.
With the shorter station interval (30 km), the transient characteristics of fluid temperature at the terminal of the pipeline are analyzed in Figure 17. The phenomenon is contrary to that of Figure 13(a). With the shorter station interval, the combinations of higher outlet temperature and lower flow rate will produce higher inlet temperature of oil compared with the combinations of lower outlet temperature and higher flow rate, without consideration of the Combination 4*. For example, after 24 h oil-putting, the inlet temperature of oil of Combination 4 is about 6°C, 4°C, and 2°C higher than that of Combination 1~3, respectively. Although the temperature drops along the pipeline of the combinations of higher outlet temperature and lower flow rate is larger than that of the combinations of lower outlet temperature and higher flow rate, the inlet temperature of oil of the former combinations is higher than that of later combinations. That is mainly because the temperature drop along the pipeline with a shorter station interval is much less than that with a longer station interval. The preheating time in Combination 4* is only 36 h (half of Combination 1). In the process of oil transportation, the lowest inlet temperature of oil of the Combination 4* is 1.9°C higher than that of the Combination 1. After 96 h oil-putting, the inlet temperature of oil of the Combination 4* is 4.8°C higher than that of the Combination 1. According to the analyses above, with a shorter station interval, the combinations of higher outlet temperature and lower flow rate will produce a higher inlet temperature of oil, which means a safer and more efficient preheating effect.

Fluid inlet temperature variation with 30 km station interval.
With a shorter station interval (30 km), the oil temperature along the pipeline after the completion of oil transportation is shown in Figure 18. The phenomenon is very different from what was explained in Figure 14(a). With the shorter station interval, the oil temperature along the pipeline under the combinations of higher outlet temperature and lower flow rate is higher than that under the combinations of lower outlet temperature and higher flow rate. The reason for this phenomenon has been explained in the analyses of Figure 17. Also, the oil temperature difference between the Combination 4 and Combination 4* increases along with the increase of distance from the origin. That is primarily because the soil heat storage around the pipe of unit volume decreases along with the increase of distance from the origin.

Oil temperature along the pipeline with 30 km station interval after the completion of oil transportation.
With different station intervals, the preheating effects of different combinations are analyzed in this part. A combination of lower outlet temperature and higher flow rate may produce a more safe and efficient preheating effect for a longer station interval. While for a shorter station interval, a combination of higher outlet temperature and lower flow rate may be more preferable
5. Conclusions
A numerical model has been established in this paper for the thermal characteristics of waxy crude oil in the preheating commissioning process. The numerical results are validated to coincide well with the field test data. Moreover, preheating modes and plans for single station-to-station pipeline are studied. Then optimal combinations of outlet temperature and flow rate are suggested under different preheating commissioning conditions for forward preheating mode. Some conclusions can be made as follows.
For the forward and inverse-forward preheating modes, the commissioning opportunity cannot be fully determined by the inlet temperature of preheating fluid. Preheating history and parameters are also important, such as preheating time, power of heating furnace, station interval, and combination of outlet temperature and flow rate.
For the inverse and forward-inverse preheating modes, the lowest temperature region with congelation risk is not located at the pipeline terminal after the fluid replacement. The location depends on the thermal characteristics and preheating history.
For the same preheating time, the forward preheating mode has the best effect among the four modes.
Under good conditions for preheating commissioning, such as higher power of heating furnace, longer preheating time and shorter station interval, and a combination of higher outlet temperature and lower flow rate may produce a safer and more efficient preheating effect, while a combination of lower outlet temperature and higher flow rate may be optimal under bad conditions for preheating commissioning.
Conflict of Interests
The authors declare that there is no conflict of interests regarding the publication of this paper.
Footnotes
Acknowledgment
The study is supported by the National Science Foundation of China (nos. 51325603, 51206186, and 51276198).