
Abstract
Nanoparticle-based planar laser scattering (NPLS) experiments and large eddy simulation (LES) were launched to get the fine structure of the supersonic planar mixing layer with finite thickness in the present study. Different from the turbulent development of supersonic planar mixing layer with thin thickness, the development of supersonic planar mixing layer with finite thickness is rapidly. The large-scale structures of mixing layer that possess the characters of quick movement and slow changes transmit to downriver at invariable speed. The transverse results show that the mixing layer is strip of right and dim and possess 3D characteristics. Meanwhile the vortices roll up from two sides to the center. Results indicate that the higher the pressure of the high speed side is, the thicker the mixing layer is. The development of mixing layer is restrained when the pressure of lower speed side is higher. The momentum thickness goes higher with the increase of the clapboard thickness. Through increasing the temperature to change the compression can affect the development of the vortices. The present study can make a contribution to the mixing enhancement and provide initial data for the later investigations.
1. Introduction
Scramjet is prosperously investigated by all around the world because of its great performance in hypersonic flight condition. Supersonic reacting mixing layer is the typical flow structure in Scramjet. Although the structure is very simple, it contains almost all of the problems that relate to the chemistry and fluent. As this reason, it is very important to understand the inner mechanism. Supersonic reacting mixing layer is absolutely mixed by fuel and air; so studying on the supersonic turbulent mixing is worthy.
Mixing layer contains planar mixing layer and annular mixing layer geometrically. Two airstreams at different velocity flow through a strut which is one of the typical flow structures [1]. This flow structure can produce vortices because of K-H instability. The question attracted many investigators’ attention during the last ten years. Experimental results of reacting and nonreacting [2, 3] have been validated by simulation [4, 5] in the condition of this structure. But among all the models, the thickness of the strut is very small and the instability of the recirculating flow is not intensity. But the mixing layer of dual-combustor ramjet (DCR) is the typical mixing layer that flows through clapboard with limited thickness.
Different from the development of the supersonic planar mixing layer with thin thickness, the mixing layer with finite thickness possesses more complex flow structure. Since the clapboard is not thin, the shear layers border a recirculation region immediately just behind it. The edge of the recirculation region is the adjacent flow. The development of large-scale structures of mixing layer relates to the instability of recirculation zone and recompression shock that behind the recirculation zone. The former studies [6, 7] indicate that flame-holding depends on the recirculation zone behind the strut. Increasing the thickness of the strut can enhance the mixing and stability of the flame. Someone had found that in the progress of the combustion of H2/Air, the mixing condition decides the reacting. Different thickness of the strut affects the reacting directly [8, 9]. But the thicker the strut is, the bigger total pressure loss increases. Therefore, it is very necessary to study on the supersonic mixing with finite thickness.
Smith and Dutton [10] studies of the large-scale structure have suggested the thickness of the clapboard decides the development of the large-scale structure. Zhihui et al. [11] and Jiangfei et al. [12] also find similar conclusion through simulation. But these studies mainly concentrate on simulation or the thickness of the clapboard is really small. That is to say, there is no fine evidence to support the conclusions.
NPLS experiments and LES were launched to investigate supersonic mixing layer with finite thickness in order to explore the characteristics of the flow in the present study.
2. Experimental Techniques
2.1. Experimental Setup
All the experiments were operated in a supersonic suction type wind tunnel. A flat splitter is embedded along the center line from inlet of the tunnel to the beginning of the lava nozzle. Through changing the experimental models to investigate the effects of different experimental conditions in the present study. The model consisted of a double Mach number nozzle terminated with a limited thickness trailing edge, shown as Figure 1. In order to investigate the characteristic of large-scale structures and effects of the geometrical structure and the pressure, NPLS experiments and LES were launched. The conditions of the experiment and simulation are shown in Table 1.
The condition of supersonic planar mixing layer experiment.

Annotate: M1, M2 are up and down Mach number, respectively; P1, P2 are up and down static-pressure, respectively.

Schematic of experimental model.
2.2. Experimental Technology
Based on Rayleigh scattering, Yu-xin [13] ameliorated the technology to nanoparticle-based planar laser scattering (NPLS). In NPLS, nanoparticles and pulsed planar laser were used as tracer and illumination, respectively. With the use of NPLS, complex flow structures including shock, boundary layer, oblique shock, and mixing layer can be imaged at high signal-to-noise ratio and high spatiotemporal resolution. The system consists of a computer, a charge couple device (CCD) camera, a synchronizer, a nanoparticle generator, and a double-pulsed laser with pulse energy of 350 mJ per 6 ns and wavelength of 532 nm.
Through changing the pressure of the nanoparticle generator to control the density of the nanoparticle, variation of the concentration of the nanoparticle can show the density of the flow by using the system and characteristics of the density fluctuation can be revealed.
3. Physical Models and Numerical Scheme
3.1. Physical Model
Based on the experimental model and to decrease the calculation, the physical model has been simplified as Figure 2. The flow parameters were chosen to be the same as the experiments. Meanwhile 2D and 3D simulation are carried for different analyses.
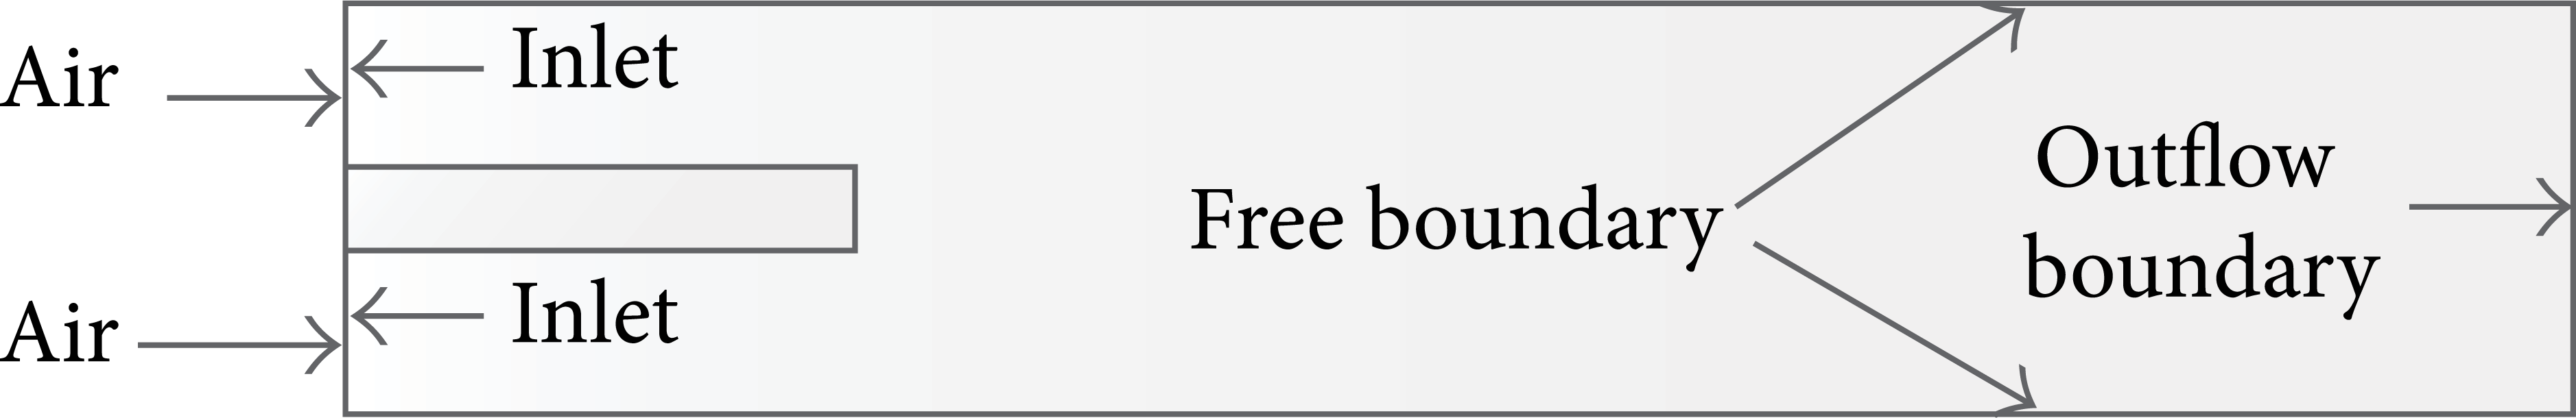
Schematic of calculation model.
3.2. Numerical Scheme
In the present study, the Deardorff box filtering and Favre average method were adopted to filter the unsteady compressible Navier-stokes equations. One-equation Yoshizawa SGS [14] model is used. Inviscid fluxes are discretized by the fifth-order WENO scheme [15]. A second-order-accurate centered scheme was used for viscous fluxes. In order to improve the efficiency of calculation, the two-order Runge-Kutta method that possesses the character of TVD was used for time integration. And in the present study, the stream-wise positions are normalized by the height H which is the height of the experimental section.
4. Results
4.1. Based Flow Structures
Just as Figure 3 shows, the development of the supersonic planar mixing layer with thin thickness can be divided into three parts including (I) laminar flow section, (II) transition section, and (III) complete turbulent section. At the beginning, the laminar flow section is clear. In this section the main characteristic is molecular diffuse and velocity shear. With the development of the mixing layer, the instability of K-H and velocity shear led the vortices to roll up. In this section momentum exchange and K-H vortices are the main characteristics. When come into the complete turbulent section, vortices come to match and combine. The vortices break up and become abnormity finally.

NPLS visualization result of h = 1 mm.
Figure 4 shows 0–90 mm NPLS visualization result of h = 10 mm. Different from the structure with thin thickness, the structure of supersonic planar mixing layer with finite thickness is more complex. Since the clapboard is not thin, the shear layers border a recirculation region immediately just behind it. The edge of the recirculation region is the adjacent flow. Because of the thickness of the clapboard, Re is very high. The flow changes into turbulent immediately, the edge of the recirculation region shows itself turbulent. There are two shock waves at the end of the recirculation because of the recompression.

0–90 mm NPLS visualization result of h = 10 mm.
The particular of the beginning can be also illustrated as Figure 4. The reattachment point is distinguished as pentangle. With the spreading of the shock waves, the mixing layer becomes thick and the large-scale structures come up. At the same time, the shock waves bend because of the function of the large-scale structures. It is found that the K-H vortices do not appear at the beginning of the mixing layer. Turbulent mixing makes the large-scale structure roll up faster and mixing layer increasing thicker. At the same time, the vortices break down very rapidly and form some clusters. This phenomenon can be clearly captured in the dashed rectangular region. The progress shows that the development of the large-scale structure possesses periodicity character.
Figure 5 gives the transverse NPLS visualization results. It can be seen that the density of the recirculation region is small and the light and dim parts which respect high and low speed side, respectively, distributing like some strips at the center plane of the transverse. It can be concluded that the planar mixing layer with finite thickness possess 3D characteristic. That is to say, to find out the in-depth information, simulation on the supersonic mixing layer with finite thickness should be launched on the 3D model.

Transverse NPLS visualization results.
Experimental studies relate to high speed flows are expensive and take time; the change of the condition cannot come true easily. To make up the inherent weakness of the experiments, simulation was needed. In the present study, LES was used to investigate the supersonic mixing layer on the same condition with the experimental flow parameters. Figure 6 gives the compared results of experiment and simulation. It shows that the simulation and experiment have the similar flow structure. But simulation is sensitive to the boundary layer. There are some differences between them. The recirculation region is smaller than the experimental results. The position of the reattachment point and the pentangle which respect the point of the intersection are also ahead of the experimental result. Since the expansion wave is weak, it cannot be distinguished in experiments. It may be the biggest difference between simulation and experiment. At the beginning, the mixing translates to turbulent rapidly in the experiment while in the simulation the progress exists in microlaminar section. Two shock waves near the pentangle in the downriver are captured in the experiment. These differences mainly lie in the differences of boundary parameters between the simulation and experiment. Simulation can present more information of the flow.

Compared results of experiment and simulation.
4.2. Characteristics of Vortices
In order to investigate the periodicity character of the large-scale structures, the technic of span frame has been used to get the variety of the picture in a small time. Reasonable of choice for a time, the movement of the large-scale vortices can be captured between two pictures.
Figure 7 shows the NPLS visualization results at the interval of 700 ns. Three different locations along stream-wise shown as the circles in the picture have been studied. Partially enlarged details of vortices are shown in Figure 8. The results show that the vortex in the circle of (a), (b), and (c) moves 0.365 m at the speed of 521.4 m/s, 0.371 m at the speed of 530 m/s, and 0.378 m at the speed of 540 m/s, respectively. It seems that the large-scale vortices transmit to downriver at invariable speed. At the same time, the large-scale vortices do not change essentially. That is to say, the large-scale vortices possess the characters of quick movement and slow changes.
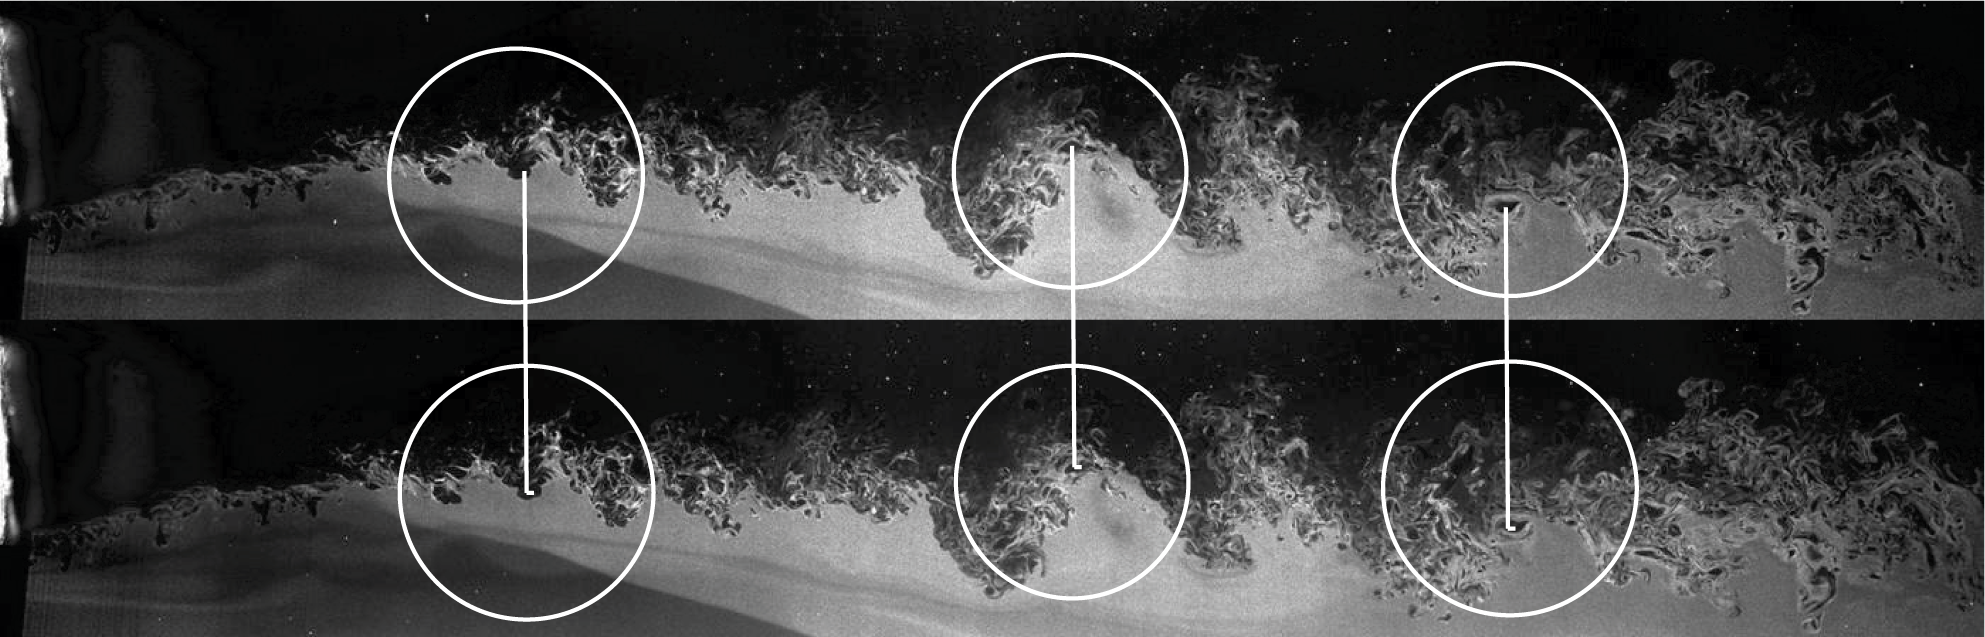
NPLS visualization results at the interval of 700 ns.

Partially enlarged details of vortices.
Based on the structure of the tunnel, it is difficult for the camera to capture the images in focus along the stream-wise. To find out the development of the vortices in different planes along the stream-wise, simulation was used. The results (Figure 9) indicate that the vortices roll up from the two sides to the center. From the upriver to the downriver the change of the vortices can be distinguished clearly. As Figure 10 shows, at the beginning the two airstreams have not collided with each other. The stream-wise positions are normalized by the height H which is the height of the experimental section. The interface of the streams can be identified and with the developing of the mixing, the vortices roll up and come up together to form large-scale structures. At the downriver, the scale of the large eddies is almost the same and beak up rapidly. The vortices possess 3D character and provide instability for the mixing.

Development of the vortices in different planes along the stream-wise.

Instantaneous structures of vortices in different planes.
4.3. Discussion of Pressure-Matching Condition
Compression is an important object to investigate the supersonic mixing layer. Different pressure-matching conditions lead the instability of the vortices different and affect the mixing.
Figure 11 shows the instantaneous NPLS visualization results of the different pressure-matching conditions. From up to down in the picture is the situation that the pressure of low speed side is higher, pressure matching, the pressure of the high speed side is high. It seems that the beginning part of the mixing layer is complete turbulent section. Pressure nonmatching results in the strength and the span of the shock wave are different and affect the development of the large-scale structure finally.

NPLS visualization results of the different pressure-matching conditions.
Figure 12 shows the velocity profile development along the stream-wise of different pressure-matching conditions based on the PIV results. The stream-wise positions and span-wise are normalized by the height h which is the height of trail thickness of nozzle. It can be found that at the beginning all the velocity profiles are lagging at the center where located at the recirculation region. Because of the function of the compression and shock, the mixing layer is partial to the lower pressure side. With the development of the mixing layer the velocity trends to level at the center line. The results suggest that the higher the pressure of the high speed side is, the thicker the mixing layer is. The development of mixing layer is restrained when the pressure of lower speed side is higher. Of all the conditions the velocity profiles are eliminated similarly because of the integer function of transmitting of shocks and rolling up of vortices.

Velocity profiles of different pressure-matching conditions.
Figure 13 gives simulation results of time averaged velocity and vortices. The stream-wise positions are normalized by the height H which is the height of the experimental section. Just similar to the experimental results, the velocity trends to level at the center. The progress of leveling can illustrate the mixing efficiency in some ways. Meanwhile the shock penetrates the mixing layer at different location and it can be concluded that the pressure nonmatching is where the onset instability for the generation of the large-scale vortices. Adopt the momentum thickness which is defined as

where u* = (u − u b )/(u a − u b ) and u a , u b are the speed of the upper and lower side, respectively. The results, shown as Figure 14, suggest that the higher the pressure of the high speed side is, the thicker the mixing layer is. The development of mixing layer is restrained when the pressure of lower speed side is higher.

Time averaged velocity and vortices of different pressure-matching conditions.

Momentum thickness of different pressure-matching conditions.
4.4. Discussion of the Clapboard Thickness
Just as the former said, some conditions cannot be operated easily. Simulation is the best method to solve the problem and give some references for the experiments. The former studies [16, 17] indicate that flame-holding depends on the recirculation zone behind the strut. Different thicknesses of the strut affect the reacting directly. But the thicker the strut is, the bigger total pressure loss increases. Therefore, it is very necessary to study on the clapboard thickness effects on the supersonic mixing.
Figure 15 illustrates density contours and vortices of different thicknesses. From up to down are h = 0, 5, and 10 mm, respectively. The results indicate that the position of the expansion wave has not apparent change. But with the increase of the thickness, the recirculation region enlarges and the position where the shock penetrates the mixing carry-forward. At the same time, the onset instability of the vortices increases because the recirculation region enlarged. It leads to bring forward the position of the vortices rolling up. Just as the image shows, when h = 0 mm the onset instability is weak, there are no vortices between X/H = 0.4–1.4. The scale of the vortices in the downriver is also small. Comparing the stream-line change in the vortices-field, it can be captured that with the increase of the thickness, the fluctuating of the stream-line enlarges. It provides more information about the vortices control the progress of the mixing.
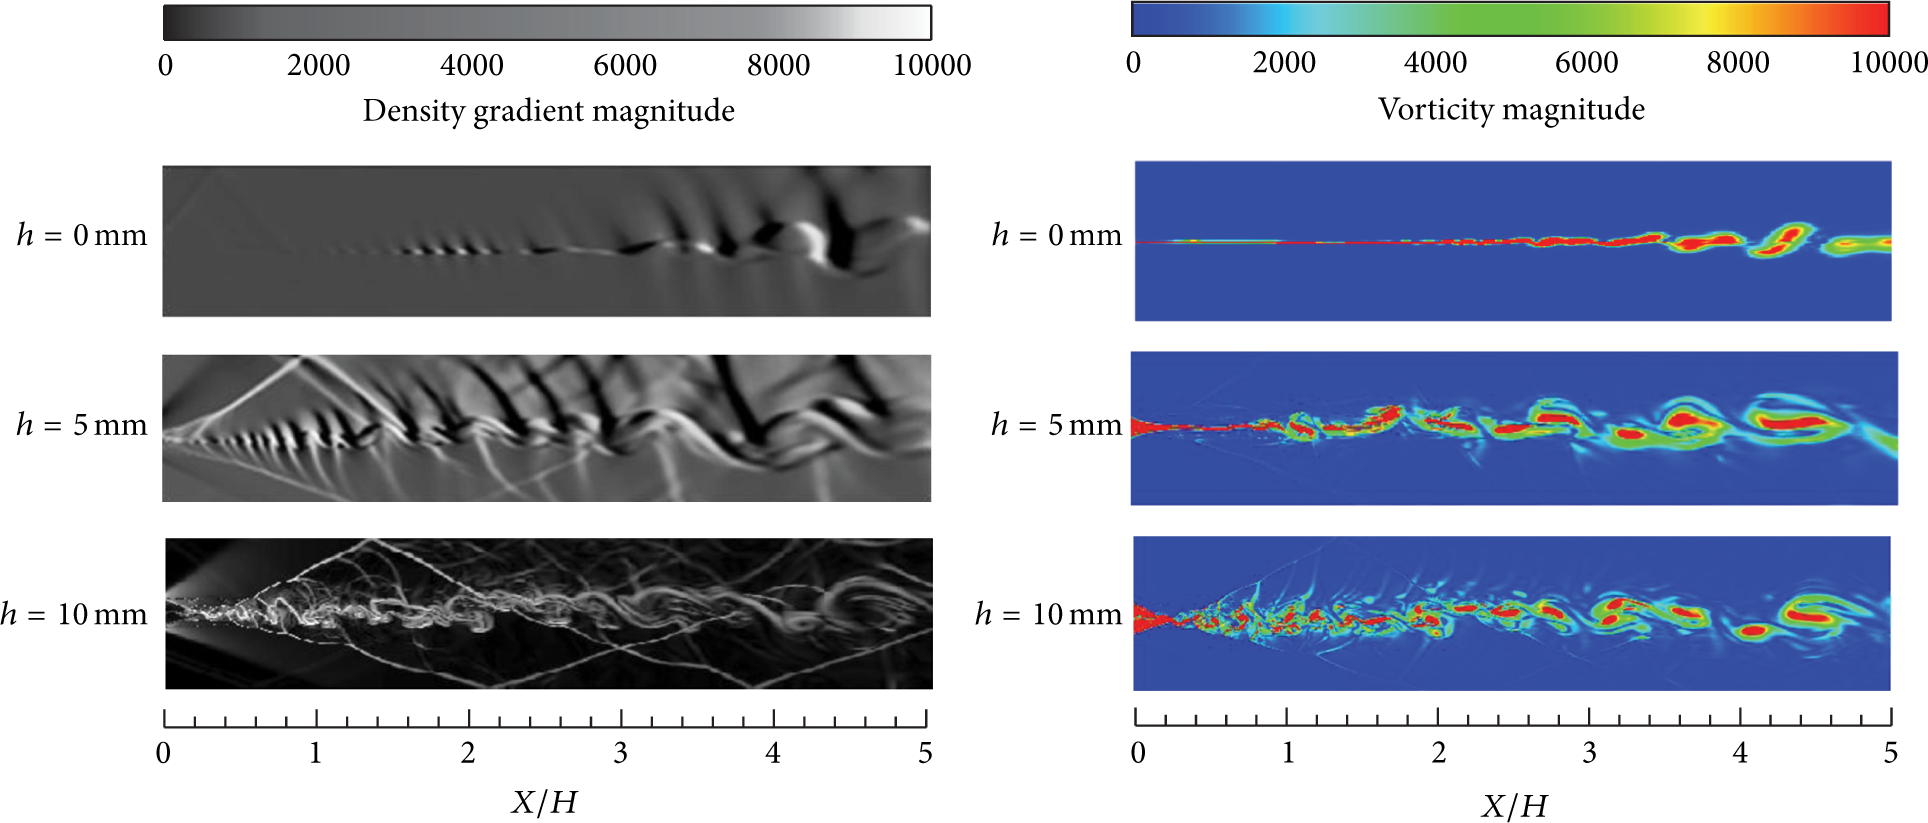
Density contour and vortices of different clapboard thicknesses.
The momentum thickness of different clapboard thicknesses change, shown as Figure 16, suggests that the thicker the clapboard is, the bigger momentum thickness is. The trend has linear relative change along the stream-wise when h = 0 mm. But the finite thickness has different trend. Both have a decrease at the beginning which relate to the instability of the recirculation region and the strength of the shedding vortices. If the instability of the shedding vortices is strong, the shear function is obvious and the straight result is the momentum thickness increase. With development of mixing, the function of the recirculation region can be neglected. The control effect is the large-scale vortices. As the areas of the recirculation region are different, the developments of vortices are different. That is why the decrease positions of the momentum thickness are different. Totally, the vortices appear intermittent and show some coherence with the experimental velocity field which can illustrate the periodicity in better way. Increasing the thickness of clapboard can enhance the mixing progress.

Momentum thickness of different clapboard thicknesses.
4.5. Discussion of the Temperature
It is difficult to control temperature in the nonreacting experiments while the temperature plays an important role in the mixing progress. It is necessary to analysis the effects of temperature on mixing. To compare with reacting experiments in the future, simulation was conducted on the condition of changing the temperature of the high speed side.
Figure 17 shows the velocity and density change of different temperatures. Comparing the results, the waves at the beginning of different temperatures are almost the same. But with increasing the high speed side temperature, the density gradient has great change. The structure of vortices develops rapidly and the waves have apparent differences. The vortices are stable when T = 300 K while they break clearly with temperature increasing. At the same time, rolling progress of the mass and energy brought by large-scale eddies affect the wave structure in the downriver. The waves were captured in focus when temperature is low. Disorder waves can be seen when temperature increases.

Velocity and density contours of different temperatures.
Just as Figure 18 shows, the momentum thickness decreases when the temperature increases. It can be explained from the defined formula of momentum thickness. The velocity changes corresponding with different densities when Mach number is the same but temperature is different. The margins between V a and V b increase which lead the denominator of the defined formula to increase. So the higher the temperature is, the smaller the momentum thickness is. Besides, the local speed changes and leads the compression changing. That is why the mixing possesses different character. But the progress is not in violation of the development of large-scale structures. The control effect of the mixing is different under different temperatures. The vortices brought by the shearing are small when the temperature is low. The process that mixing translates to the complete turbulence needs more time and before that the control effect of the mixing is the movement of momentum. That is to say, time is needed when the scale of large eddies comes to become bigger than dissipation scale. These are the reasons to explain the phenomena in the present study.

Momentum thickness of different temperatures.
5. Conclusions
NPLS experiments and LES were launched to get the fine structure of the supersonic planar mixing layer with finite thickness in the present study. It can make a contribution to the mixing enhancement research. Based on the results, the following can be concluded.
Comparing with the mixing layer with thin thickness, the beginning part of the supersonic mixing layer with finite thickness is turbulent. The progress of the mixing is supersonic turbulent mixing.
The structures of vortices possess characters of periodicity, quick movement, and slow changes. The development of vortices provides the instability for the progress of mixing.
Pressure nonmatching is where the onset instability for the generation of the large-scale vortices and the development of mixing layer is restrained when the pressure of lower speed side is higher.
Increasing the thickness of the clapboard can enhance the mixing and enlarge the scale of vortices. The function of the recirculation region can be also enlarged.
The development of vortices lies in temperature changing very much and affects the mixing progress by changing the control effects. Totally these changes relate to the compression in the flow-field.
Conflict of Interests
The authors declare that they have no financial and personal relationships with other people or organizations that can inappropriately influence their work. There are no other professional or personal interests of any nature or kind in any product, service, and/or company that could be construed as influencing the position presented in or the review of the paper.
Footnotes
Acknowledgments
This work has been supported by the National Nature Science Foundation of China (Grant nos. 11172324 and 91116001).