
Abstract
Carbon nanotube (CNT) mixed grinding wheel has been used in the electrolytic in-process dressing (ELID) grinding process to analyze the surface characteristics of AISI D2 Tool steel material. CNT grinding wheel is having an excellent thermal conductivity and good mechanical property which is used to improve the surface finish of the work piece. The multiobjective optimization of grey relational analysis coupled with principal component analysis has been used to optimize the process parameters of ELID grinding process. Based on the Taguchi design of experiments, an L9 orthogonal array table was chosen for the experiments. The confirmation experiment verifies the proposed that grey-based Taguchi method has the ability to find out the optimal process parameters with multiple quality characteristics of surface roughness and metal removal rate. Analysis of variance (ANOVA) has been used to verify and validate the model. Empirical model for the prediction of output parameters has been developed using regression analysis and the results were compared for with and without using CNT grinding wheel in ELID grinding process.
1. Introduction
Ultraprecision engineering and nanotechnology are considered nowadays as the technologies of the future. Their products find wide applications in various technological fields, replacing traditional manufacturing processes in industry [1]. Carbon nanotubes (CNT) is having a high surface area and good electrical conductivity and having high strength to low weight ratio used in aerospace industry. Young's modulus of CNT's is 1.2 TPa, having high current carrying capacity, excellent field emitter, and high aspect ratio. Using the excellent properties of CNT's which influenced the machining process to enhance the surface finish from microlevel to nanolevel [2]. Natarajan and Arunachalam [3] were presented the optimization of multiple performance characteristics in microelectrical discharge machining using Taguchi method and grey relational analysis. Based on ANOVA, pulse on time is found to be the most significant factor, which affects micro-EDM process. Siddiquee et al. [4] investigates optimization design of an in-feed centre less cylindrical grinding process performed on EN52 austenitic valve steel. In this study, since the process is with multiple-performance characteristics, therefore, the grey relational analysis that uses the grey relational grade as performance index is specially adopted to determine the optimal combination of centre less cylindrical grinding parameters. Moreover, the principal component analysis has applied to evaluate the weighting values corresponding to various performance characteristics so that their relative importance can be properly and objectively described. Prabhu and Vinayagam [5] proposed that the carbon nanotube has better mechanical and electrical properties specifically high electrical conductivity, using these properties the single wall CNT has mixed with cutting fluids. The water-soluble oil was used as cutting fluid in electrolytic in-process dressing (ELID) technique, the grinding process for analysis of surface characteristics like surface roughness, morphology, and microcrack of the work piece by AFM at the nanolevel.
Lim et al. [6] proposed that demands for high quality surface finish, dimensional accuracy and form accuracy has required for optical surfaces and it is very difficult to achieve these using conventional grinding methods. ELID grinding is one new and efficient method that uses a metal-bonded diamond grinding wheel in order to achieve a mirror surface finish especially on hard and brittle materials and explained the fundamental mechanism of ELID grinding and so it has been studied here by conducting experiments to establish optimal grinding parameters to obtain better surface finish under various in process dressing conditions. You and Gao [7] insist the use of nanostructures directly to fully utilize the mechanical and thermal properties for nanomachining. CNTs were directly used as cutting grains and a series of CNT grinding wheels were fabricated to demonstrate the effectiveness of the proposed new type of abrasive tool. The CNT wheels are made of 1% multiwall carbon nanotubes. Carbon nanotubes can be used as cutting grains for nanomachining. Pan et al. [8] demonstrate the effectiveness of optimizing multiple quality characteristics of Nd YAG laser welded titanium alloy plates via Taguchi method-based grey analysis. The modified algorithm adopted here was successfully used for both detraining the optimum settings of machine parameters and combining multiple quality characteristics into one integrated numerical value called grey relational grade or rank. The optimized machine parameter settings clearly improved the quality characteristics of welded plates compared to quality levels achieved for conventional machine parameter settings. Pontes et al. [9] presents a study on the applicability of radial base function neural networks for prediction of roughness average in the turning process of SAE 52100 hardened steel, with the use of Taguchi's orthogonal arrays as a tool to design parameters of the network. Prabhu and Vinayagam [10] present the L8 orthogonal array which was used to optimize the machining parameters in Taguchi design of experiment technique using Minitab 15 software. Empirical model for the prediction of output parameters has been developed using regression analysis and the results are compared empirically for with and without nanofluids in grinding process. The analysis of variance and F test were used to determine the significant parameter affecting the surface roughness.
Itoh and Ohmori [11] investigated the effect of ELID grinding on the flexural strength of silicon nitride specimens and the same author [12] proposed ELID lap grinding being a method of constant pressure grinding, which utilizes an electrically conductive wheel and the ELID method. Singh et al. [13] proposed that the optimization of process parameters is the key step in the Taguchi methods to achieve high quality without cost inflation. Optimization of multiple response characteristics is more complex compared to optimization of single performance characteristics. The multiresponse optimization of the process parameters, namely, MRR, tool wear rate, taper, radial overcut, and surface roughness on EDM of Al—10% SiC as cast metal matrix composites using orthogonal array with grey relational analysis is reported. Chakradhar and Gopal [14] investigate the effect and parametric optimization of process parameters for electrochemical machining of EN-31 steel using grey relation analysis. The process parameters are optimized with considerations of multiple performance characteristics including material removal rate, overcut, cylindricity error, and surface roughness. Analysis of variance is performed to get contribution of each parameter on the performance characteristics. Al-Refaie et al. [15] proposed an approach for optimizing multiple responses in the Taguchi method using regression models and grey relational analysis. In this approach, each response is transformed into signal-to-noise (S/N) ratio. The S/N ratios are then utilized to model each response with process factors and complete the responses for all factor level combinations. The grey relational analysis is then used to combine the quality response at each experiment into a single grey grade. Typically, the larger grey grade indicates better performance. Thus, the factor level with the largest level grade is selected as the optimal level for that factor. Lu et al. [16] investigate optimization design of the cutting parameters for rough cutting processes in high-speed end milling on SKD61 tool steel.
In this study, the process is intrinsically with multiple performance indexes so that grey relational analysis that uses the grey relational grade as performance index is specially adopted to determine the optimal combination of cutting parameters. Moreover, the principal component analysis is applied to evaluate the weighting values corresponding to various performance characteristics so that their relative importance can be properly and objectively described. The results of confirmation experiments reveal that grey relational analysis coupled with principal component analysis can effectively acquire the optimal combination of cutting parameters. This paper presents the carbon nanotube mixed grinding wheel which is used in ELID grinding process to analyse the surface characteristics like surface roughness and metal removal rate using grey relational analysis techniques coupled with principal component analysis.
1.1. Grey Relational Analysis
Grey relational analysis (GRA), a normalization evaluation technique, is extended to solve the complicated multiperformance characteristics optimization effectively. The optimization of the process was performed in the following steps.
Generate reference data series x0

where m is the number of respondents. In general, the x0 reference data series consists of m values representing the most favoured responses.
Generate comparison data series x i
where i = 1,…,k. k is the number of scale items. So there will be k comparison data series and each comparison data series contains m values.
Compute the difference data series Δi

Find the global maximum value Δmax and minimum value Δmin in the difference data series

Transform each data point in each difference data series to grey relational coefficient. Let γi(j) represent the grey relational coefficient of the jth data point in the ith difference data series; then,

where Δi(j) is the jth value in Δi difference data series and ε is a value between 0 and 1. The coefficient ε is used to compensate the effect of Δmax and it should be an extreme value in the data series. In general the value of ε can be set as 0.5.
Compute grey relational grade for each difference data series. Let Γ i represent the grey relational grade for the ith scale item and assume that data points in the series are of the same weights 1; then,

The magnitude of Γ i reflects the overall degree of standardized deviance of the ith original data series from the reference data series. In general, a scale item with a high value of Γ indicates that the respondents, as a whole, have a high degree of favored consensus on the particular item.
Sort Γ i values into either descending or ascending order to facilitate the managerial interpretation of the results.
1.2. Principal Component Analysis (PCA)
Pearson and Hotelling initially developed PCA to explain the structure of variance-covariance by the way of linear combinations of each quality characteristic. The procedure is described as follows (Chakradhar and Gopal [14]).
The original multiple quality characteristic array

where m is the number of experiment and n is the number of the quality characteristic. X is the grey relational coefficient of each quality characteristic, m = 9, n = 2.
Correlation coefficient array.
The correlation coefficient array is evaluated as follows:
where Cov(xi(j),xi(l))—the covariance of sequences xi(j) and xi(l), xi(j)—the standard deviation of sequence xi(j),xi(l)—the standard deviation of sequence xi(l).
Determining the eigenvalues and eigenvectors.
The eigenvalues and eigenvectors are determined from the correlation coefficient array,

where λ k is eigenvalues,

Principal components.
The uncorrelated principal component is formulated as
where Ym1 is called the first principal component, Ym2 is called the second principal component, and so on. The principal components are aligned in descending order with respect to variance, and therefore the first principal component Ym1 accounts for most variance in the data.
1.3. Multiwall Carbon Nanotubes (MWCNTs)
Multiwall carbon nanotubes (MWCNT) consist of multiple rolled layers (concentric tubes) of graphite. In graphite, each carbon atom is attached to three others in a plane and forms a hexagonal lattice. The bonds in the plane are stronger than in diamond. Carbon nanotubes are a new form of carbon with unique electrical and mechanical properties. The unique properties of multiwall nanotubes are proving to be a rich source of new physics and could also lead to new applications in materials and devices. The specifications of multiwall carbon nanotubes are given in Table 1. The sources of carbon nanotubes are received from Cheap tubes Inc., USA [http://www.cheaptubes.com].
Specification of MWCNTμs.

Figure 1 shows a transmission electron microscope (TEM) image of the MWCNTs. It can be seen that the nanotubes are entangled, which makes it difficult to disperse and stabilize as cutting fluids in ELID grinding process.
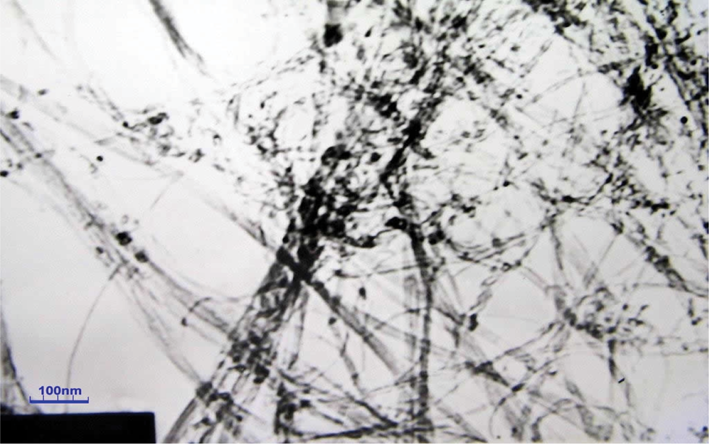
TEM image of our MWNTs 95 wt% <10 nm OD.
1.4. ELID Grinding Process
The primary purpose of the electrolytic in-process dressing (ELID) is the generation on the desired topography of the grinding wheel that is necessary for assuring the quality of the finished part. Excellent smooth surfaces can be achieved with the use of extremely fine abrasives. The ELID method is used as flat surface grinding process [11, 12]. The basic ELID system shown in Figure 2 consists of a power supply, a diamond bonded grinding wheel, and an electrode. The electrode used could be 1/4th of the perimeter of the grinding wheel. Normally copper is selected as the electrode material. The gap between the electrode and the grinding wheel is adjusted to 0.2 mm. Proper gaps and coolant flow rate should be regulated for efficient dressing process. Water soluble oil is mixed with carbon nanotube which is used as cutting fluid. Normally arc shaped electrodes are used in this type of ELID and grinding wheel used could be either straight or cup type. It is necessary for the trued wheel to be electrically pre dressed to protrude the grains on the wheel surface.
Schematic illustration of ELID setup.
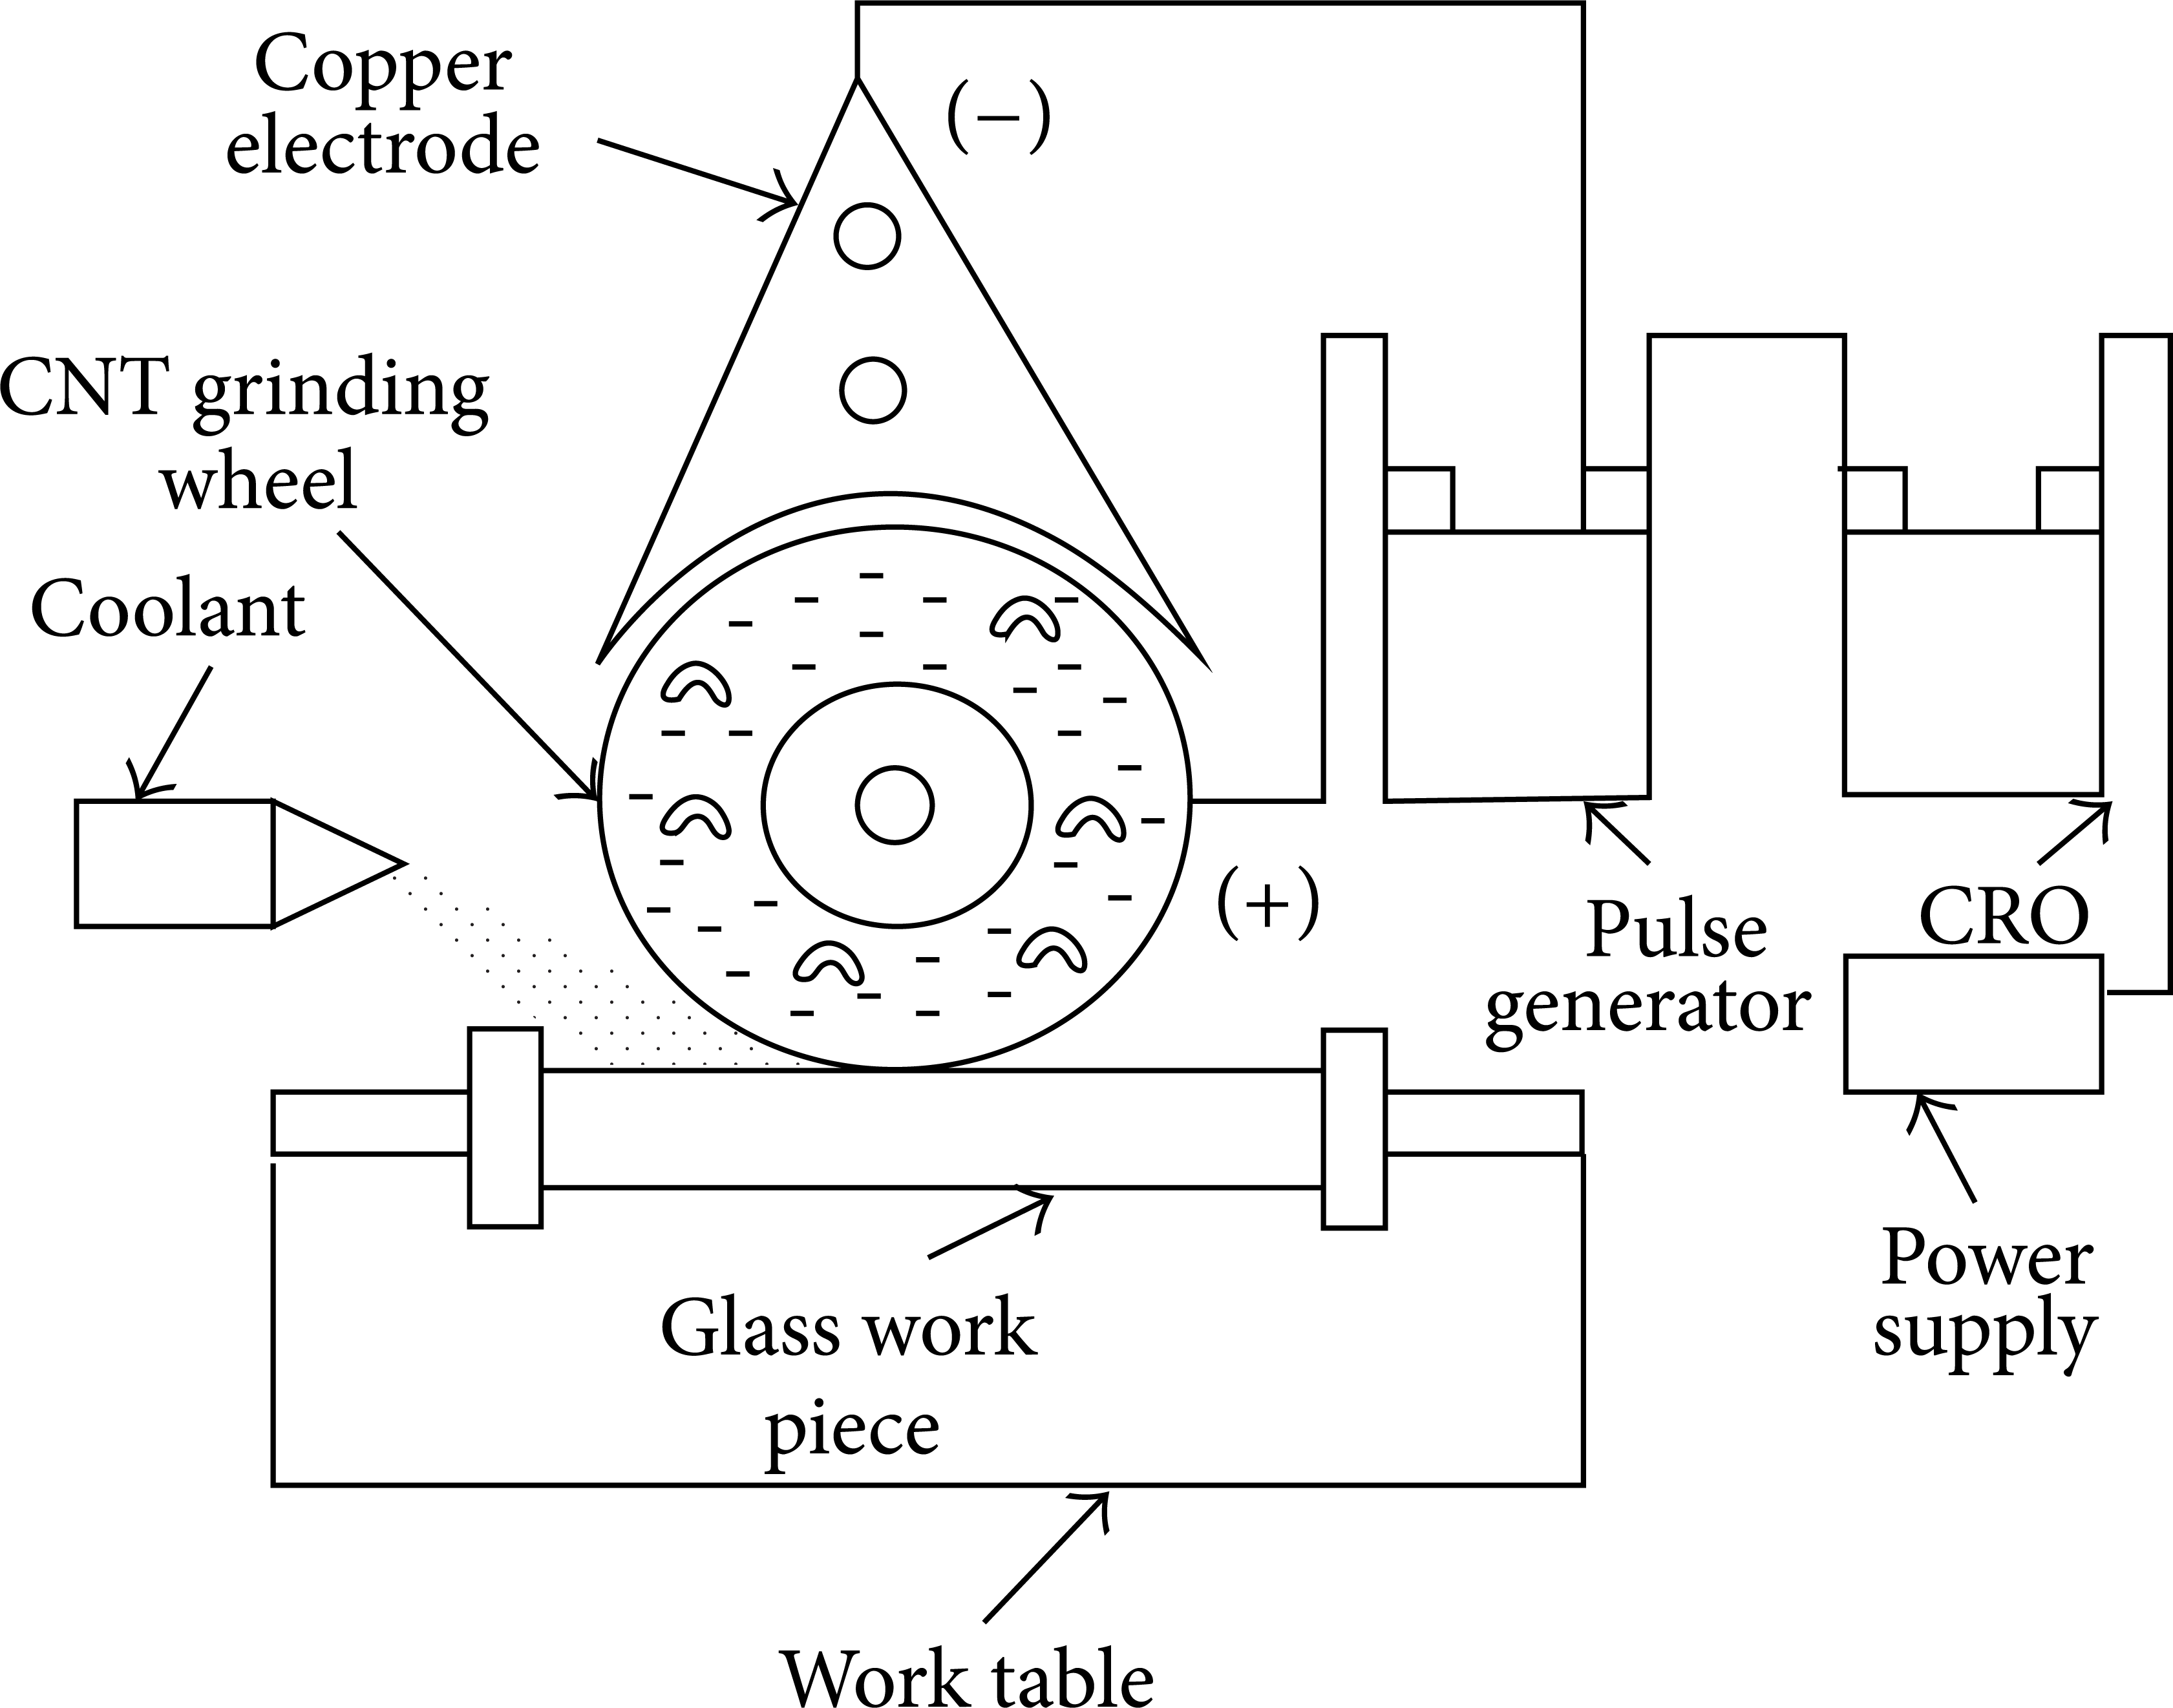
The ELID surface grinding process setup is shown in Figure 3. The negative terminal which is connected to electrode and positive terminal is connected to grinding wheel and pulse current is generated from pulse generator and maintained by CRO. The abrasive diamond grinding wheel, CNT bonded grinding wheel, is used as cutting tool and AISI D2 Tool steels are used as work piece materials.

Photographic view of experimental ELID process.
2. Proposed Methodology
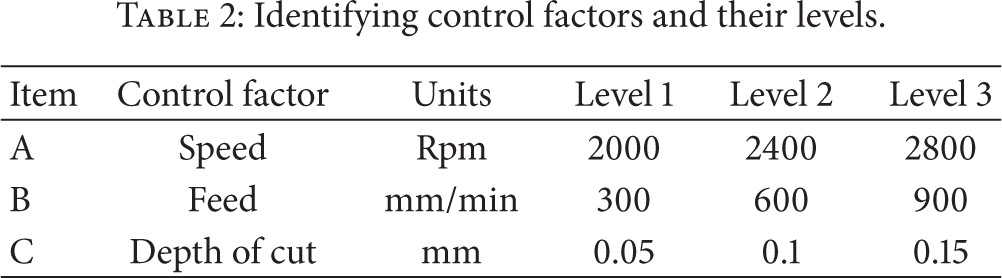
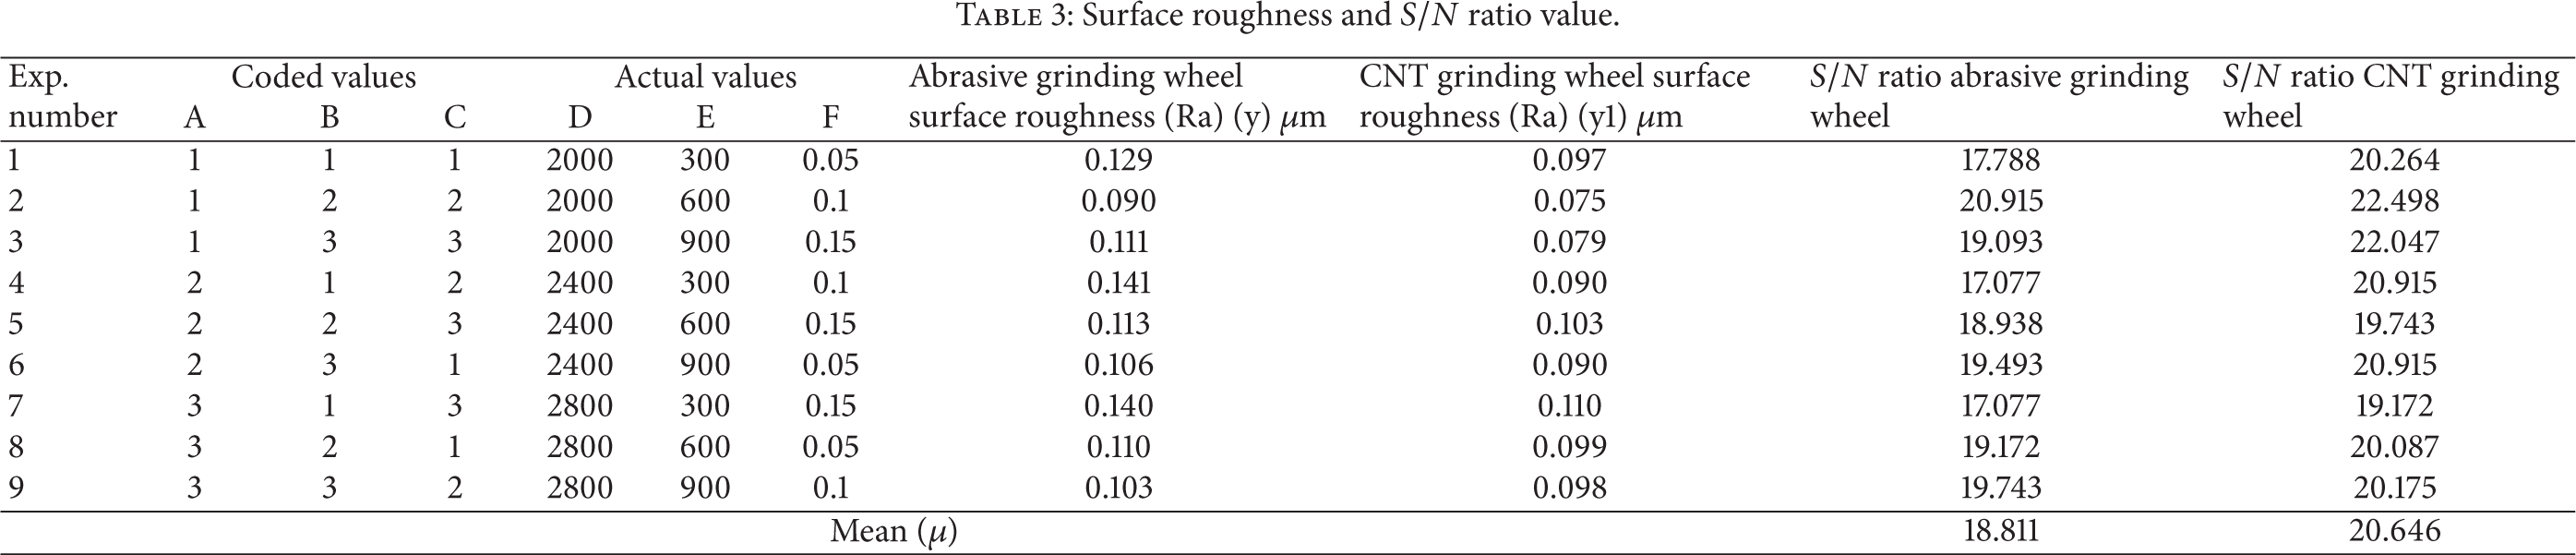
Grinding with super abrasive wheels is an excellent way to produce ultraprecision surface finish. However, superabrasive diamond grits need higher bonding strength while grinding, of which metal-bonded grinding wheels can offer. The specimen was made of the AISI D2 Tool steel, which is widely used in the mold and dyes industry. The raw materials were machined using lathe process. The specimens were made to a size of diameter 20 mm and thickness 10 mm. These specimens were heated to 1030°C at a heating rate of 200°C/min in muffle furnace. It was kept at that temperature for one hour and then quenched. After quenching, the specimens were tempered at 520°C for two hours and then air cooled. The hardness of the specimen was increased from 64 to 80 HRC. The uniform mixture of carbon nanotube with aluminium oxide abrasive is obtained by stir casting techniques. The machining was carried out at 2000 rpm and 1500 rpm speed using ELID technique. The experiments were carried out by using L9 orthogonal array as shown in Table 2. The regression analyses are used to predict the error between actual measurements with regression model values. The experimental values along with design matrix are shown in Table 3. To determine the effect of the nanogrinding wheel on grinding process on the surface roughness of the AISI D2 Tool steel, the surface profiles of the grinding specimens were measured by surface roughness tester (Hommel Tester TR500).
Identifying control factors and their levels.
Surface roughness and S/N ratio value.
3. Results and Discussions
3.1. CNT Grinding Wheel
The abrasive grain particles were mixed with multiwall carbon nanotube and made the CNT grinding wheel as shown in Figure 4 (Kent Abra tools, Chennai, India). The maximum operating speed of the grinding wheel is 3640 rpm. The size of the grinding wheel is used as 180 × 13 × 31.75 mm (diameter × width × thickness). The composition of CNT grinding wheel is WA 60 K 5 VK 35. The letter A denotes that the type of abrasive is aluminum oxide. The number 60 specifies the average grit size in inch mesh. The letter K denotes the hardness of the wheel, which means the amount of force required to pull out a single bonded abrasive grit by bond fracture. The number 5 denotes the structure or porosity of the wheel. The letter code V means that the bond material used is vitrified. The number 35 is a wheel manufacturer's identifier.

Abrasive grinding wheel without CNT (a) and abrasive grinding wheel with CNT (b).
The hardness test was performed for without and with CNT grinding wheel using RAB250 hardness tester model. The 100 kg load applied through 1/16 inch diameter of ball indenter is used to obtained the hardness of the grinding wheel.
Testing is noted from Table 4, that the surface hardness of material has increased with the increase in amount of carbon nanotube in the composite grinding wheel as the carbon nanotube absorbs the impact thus increasing the machinability which was observed from the analysis of surface roughness by Taguchi method. To determine the effect of the carbon nanotube on the surface roughness of the AISI D2 Tool steel, the surface profiles of the grinding machining work piece were measured by surface roughness tester (Hommel Tester T500). To determine the effect of the carbon nanotube on the MRR of the AISI D2 Tool steel materials by measuring the weights before and after machining and dividing the answer with time taken for machining,
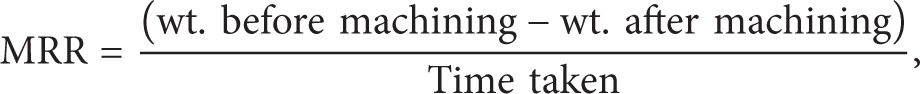
a weighing instrument was used which was available at nanotechnology research lab, SRM University, Chennai and which showed accuracy up to three decimal places as shown in Table 5.
Hardness test for with and without CNT grinding wheel.

Experimental results.

3.2. Grey Relation Coefficient of Each Performance
For lower-the-better quality characteristics of surface roughness data preprocessing is calculated by using this formula:

Δi can be calculated by using (3) as shown in Table 6.
Grey relational coefficient.

3.2.1. Grey Relational Grade (GRG)
In the grey relational analysis, the grey relational grade is used to show the relationship among the series. Let (X,Γ) be a grey relational space, let X stand for the collection of the collection of grey relational factors and let it be the compared series and the reference series. The higher value of the grey relational grade represents the stronger relational degree the reference sequence (k).
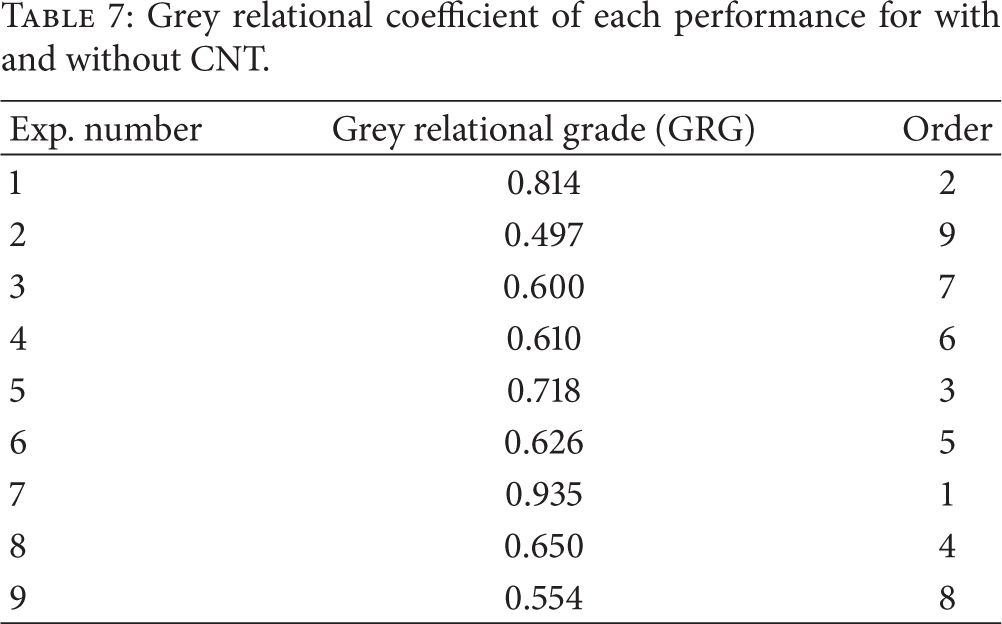
Higher the GRG as shown in Table 7 represents the corresponding experimental result is closer to ideally normalized value. Experiment 7 has the best multiple performance characteristics among nine experiments because it has highest GRG of 0.935. In present study, optimization of complicated multiperformance characteristics of grinding process using AISI D2 Tool steel has been converted into optimization of GRG.
Grey relational coefficient of each performance for with and without CNT.
3.2.2. Factor Effect
Since the experimental design is orthogonal, it is then possible to separate the effects of each process parameter at different levels. The mean of grey relational grade for the cutting speed, feed and depth of cut at levels 1, 2, and 3 can be calculated by taking the average of the grey relational grade for the experiments 1–3, 4–6, and 7–9, respectively. The mean of the grey relational grade for each level of other machining parameters can be computed in the similar manner. The mean of the relational grade for each level of the combining parameters is summarized in the multiresponse performance is shown in Table 8.
Grey relational grade for multiresponse.

The principal component analysis, used to determine the corresponding weighting values of each performance characteristics while applying grey relational analysis to a problem with multiple performance characteristics, is proven to be capable of objectively reflecting the relative importance for each performance characteristic. The proposed algorithm greatly simplifies the optimization design of cutting parameters with multiple performance characteristics. Thus, the solutions from this method can be a useful reference for tool manufacturers and operators who are willing to search for an optimal solution of cutting conditions.
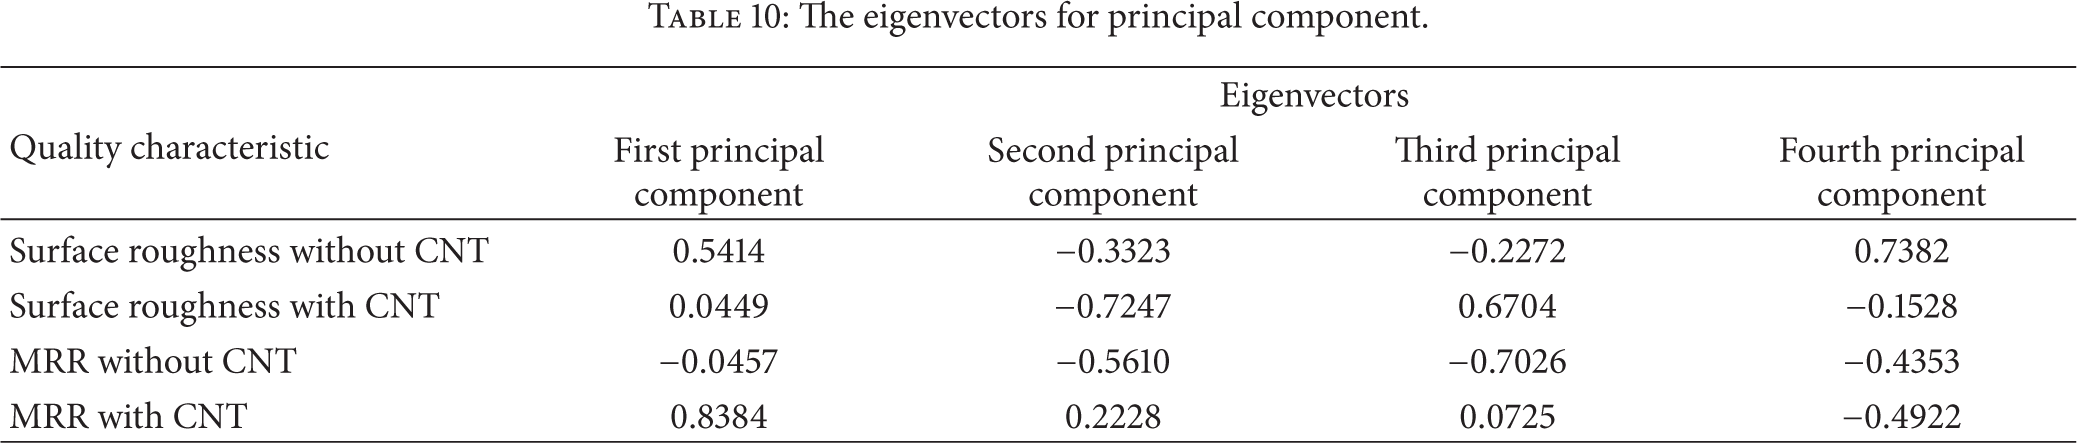
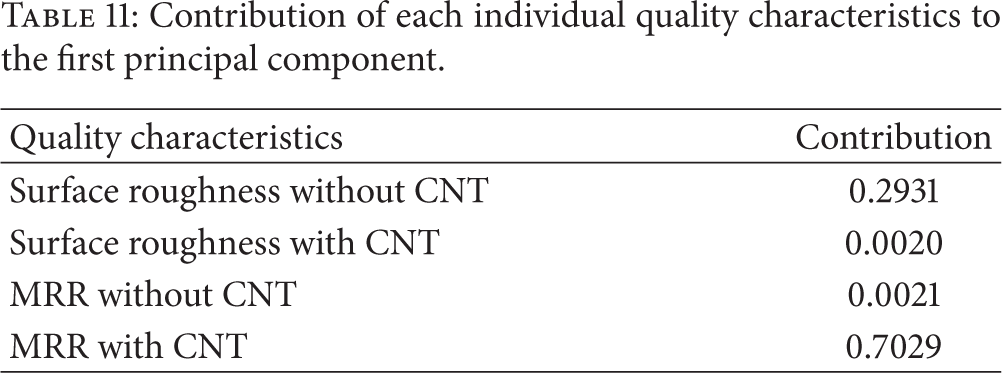
The elements of the array for multiple performance characteristics listed in Table 7 represent the grey relational coefficient of each performance characteristic. These data are used to evaluate the correlation coefficient matrix and determine the corresponding eigenvalues from (8), as shown in Table 9. The eigenvector corresponding to each eigenvalue is listed in Table 10, and its square can represent the contribution of the corresponding performance characteristic to the principal component. Table 11 shows that the contributions of surface roughness and MRR for with and without CNT grinding as 0.2931, 0.0020, 0.0021, and 0.7029. Moreover, the variance contribution for the first principal component characterizing the whole original variables that is, the three performance characteristics, is as high as 89.45%. Hence, for this study, the squares of its corresponding eigenvectors are selected as the weighting values of the related performance characteristic, and the coefficients
The eigenvalues and explained variation for principal component.

The eigenvectors for principal component.
Contribution of each individual quality characteristics to the first principal component.
This shows that almost 90% of the variance is accounted for by the first three principal components.
Figure 5 shows that the only clear break in the amount of variance accounted for by each component is between the first and second components. However, that component by itself explains less than 42% of the variance, so more components are probably needed. It can see that the first three principal components explain roughly two-thirds of the total variability in the standardized ratings, so that it might be a reasonable way to reduce the dimensions in order to visualize the data.

Principal component parameter variations.
3.3. ANOVA Analysis
The purpose of analysis of variance is to find the significant factors affecting the machining process to improve the surface characteristics of AISI D2 tool steel material in grinding process. ANOVA gives clearly how the process parameters affect the response and the level of significance of the factor considered. The ANOVA table for grey relational grade of different process parameters is calculated. In the ANOVA Table 12, the effects of grey relational analysis with control parameters are statistically significant at 95% confidence level. Value of R2 is 0.9341, which signifies that the model can reasonably explain 93.14% of the variability in grey relational grade. The adjusted R squared (R2 adj) for the model is 0.7254, which is very close to the value of ordinary R squared (R2), that is, 0.9341. Thus, it can be stated that no nonsignificant terms are included during empirical model building for grey relational analysis. Degree of contribution developed by using ANOVA reveals that cutting speed, feed, and depth of cut have 6.62%, 44.28%, and 42.30% contribution, respectively, in grey relational grade. Larger FAo value 6.44 indicates that the variation of the process parameter makes a big change on the grey relational grade.
ANOVA analysis for grey relational grade with different process parameters.

S = 0.0711274 R-Sq = 93.14% R-Sq(adj) = 72.54%.
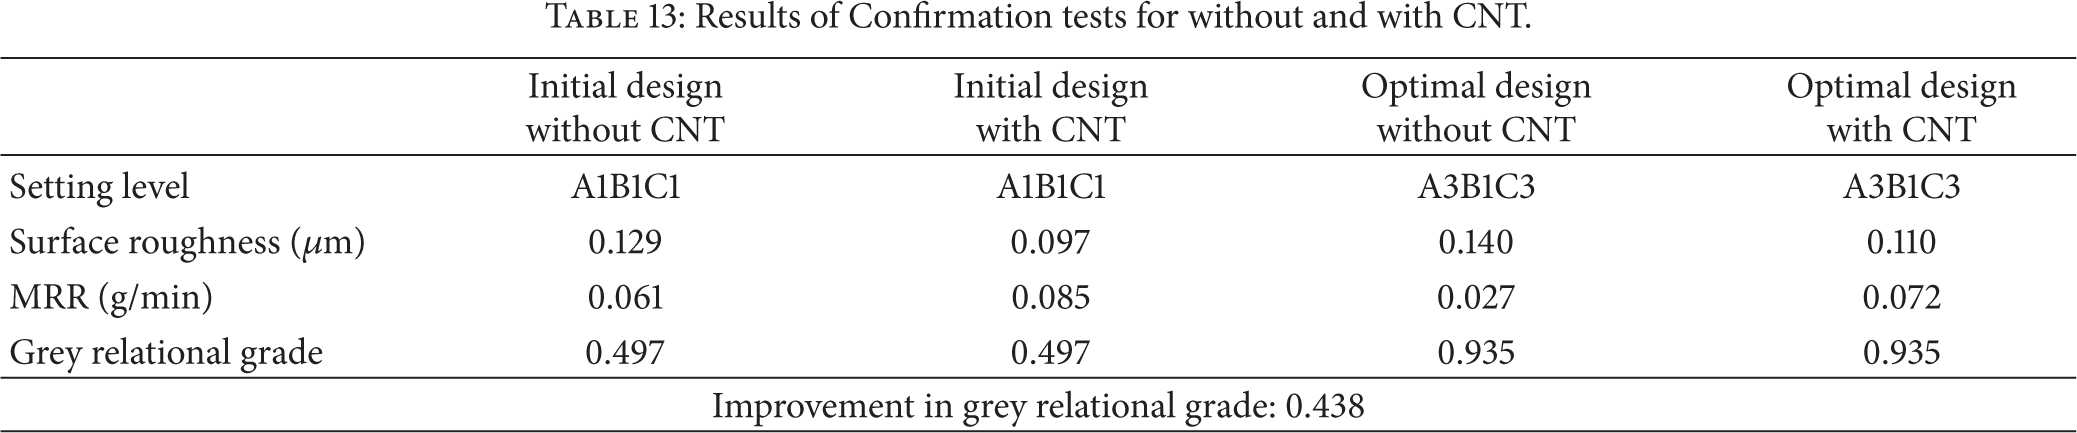
Mean of grey relational grade (GRG) for each parameter has been shown in Figure 6 by horizontal line. Basically, the larger the GRG is, the closer the product quality will be to ideal value. Thus, a larger GRG is desired for optimum performance. Therefore, optimal parameter setting as shown in Table 13 for better surface roughness and MRR is A3B1C3. Optimal level of process parameters is the level with the highest GRG (0.935).
Results of Confirmation tests for without and with CNT.

Factor effect diagram of grinding process for multiperformance characteristics.
As observed in Table 13, surface roughness decreased from 0.129 to 0.097 μm for without and with CNT based machining and for grey relational grade based optimal design conditions the surface roughness is decreased from 0.140 to 0.110 μm and MRR increases from 0.061 to 0.085 mm3/s for without and with CNT based machining. The MRR has been increased to 28.2% because of good mechanical and thermal properties of CNT influenced in to the machining process. Similarly for grey relational grade based optimum design the MRR increased from 0.027 to 0.072 mm3/s. Based on the previous results, it is clearly observed that quality characteristics can be greatly improved through this study.
3.4. Experimental Validation
The estimated grey relational grade α using the optimal level of the machining parameters can be calculated as

where α m is the total mean of the grey relational grade, α i is the mean of the grey relational grade at the optimal level, and n is the number of the machining parameters that significantly affects the multiple response characteristics. Based on (14), the estimated grey relational grade using the optimal machining parameters can be found out even for the setting not available in the OA. The confirmation experiment is the final step in the first iteration of the design of experiment process. The purpose of the confirmation experiment is to validate the conclusions drawn during the analysis phase. The confirmation experiments were conducted by setting the process parameters at optimum level. Cutting speed 2800 rpm, feed 300 mm/min, and depth of cut 0.15 mm were optimum parameters and the optimal surface roughness has 0.140 μm compared to with CNT as 0.110 μm.
3.5. Mathematical Modeling
Surface roughness and metal removal rate (MRR) for grinding process with CNT as cutting grains can be expressed as mathematical model is

where Ra is the predicted surface roughness (μm), V is the cutting speed (rpm), f is the feed (mm/min), and d is the depth of cut (mm), and C,p,q, and r are model parameters to be estimated using the experimental results. To determine the constant and exponents, this mathematical model can be linearized by employing a logarithmic transformation, and (15) can be expressed as

The linearised model of (16) is

where y is the true response of surface roughness and metal removal rate on a logarithmic scale x0 = 1 (dummy variable), x1,x2, and x3 are logarithmic transformation of speed, feed, and depth of cut, respectively. While β0,β1,β2, and β3 are the parameters to be estimated. Equation (17) can be expressed as

where
The second order model can be extended from the first order model equations as

where
The developed empirical model based on without and with CNT based grinding process for surface roughness and MRR is as follows:
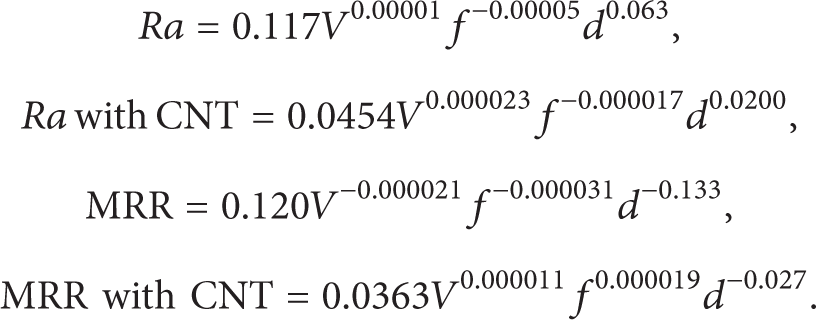
The maximum test errors for surface roughness as shown in Table 14 using regression model are 25.88% for without carbon nanotubes and 10.93% for with carbon nanotubes. This method is suitable for estimating surface roughness in acceptable error ranges. The model generation of regression model took just a couple of seconds. From the results, errors of measurements which occur in surface roughness with carbon nanotube are less than without using carbon nanotubes as cutting grains.
Comparison of regression model with experimental measurements for surface roughness.

The maximum test errors for MRR as shown in Table 15 using regression model are 32.07% for without carbon nanotubes and 20.77% for with carbon nanotubes. From the results, an error of measurements which occurs in MRR with carbon nanotube is less than without using carbon nanotubes as grains in grinding wheel. The minimum errors occur for MRR without CNT is 1.721% and with CNT is 1.013%.
Comparison of regression model with experiment measurements for MRR.

Figures 7 and 8 have represented the error of actual surface roughness and MRR with predicted regression analysis through empirical model for with and without using multiwall carbon nanotube based ELID grinding process. The high R2 value indicates that better model fit the data very well using CNT based machining.

Error showing experimental versus regression model for surface roughness without and with carbon nanotubes grinding.

Error showing experimental versus regression model for MRR without and with Carbon nanotubes grinding.
4. Conclusion
The grey relational analysis based on Taguchi design of experiment techniques was a way of optimizing the grinding machining coupled with principal component analysis for AISI D2 Tool steel with CNT as cutting grains. The analytical results are summarized as follows.
From the response table of the average grey relational grade, it is found that the largest value of the grey relational grade for the cutting speed 2800 rpm, feed 300 mm/min, and depth of cut 0.15 mm. It is the recommended levels of the controllable parameters of the grinding machining as the minimization of the surface roughness and maximization of MRR were simultaneously considered.
The optimal combination of the ELID grinding parameters obtained from the proposed method is the set with A3, B1, and C3. The confirmation experiments were conducted by setting the process parameters at optimum level. Cutting speed 2800 rpm, feed 300 mm/min, and depth of cut 0.15 mm as optimum parameters and the optimal surface roughness obtained without CNT is 0.140 μm compared to with CNT as cutting grains were 0.110 μm. The order of the importance for the controllable factors to the roughness and MRR, in sequence, is the feed, depth of cut, and cutting speed.
In the regression analysis the maximum test errors for surface roughness without using CNT is 25.88% and for with using CNT is 10.93%. Similarly for MRR 32.07% for without using CNT and with using CNT is 20.77%. From the results, an error of measurements occurs in surface roughness and MRR with carbon nanotube are less than without carbon nanotubes. This method is suitable for estimating surface roughness in acceptable error ranges.
ANOVA reveals that cutting speed, feed, and depth of cut has 6.62%, 44.28% and 42.30% contribution, respectively, in grey relational grade. Larger FAo value 6.44 indicates that the variation of the process parameter makes a big change on the grey relational grade.
Conflict of Interests
The authors declare that there is no conflict of interests regarding the publication of this paper.