
Abstract
The hydraulic performances as well as the cavitation phenomena in a scaled residual heat removal pump were investigated by experimental and numerical methods, respectively. In particular, a 3D numerical model of cavitation was adopted to simulate the internal cavitating flow through the model pump. The hydraulic performances of the model pump predicted by numerical simulations were in good agreement with the corresponding experimental data. The main generation and evolution of attached cavitation throughout the blade channels at different cavitating conditions have been investigated using the vapor fraction ISO surface and in-plane velocity vectors. Results show that the low static pressure at the impeller inlet is the main reason for leading edge cavitation by correlation analysis of static pressure on the midspan of impeller. Cavitation proved to occur over a wide range of flow rates, producing a characteristic creeping shape of the head-drop curve and developing in the form of nonaxisymmetric cavities at design flow rate. Moreover, the occurrence of these cavities, attached to the suction surface of blades, was found to depend on the NPSHA value. Numerical and experimental results in this paper can provide better understanding of the origin of leading edge cavitation in residual heat removal pumps.
1. Introduction
Cavitation is a complex flow phenomenon which generally occurs if the pressure in certain locations drops below the vapor pressure and consequently the negative pressure is relieved by means of forming gas filled or gas and vapor filled cavities [1]. Cavitation is frequently encountered in a large number of hydraulic machineries, like, for instance, turbopumps in rocket propulsion systems, hydrofoils and marine propellers in naval applications, and industrial turbomachinery in hydropower engineering. Because of its unsteady and erosive characteristics, the evolution of cavitation may be the origin of several negative effects, such as blockage of the main flow of the passages [2–4], noise generation [5], pressure fluctuation [6], onset of stall [7], and hydraulic performance deterioration [8, 9]. In particular, when a centrifugal pump operates at off-design flow coefficients, near or below 50% of design conditions, for instance, the flow approaches the impeller blades at relatively large incidence angles. As a consequence of the intense interaction thereby developing between the flow and the impeller blades, a recirculation region, characterized by significant axial and azimuthal components of the flow vorticity, forms in the low pressure region near the impeller eye. At sufficiently low cavitation numbers, the centrifugal pressure gradients within these vortical regions enable cavitation to grow rapidly in the resulting backflow and develop over considerable distances upstream of the impeller eye. At the same time, cavitation also develops on the suction sides of the impeller blades, where the pressure drops to sufficiently low values [10].
In the past decades, much research, including simulations and experiments, has been conducted to understand the mechanisms of cavitation for water pumps. By using the cavitation model proposed by Kunz et al. [11], Medvitz et al. [12] calculated the cavitating flow in a centrifugal pump at small cavitation numbers. They analyzed the reason why the pump head drops at small cavitation numbers for the off-designed condition, but the assumption of the potential flow in their calculations limits their methods from being used in more applications. Pouffary et al. [13] used the cavitation model based on the barotropic state law to accomplish the cavitation simulation for a centrifugal pump. Their results showed that when the sheet cavitation develops at the narrowest position between two blades, the pump's hydraulic characteristics decrease suddenly. Ding et al. [14] adopted the full cavitation model to simulate the cavitating flow in a centrifugal pump. The critical values by their calculation matched well with experiments. Cheah et al. [15] simulated the complex internal flow in a centrifugal pump impeller with six twisted blades by using 3D Navier-Stokes code with a standard k-∊ two-equation turbulence model. Different flow rates were specified at the inlet boundary to predict the characteristics of the pump such as impeller passage flow separation and pressure distribution.
The investigation results discussed above show that cavitation occurring in the hydraulic machinery is three-dimensional and two-phase vortex flow. However, most numerical results of cavitation flow were obtained from normal numerical method. The numerical and experimental investigations of 3D turbulent cavitation flow and evolution of hydraulic machinery at the different cavitation numbers are still a challenge to the researchers.
In this study, the cavitating turbulent flow in a scaled mock-up of a residual heat removal pump was investigated by numerical simulation and hydraulic performance experiments. The objective is to gain improved better understanding of cavitation development, cavity shedding, and collapse based on the correlation analysis of low pressure and vapor fraction. The calculations involve a mass transfer cavitation model with the RANS method for the turbulent modeling to secure better accuracy. Numerical results were also compared with the experimental data. The systematic and detailed analysis of the three-dimensional leading edge cavitation has been made in the investigated scaled model pump.
2. Governing Equations and Cavitation Model
2.1. Governing Equations of the Mixture Model
The mixture model for vapor/liquid two-phase flows assumes that the fluid is homogeneous [16], so the various fluid components are assumed to share the same velocity and pressure. The multiphase flow can be described with the conventional RANS method to the eddy viscosity models and by assuming both liquid and vapor phase incompressible and denoting the density of mixture fluid by ρ m , the governing equations for the turbulent mixture flow can be described by the following set of equations [17].
Continuity equation for the mixture phase:

Momentum conservation equation:

where u i and f i are the velocity and body force in the i direction, p is the mixture pressure, μ is the laminar viscosity, and μ t is the turbulent viscosity. The density of mixture ρ m is defined by the volume fractions as

where ρ l and ρ v are the densities of the liquid and the vapor, respectively; α l and α v are the volume fractions of the liquid and the vapor.
2.2. Cavitation Model
The cavitation model is based on the assumption that the water and vapor mixture in the cavitating flow can be modeled as a homogeneous fluid. The cavitation processes are governed by the transport equation for the conservation of the vapor (or liquid) volume fraction or the vapor (or liquid) mass fraction with the mass transfer between the liquid and vapor. The source term for the specific interphase mass transfer rate can be modeled by various cavitation models. Under these assumptions, a single set of equations in conservative form is obtained for the mass, momentum, and turbulence of the two-phase mixture. For a single bubble in an unbounded incompressible liquid, the Rayleigh-Plesset equation, derived from a momentum balance in the absence of thermal effects, reads

where R B , ρ, p, and S are the bubble radius, density, static pressure, and surface tension coefficient between the liquid and vapor, while the subscript l denotes the liquid phase. psat is the saturation pressure for the vapor. Neglecting second order terms and the surface tension, this equation reduces to [18]

The corresponding rates of bubble volume and mass change are
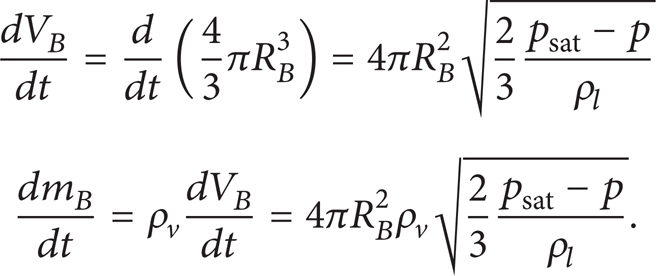
If there are N B bubbles per unit volume, the volume fraction r v , where the subscript v denotes the vapor phase, may be expressed as

Assuming spherical bubbles, the mass fraction of the noncondensable vapor provides an estimate of the number of nucleation sites available. The total interphase mass transfer rate per unit volume is therefore

This expression has been derived in the assumption of bubble growth. It can be generalized to include the case of bubble collapse as follows:
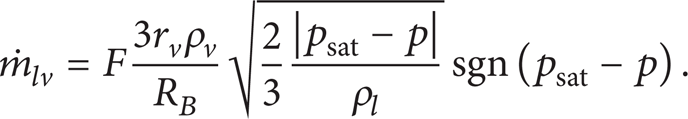
F is an empirical constant that may assume different values in the case of vaporization and condensation.
Moreover, the model involves four parameters and default values are used here [19]. They are the bubble radius R B = 10− 6 m, the nucleation site volume fraction rnuc = 5 × 10⁻⁴, and the evaporation and condensation coefficients Fvap = 50 and Fcond = 0.01.
3. Numerical Method for Cavitation Flow
3.1. Geometry Data
Figure 1 shows the 3D geometry of the scaled residual heat removal pump model with impeller diameter D1 = 358 mm, flow rate at design flow rate Qdeg = 312 m3/h, head H = 37.7 m, rotating speed n = 1490 r/min, and NPSH3 = 2.25 m. The impeller blade number Z = 5, and the guide vane number Z d = 7. The detailed parameters of the model pump are shown in Table 1.
Geometry data of the model pump.


Pump geometry.
Steady cavitation flow simulations including the flow in suction pipe, impeller, guide vane diffuser, and annular volute were conducted using the structure mesh technique. The distance between pipe inlet and the impeller inlet and the length of discharge pipe must be treated carefully to keep the inlet and outlet flow stable under cavitation conditions. If the distance is too short, convergence is very difficult because of recirculation flows at the inlet and outlet boundaries. The suction pipe length of 3 × D2 and discharge pipe length of 3 × D2 were finally selected. The whole computational domain shown in Figure 1 was divided into 4 parts. The suction pipe section of 3 × D2 in length upstream of the impeller was set as a stationary zone, and the impeller part was set as a rotating zone. The guide vane diffuser section and annular volute were also set as a stationary zone, respectively.
3.2. Mesh Generation and Mesh Independence Check
In order to effectively control the mesh distribution in the residual heat removal pump model, the whole hexahedral meshing strategy is adopted. The grid is generated for each hydraulic component by the software ANSYS ICEM CFD 14.5. The grid number and distribution are guaranteed consistently at the interface transition. The O-type grid technology and local refinement method are adopted to control the near-wall mesh, which meets the requirements of corresponding turbulence model in the near-wall treatment. In order to obtain mesh independence simulation results, similar grid topology and distribution are maintained for each hydraulic component of the pump model.
A grid dependency study at the design point under noncavitation was carried out to reduce the influence of grid number on the computational results as shown in Figure 2. When the grid number exceeds 3.66 million, there is almost no difference among the head coefficients ψ. Consequently, the influence of grids number on simulating results can be ignored. Finally, all the simulating results presented hereafter were obtained with 3660408 cells' mesh. The average y+ in each computational domain is 52.12 for the suction pipe, 150.01 for the impeller, 189.54 for the guide vane diffuser, and 101.35 for the volute, respectively. Detailed mesh information of each component is shown in Table 2. Mesh distribution of impeller and the midplane of the model pump are shown in Figure 3.
General mesh information of each computational domain.


Variation curve of head coefficient ψ with changes of grid number.

Mesh view of impeller and the whole computational region.
3.3. Computational Boundary Conditions
Under cavitation and noncavitation conditions, the settings of boundary conditions are nearly specified the same as each other. Generally, total pressure is specified as an inlet type boundary condition; constant mass flow rate is imposed on the outlet surface of the calculation domain. Water at 25°C has been selected as the working fluid, with the corresponding saturation vapor pressure of 3169 Pa in software ANSYS CFX. The mean nucleation site diameter was specified to be 2 × 10⁻⁶ m. As to wall boundary condition, no slip condition is enforced on the wall surface. For the cavitating cases, the volume fraction of vapor and water is assumed to be 0 and 1, respectively. Since the cavitating flow in the model pump was numerically simulated based on steady-state methods, the Frozen Rotor mode was chosen for the interface between the rotor and stator, such as suction pipe-impeller, impeller-guide vane diffuser, and guide vane diffuser-volute. The high resolution scheme was used for the discretization of the convective and diffusion terms in this investigation.
Whole flow simulations were carried out on a Dell Workstation with one processor (Precision T3600, Windows 7 system, Intel Xeon CPU E5-1650 at 3.20 GHz).
4. Experimental Validation
4.1. Test Facility and Model Pump
The numerical results were validated by means of measurements of pump performance characteristics. The experiments were carried out in an opened test loop facility at the National Fluid Machinery Laboratory, Jiangsu University, shown in Figure 4. The residual heat removal pump model with annular volute was horizontally installed in the pump model section of the test system. The test loop consists of a water seal throttle, two pressure transducers, a turbine flow meter, and a flow control valve. The motor shown in Figure 4 is controlled by a frequency inverter to adjust the speed of pump, especially during the starting and stopping process. The pipe diameter of the loop to the pump inlet and outlet is Φ 250 mm and Φ 200 mm, respectively. Pressure transducers are installed in the inlet and outlet pipes of pump to calculate pressure head. Flow rate is measured by a turbine flow meter. All the measurement signals at different operating conditions are encoded to the computer using a data acquisition system.

Schematic of the residual heat removal pump.
The cross section of the residual heat removal pump is shown in Figure 5. It consists of the impeller, the guide vane diffuser, the shaft, the bearing box, and the supporting ribs. The shaft of the pump was connected to the motor by flexible coupling.

View of the residual heat removal pump.
4.2. Hydraulic Performance
Hydraulic performances of the model pump were experimentally investigated in order to further confirm the computational results. Figure 6 presents the curves of the overall performances of the model pump obtained in both experimental methods and CFD. It can be seen in Figure 6 that there is a good agreement between the experimental and the CFD results. The experimental data of the head and efficiency are 37.95 m and 72.92% at design flow rate, respectively, the predicted head is 38.75 m, and the predicted efficiency is 73.04%. The maximum deviation of head between prediction and experiment is only below 5%. In the pump performance test, the pump efficiency was calculated by the following equation:

where η m , η h , and η v are the mechanical efficiency, hydraulic efficiency, and volumetric efficiency, respectively. The mechanical efficiency and volumetric efficiency were calculated by the following equations [20]:


Hydraulic performance of model pump.
4.3. Cavitation Performance
Available net pressure suction head (NPSHA) is usually used to describe the problems of cavitation in pumps and some other hydraulic machineries, which could be expressed as

where pin and vin are the static pressure and velocity in the fluid at the inlet of impeller, respectively.
Figure 7 demonstrates the comparison of cavitation performance for the residual heat removal pump between numerical simulation and experimental data at the design flow rate. The comparison shows that the present numerical simulation results are in good agreement with the experimental data, especially the sudden decline tendency of the head corresponding to the decrease of the NPSHA value. The critical NPSHA, that is, NPSH3, is defined as the NPSHA value when the head drops by 3%. In this study, the deviation between the obtained NPSH3 values of 2.32 m in the experiment and 2.22 m in the calculation is about 4.5%.

Cavitation performance of model pump.
5. Numerical Results and Discussion
5.1. Static Pressure Distribution on the Midspan of the Impeller
Since cavitation flows are always associated with the static pressure level inside the residual heat removal pumps under a certain temperature, the static pressure distributions on the midspan of the model pump under different cavitation conditions were investigated for the high, design, and low flow rates, which are 1.6Q d , 1.0Q d , and 0.8Q d , respectively. In particular, as shown in Figure 8, nine different cavitation conditions were selected. The static pressure distributions on the midspan for the nine NPSHA values at design flow rate are shown in Figure 8, where the five blade channels have been numbered progressively in the clockwise direction, which is the same as the impeller rotation.

Static pressure on the midspan of impeller at design flow rate.
As shown in Figures 8(a), 8(b), 8(c), and 8(d), the relative lower static pressure distributions at the impeller inlet on the cross section of the pump are quite axis-symmetric at the NPSHA value equal to 8.85 m, 8.34 m, 5.28 m, and 3.75 m, respectively. The area of low pressure distributions under the above four cavitation conditions gradually increased almost with the same growth rate due to the decrease of NPSHA value. The static pressure in the impeller inlet is significantly asymmetric for the NPSHA value of 2.63 m, where the area of low pressure of blade channel 2 is obviously larger than that of others and the low pressure also occurs on the pressure surface of each blade, as shown in Figure 8(f). It can be seen from Figures 8(g), 8(h), and 8(i) that the area of low pressure distributions in each blade channel almost shows no change except blade channel 2, in which the low pressure gradually increases as the NPSHA value drops from 2.42 m to 2.22 m.
5.2. Cavitation Distribution on the Impeller Blades
Due to the fact that steady cavitation simulation can be used to show the different development of cavity observed in the impeller, the vapor fraction ISO surface of the leading edge cavitation on the impeller blades at the design flow rate with the above nine NPSHA values is, respectively, illustrated in Figure 9. The cavity inception and development in the impeller are clearly obtained. The five blades have been numbered progressively in the clockwise direction as well, and the blade which locates in front of the pump outlet is numbered 2, as shown in Figure 9(a).

The distribution of vapor in impeller at design flow rate.
For the NPSHA value equal to 8.85 m, there is no cavity attached on the surface of blades, as shown in Figure 9(a). While the NPSHA decreases to 8.34 m, a small and thin cavity and an even smaller cavity first appear on the suction surface near the blade leading edge of blades 2 and 3, respectively, as shown in Figure 9(b). The cavity increases obviously and appears on the suction surface of each blade with the NPSHA value dropping down to 5.28 m, as shown in Figure 9(c), where the cavitation area becomes larger from hub to shroud because static pressure in the region near the shroud is lower than that of the hub. The cavity volume on the suction surface of blades 1, 3, 4, and 5 obviously increases with the NPSHA value dropping from 3.75 m to 2.63 m, while blade 2 shows a slight decrease for the cavity volume. As the NPSHA value drops to 2.63 m, which corresponds to the 3% of the head drop, the cavity in the impeller shows clear asymmetric distributions and the cavity on the suction surface of blade 3 occupies more than 50% of its length, as shown in Figure 9(f). Moreover, under asymmetric blade cavitation conditions, the flow rate in the blade channels with larger cavities is lower than in the blade channels with less intense cavities, which is consistent with the asymmetric static pressure distributions in the impeller analyzed in Figure 9. Further analysis shows that the occurrence of highly asymmetric cavitation becomes more obvious at lower NPSHA values, as illustrated in Figures 9(g), 9(h), and 9(i).
The development of the cavitation pockets for different NPSHA values at design flow rate and cavitation induced change in relative velocity in blade-to-blade section at 0.5 spans are shown in Figures 10 and 11, respectively. It can be seen from Figure 10 that the area of cavitation closure develops downstream along the suction surface with the decreasing NPSHA values. For the value of NPSHA equal to 5.28 m, the vapor bubbles have already appeared near the leading edge of the blade suction surface, which is corresponding to Figure 9(c); however, there are not enough quantities of cavities neither to change the static pressure distributions on the blade surface nor to influence the hydraulic performance of the model pump. With the pressure decreasing at the pump inlet, cavities gradually fill the space inside the blade channels along the impeller blades. As the NPSHA value drops to 2.63 m, the leading edge cavitation reaches the throat and takes half volume of one blade channel; meanwhile, the cavity causes a vortex flow generation in the rear of the cavitation region. As a vortex grows at the cavitation region, it influences the energy transfer and causes an increase of the losses; hence the working condition, where NPSHA value equals 2.63 m, shows great deterioration for the hydraulic performance of model pump. Additionally, as shown in Figure 10(d), the formation of a large separated cavity on the suction surface of a blade increases blockage of the corresponding blade channel. As the blade channel is blocked by cavitation, the inlet flow is locally reduced and the incidence flow angle is increased, leading to the reduction of cavitation in that channel; therefore, the two adjacent channels operate at different point on the impeller characteristic.

Vapor volume fraction in blade-to-blade section at 0.5 spans for different NPSHA values.

Vector distributions in blade-to-blade section at 0.5 spans for different NPSHA values.
6. Conclusions
In the present paper, the hydraulic performance and cavitating flow behavior have been investigated by numerical simulation with a scaled residual heat removal pump under different operating conditions. The following conclusions can be drawn.
The hydraulic performance of model pump in noncavitating conditions is proved to be in good agreement with the experimental results; on this basis, a numerical methodology with a mass transfer cavitation model is utilized to predict the cavitating flows in the model pump, and the cavitation performances are also well captured.
At design flow rate the head-drop curves display a typical creeping shape just before breakdown conditions, and it can be also indicated that the cavity volume grows when the NPSHA value is decreased and the shape of the cavities was nearly identical.
At design flow rate the typical development of the cavitation is asymmetric, with cavitation reaching its maximum intensity in one of the blades. This corresponding blade is almost completely filled with vapor as the NPSHA value drops to 2.32 m. The location and extent of the cavities strongly depend on the pressure field, which in turn is influenced by the flow geometry and operating conditions.
The cavitating internal flow analysis with the scaled residual heat removal pump indicates that the present computational methodology could capture the primary cavity structure.
Conflict of Interests
The authors declare that there is no conflict of interests regarding the publication of this paper.
Footnotes
Nomenclature
Acknowledgments
This study is supported by the State Key Program of National Natural Science of China (no. 51239005), National Science & Technology Pillar Program (no. 2011BAF14B04), National Natural Science Foundation of China (no. 51349004), and a project funded by the Priority Academic Program Development of Jiangsu Higher Education Institutions and the Scientific Innovation Program in Colleges and Universities of Jiangsu Province (no. KYLX_1040).